Test Charts creates test chart files for printing on high quality inkjet printers. This page focuses on Scalable Vector Graphics (SVG) charts, many of which are used for measuring sharpness (MTF) with Imatest SFR, SFRplus, eSFR ISO, Checkerboard, and SFRreg. (Bitmap charts are described elsewhere.) SVG charts can be printed any size at a printer’s maximum quality (i.e., resolution) with no limitations, and they generally require much less storage than bitmap images. The SVG charts designed for automated testing with SFRplus and eSFR ISO (based on ISO 12233:2014/2017) have numerous advantages over the familiar but obsolete ISO 12233:2000 chart.
Most of these charts are available through the Imatest Store. We do not recommend printing them unless you have a high quality photographic printer (office printers aren’t good enough), and skill in high quality color-managed printing. We cannot guarantee results from self-printed charts.
Introduction – Operation – General settings – Chart types – SFRplus settings
Saving PNG (bitmap) files – Printing
Introduction
Vector graphic images consist of primitives such as lines, polygons, etc., that can be scaled to any size and do not suffer from the pixilation problems of bitmap images. They print at the printer’s maximum quality, regardless of size. Vector graphics are excellent for generating test charts consisting of lines, curves, and areas that don’t require continuous grayscale tones.
Scalable Vector Graphics (SVG) is an XML file format recognized by the World Wide Web Consortium (W3C). SVG files can be read, edited, and printed by Inkscape— an excellent free open-source program. They can also be imported into Adobe Illustrator, Corel Draw, and others.
Operation
To run Test Charts, run Imatest and click on Test Charts in the Utility tab on the right of the Imatest main window. The dialog box shown below appears. The available settings change for different patterns.
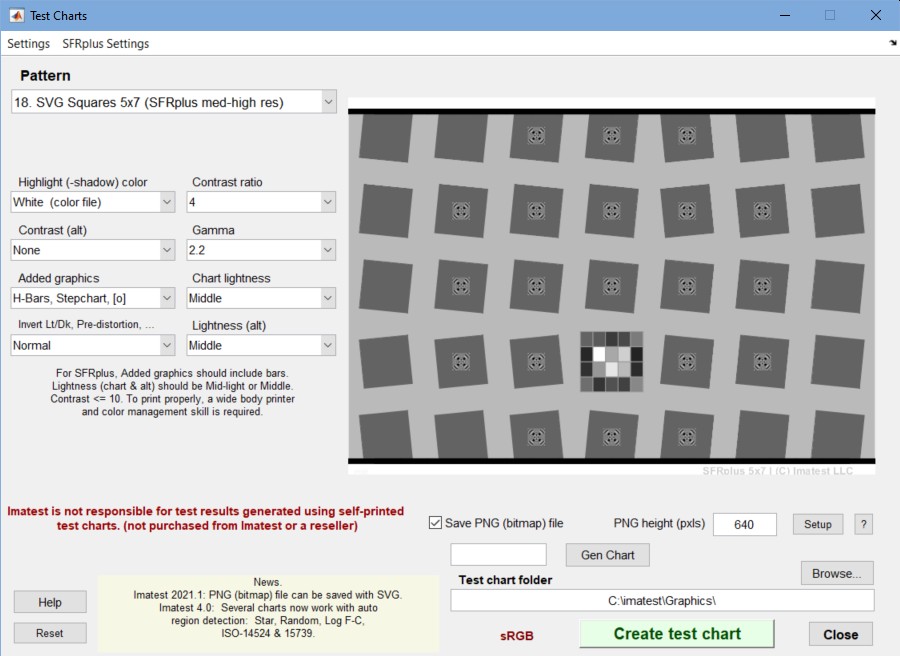 Test Charts settings for a 5×7 SFRplus chart with ISO-standard 4:1 contrast
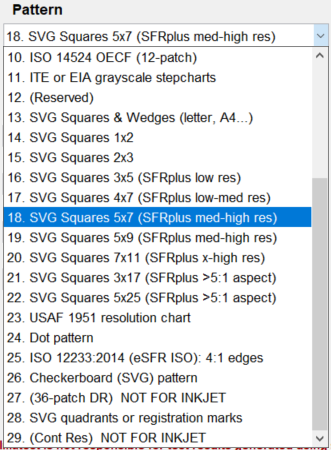
SVG chart pattern selections are shown in on the right (starting with SVG Squares & Wedges).
Select the Pattern (the type of chart) and the options. The chart preview appears immediately; it’s worth spending some time exploring the options (they won’t all be listed on this page). When the options have been selected, enter the test chart folder (directory) and file name, then click on Create test chart. You may cancel by clicking on Close. A preview figure showing the chart (not for printing) will be displayed. You can zoom in to see the fine detail. An example is shown below.
The figure with the image of the chart is for preview only: it shows you roughly what the chart looks like and lets you zoom in if you want. Do not print the chart directly from this figure. To print SVG charts, load the Print Test SVG output file (chart_temp.svg in the above example) into an editor that supports SVG. (Inkscape is recommended; Adobe Illustrator, Corel Draw, and others can also be used.) This will allow you to select the size of the print, add annotations, use color management, etc.
You can zoom in on the chart by selecting an area or clicking on a point of interest. Double-clicking restores the complete image. The preview image (or zooms of the image) may have some artifacts and appear jagged because it lacks anti-aliasing.

SVG chart preview (not for printing; use the output file!)
5×7 distorted chart; 4:1 contrast with focus aids in several squares.
General settings
These settings apply to most SVG charts.
Highlight color
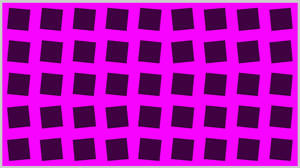
In addition to the standard White/Black (or White/Gray) charts, you can replace white with any additive or subtractive primary color: R, G, B, C, M, or Y.
Different colors are of particular interest in analyzing Bayer sensors, where alternate rows of pixels are sensitive to {R, G, R, B, R, …} and {G, B, G, B, G, …}. Since there are only half as many R and B sensors as green sensors (and one quarter as many as total pixels), one would expect MTF to be poorer for red-black and blue-black charts than for white-black). Demosaicing algorithms typically make use of different colored pixels for calculating detail (i.e., an edge in the red channel would be sharper if information is present in the other channels). Also, different algorithms perform differently.
Contrast ratio
Choices: None, Maximum, 80, 50, 40, 25, 20, 10, 5, 4, 2, 1.414, 1.2, 1.1
The ratio of the reflectivity of the light to dark areas (the upper zone only in the Log frequency chart). The maximum contrast ratio depends on the printer and paper. It is typically around 100 for glossy (or luster) surfaces, but only around 40 for matte surfaces. Maximum print density = -log10(minimum reflectivity) can be estimated by Gamutvision.
Clipping is often a problem with high contrast targets. The old (pre-2012) ISO-12233 standard calls for a contrast ratio of at least 40 (it was typically printed at 80), but recent experiments have shown that lower contrast ratios produce more accurate and consistent results, which are less affected by gamma and camera nonlinearities.The standard value for SFRplus charts is 10. In 2012 the ISO standard will change to recommend a contrast of 4:1, which is fully supported by both Test Charts and the SFRplus module.
Contrast ratio affects MTF (SFR) measurements in cameras that perform nonlinear signal processing, i.e., noise reduction and sharpening with thresholds— nearly universal in consumer cameras. Charts with at least two contrast ratios: 10 and 2 (set with Contrast (alt) ) are recommended for characterizing cameras.
Contrast (alt)
Choices: None, Maximum, 80, 50, 40, 25, 20, 10, 5, 4, 2, 1.414, 1.2, 1.1
Selects a second contrast ratio to display in a few regions in the lower left quadrant — Contrast (alt) = 2.0 is used in four regions in the 5x9 chart shown in the preview images above and below. All squares in the chart have the same contrast if None is selected. Contrast (alt) is of interest because the nonlinear signal processing in many (perhaps most) digital cameras causes high contrast edges to be sharpened more strongly than low contrast edges so that high and low contrast edges have different MTF measurements.
Gamma
Choices: 2.5, 2.2, 2.0, 1.8, 1.5, 1.0
You should use the value of gamma for your typical color space and workflow (2.2 is standard for Windows; 1.8 for older Mac systems). The default value is 2.2. Gamma affects the accuracy of the printed contrast ratio and the optional step chart: it must be the same value used for printing (the value of the color space, i.e., 2.2 for Adobe RGB (1998), if color management is used) to get the correct contrast ratio. Note that this is printer gamma, which is only indirectly related to camera gamma, which can be measured with Stepchart using the optional grayscale Step chart.
Chart lightness
Choices: Lightest, Light, Mid-light, Middle, Mid-dark,Darkest
Determines the grayscale level of both the light and dark areas of the chart. Valuable for SFR edge charts, where middle tones are likely to be in the camera’s linear response region.
Lightness (alt)
Choices: Lightest, Light, Mid-light, Middle, Mid-dark, Darkest
Lightness of the regions with the second (alternate) contrast ratio. Usually the same as Chart lightness.
Chart types
Test charts can generate several types of SVG chart. We list the charts below. We will not present a full list of settings here— you find what they do by opening Test charts, trying out various settings, and viewing their effect. Click on the chart images to view them at larger sizes.
Many chart designs are available in the Imatest Store. For unusual custom requirements, contact ![]() for details.
for details.
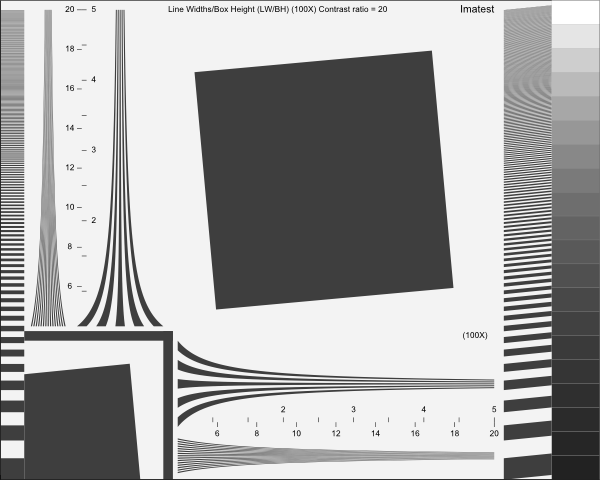
SVG Squares & Wedges (for printing letter size, A4, etc.)This pattern was designed when the Imatest SVG chart feature was first developed. It’s no longer an important part of Imatest because it doesn’t work with automatic ROI detection. It consists of tilted squares, “hyperbolic” wedges, bars of varying spatial frequencies, and a replica of the Kodak Q-13 step chart with density steps of 0.1. It is still of interest because it contains a variety of patterns. It is optimized for printing A4 or A3 or letter size on a high quality inkjet printer and mounted in groups on a a larger background, as shown on the right— though it can be printed any size without loss of quality. SFRreg patterns, which can be automatically detected, are now recommended for this purpose. Multiple SFRreg patterns can be used for fields of view (FoVs) that are impractically large for charts printed on a single sheet, where SFRplus, eSFR ISO, Checkerboard, and SFRreg are recommended. |
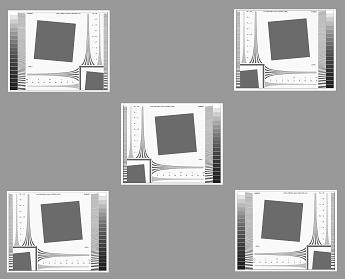 Arrangement of small prints |
|
The chart on the right was created using Contrast ratio = 20 (we now recommend 4 for most cases, with a maximum of 10), Gamma = 2.2, Highlight color = White, and Chart lightness = Light. Chart details: The edges in the center square and the solid on the lower right are tilted approximately 5.7 degrees (arctan(0.1) ) for use in SFR. The converging line patterns (“hyperbolic” wedges) are intended for viewing moiré patterns: colors resulting from aliasing near the Nyquist frequency. They can be analyzed with the Wedge module, which measures MTF and vanishing resolution (the onset of aliasing). The step chart pattern on the right has density steps of 0.1 if the image is printed correctly: it is a replica of the Kodak Q-13 chart. Two charts are available for download. Each is 304 KB (SVG) or 500 KB (PDF— for those of you who don’t want to bother installing Inkscape). Right-click on the links to save the file.
|
 SVG Squares and Wedges pattern |
SVG Squares 1×2, 2×3, 3×5
These can be used to generate slanted-edge patterns for relatively low resolution systems. They are not widely used in Imatest.
SVG Squares 4×7 and greater (for SFRplus)
These charts are used with SFRplus, with 5×7 and 5×9 recommended for most applications. 7×11 is only recommended for very high resolution cameras. 3×17 and 5×25 are for cameras with extremely wide aspect ratios. They can be edited down in Inkscape if needed. Typical settings are shown above.
SFRplus settings
SFRplus chart settings. Click on image to view full-sized.
Although we recommend purchasing the SFRplus chart from the Imatest Store, you can print it yourself if you have a widebody photographic-quality inkjet printer and some skill (i.e., knowledge of color management). 5×7 and 5×9 are the standard grid sizes, though 4×7, and 7×11 grids are also compatible with SFRplus. Many options, listed below, are are compatible with SFRplus.
Options for SFRplus charts. The standard values are enclosed in brackets […].
- Pattern: [5×7 and 5×9] SVG Squares, 4×7, 5×7, 5×9, 7×11 are compatible with SFRplus. The numbers on the right are the minimum recommended size when printed on inkjet printers.
- Highlight color: [White] White is preferable in most cases, but additive and subtractive primaries (R, G, B, C, M, or Y) may be selected.
- Contrast ratio: [10:1] Values above 20 are not recommended because clipping can become a frequent occurrence. When the new (expected in 2012) ISO 12233 standard is released, 4:1 will become a standard chart contrast.
- Contrast (alt): [2] Alternate contrast for a few squares (four in the above image). Useful because signal processing is not uniform in most digital cameras: maximum sharpening (high spatial frequency boost) takes place in the vicinity of contrasty features and there is less sharpening (or noise reduction, which is the opposite of sharpening lowpass filtering) when there are no contrasty features in the neighborhood. When signal processing is nonuniform low contrast edges have different (lower) MTF than contrasty edges.
- Gamma: [2.2] Gamma (contrast) used for printing. For sRGB or Adobe RGB (both common Windows color spaces), use gamma = 2.2
- Added graphics: [H-Bars, SQ-20 stepchart, Focus star] This includes a 20-step (5×4) stepchart with density increment of 0.1 and bars for measuring distortion.
- H-Bars (Horizontal bars at the top and bottom) are a part of the standard SFRplus chart design, and should be generally included (though bars are not strictly necessary in Imatest 3.9+).
- Stepchart (grayscale step chart). A 4×5 chart with density increment of 0.1 is generally recommended for inkjet-printed charts.
- Focus star. Generally recommended. A focus aid, not used for analysis. May be replaced by a color pattern in charts printed by Imatest.
- [0]. Designates a small focus aid pattern at the center of some of the squares. This is a modified version of the pattern in the center of the squares in the (to be released in 2012) low-contrast ISO 12233 edge pattern, designed to minimize effects on automatic edge detection.
- Chart Lightness: [Mid-light] Lightness outside of the squares.
- Invert Lt/Dk, Distortion, Special: Many options available.
- Normal (H & V) The standard SFRplus chart.
- Invert (H & V) Light and dark squares inverted except for grayscale stepchart.
- Normal (Hexagons) Hexagons instead of square patterns.
Include near-45 degree edges in addition to near vertical and near-horizontal edges, which makes them useful for examining motion-related blur. Hexagon orientation alternates. Illustrated on the right. - Invert (Hexagons)
- Normal (Sag & Merid.) Sagittal and Meridional (i.e., radial and tangential) squares. Not yet supported as of Imatest 3.9.
- Invert (Sag & Merid.)
- Normal Distorted Pre-distorted chart for use with moderate fisheye (strongly barrel distorted) lenses.
- Invert Distorted
- Normal Distorted+ Pre-distorted chart for use with extreme fisheye lenses.
- Invert Distorted+
- Normal Custom distort Pre-distorted chart with custom distortion (can go to ridiculous extremes).
- Lightness (alt): [Mid-light] Lightness near the alternate contrast squares. Best left the same as Chart Lightness.
Specify the folder and file names in the boxes on the lower right, then click Create test chart to save the chart in SVG format.
Print the chart following Instructions in below. Prints should be made with photographic quality inkjet printers on high quality paper: semigloss, luster, or smooth coated matte. Matte is strongly recommended for wide angle lenses because it is (mostly) immune from glare.
Print (paper) size can be as small as 13×19 inches for low resolution images (under 3 megapixels), but chart width should be at least 24 inches for compact digital cameras under 6 megapixels), 39 inches (printed on 24-inch paper; fits nicely on 40 inch foam board) for DSLRs and other cameras up to 15 megapixels, and 60 inches (printed on 44-inch paper; fits on 40×60 inch foam board) for high-quality 15+ megapixel cameras. Be sure the edges look clean and sharp to your eyes; examine them with a good magnifier or loupe. Chart quality is described in detail in Chart quality and distance.
If you choose to print the chart we strongly recommend that you be familiar with high quality color-managed photographic printing. You’ll need a widebody photographic-quality inkjet printer. Instructions are complex and should be followed with care. NEVER print charts on plain bond paper. Edge quality is poor and test results tend to be more indicative of (poor) chart quality than the system under test.
The printed chart should be mounted on large sheets of 1/2 inch (12.5 cm) thick foam board with spray adhesive or double-sided tape. 1/2 inch foam board stays flatter than standard 1/4 or 3/8 inch board.
 USAF 1951 resolution chart
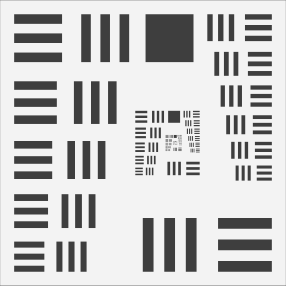
The venerable USAF resolution 1951 illustrates how MTF affects the appearance of standard images. It is not supported by any Imatest module. We do not recommend it for testing. It is poorly suited for automated measurements and much space is wasted, but for better or worse, it’s familiar and makes a good visual example. Numbers (mostly useless) are omitted.
Adjacent bar pattern sizes differ in size by a factor of the sixth root of two (21/6 ). The chart is described on en.wikipedia.org/wiki/1951_USAF_resolution_test_chart.
Dot patternDot pattern charts are designed to be used with the Imatest Dot Pattern module for measuring distortion and lateral chromatic aberration according to the CPIQ (Camera Phone Image Quality) standard. Although many options are available, printing with a contrast ratio of 10 or more is generally recommended. To be fully compliant with the CPIQ standard, use a dot radius of 0.16 and at least 15 vertical dots. |
|

ISO 12233:2014 (eSFR ISO): 4:1 edgesKey settings: Grayscale and Added squares lets you choose a number of configurations, including Enhanced (3:2), Extended (16:9), extra wedges. The SFRreg center chart can be selected here. Inner circle/square: Inner sqs is strongly recommended. Circles can interfere with eSFR ISO edge detection. The chart illustrated in the ISO 12233:2014 standard has only 9 squares. Since the area outside the squares is not specifies, the added squares (on the sides) and wedges and other changes do not affect ISO compliance, but they make the chart much more useful. (The three dots in the original are not sufficient for automatic detection.) |
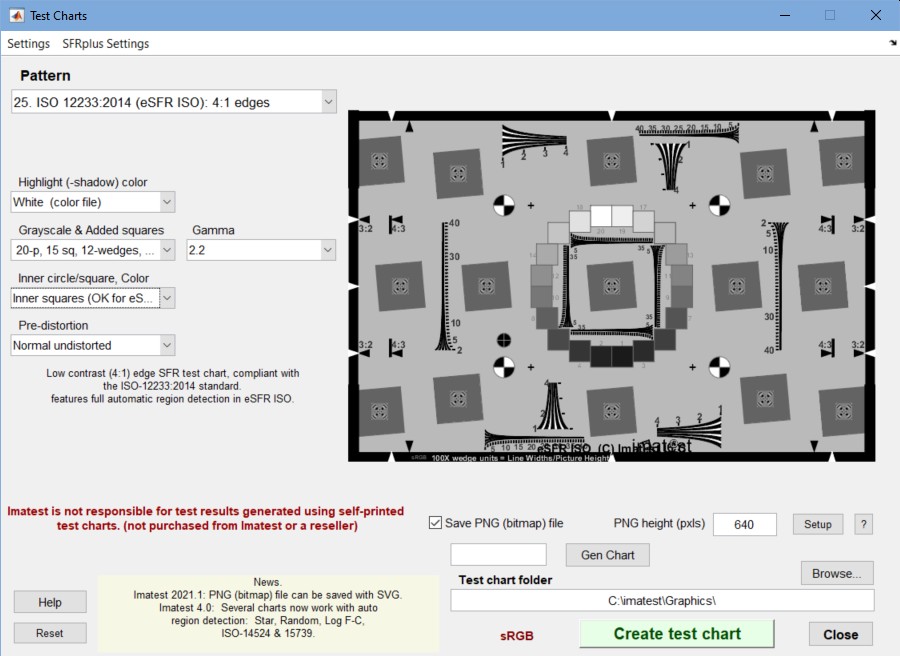 eSFR ISO chart settings. Click on image to view full-sized. |
Checkerboard (SVG) patternThis selection (rather than the bitmap Distortion Grid of Checkerboard) is recommended for generating Checkerboard charts. The number of vertical squares should be in the neighborhood of 12 (not too many or too few). 4:1 or 10:1 contrast ratio is recommended. |
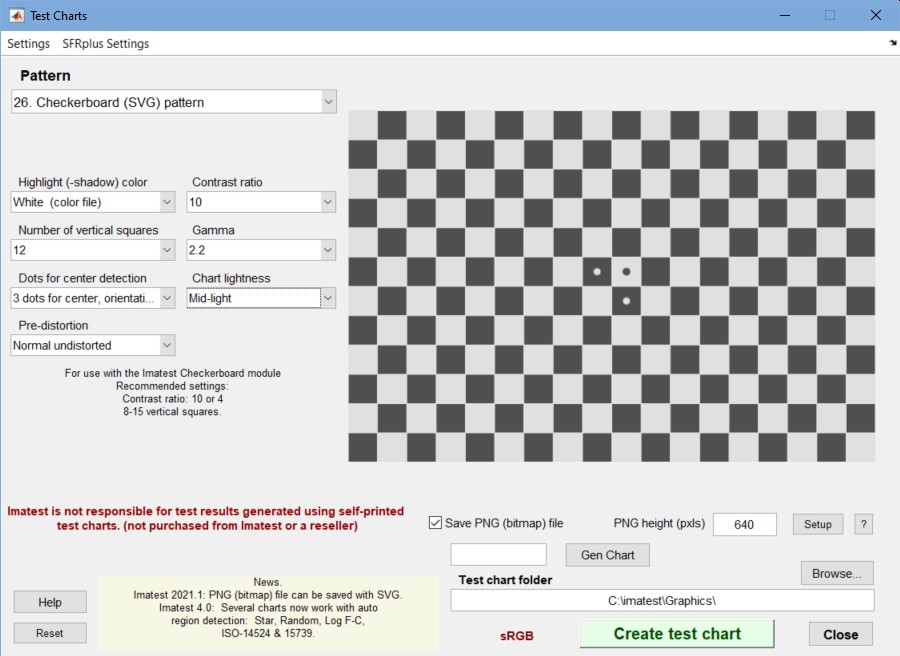 Checkerboard chart settings. Click on image to view full-sized. |
| (36-patch DR) NOT FOR INKJET | |
SVG quadrants or registration marks (for SFRreg)These can be printed any size and arranged as desired. SFRreg charts have a number of interesting uses. 4:1 or 10:1 contrast ratio is recommended. |
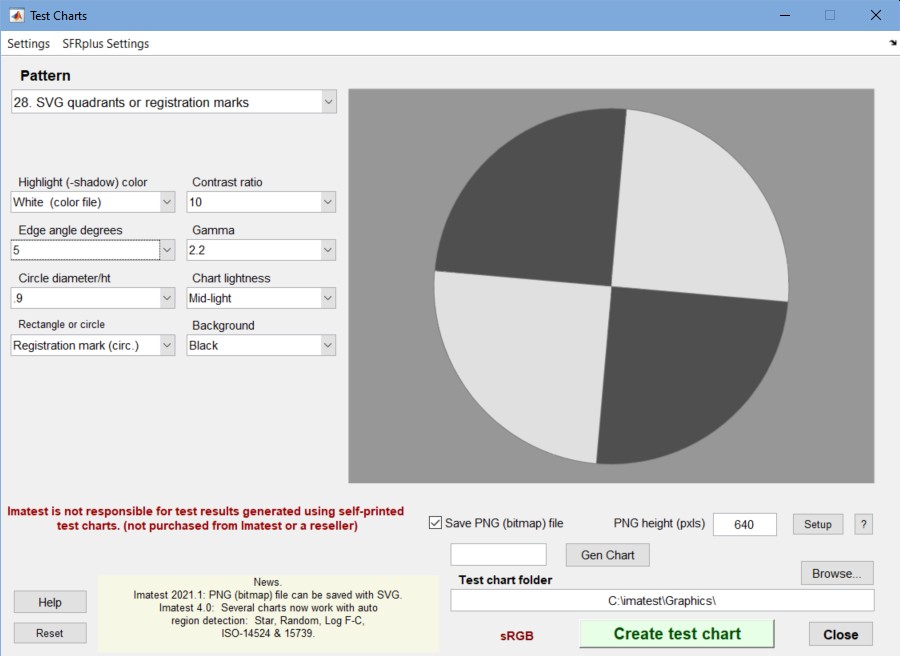 SFRreg chart settings. Click on image to view full-sized. |
Saving PNG (bitmap) files along with SVG files
Starting with Imatest 2021.1, a bitmap (PNG) file can be saved along with the SVG file. This should be unnecessary most of the time, but there are occasions when a bitmap image is useful, for example, for modeling image sensors in complete imaging system simulations (under development). Here are the steps you’ll need to follow.
- Download and install Inkscape (it’s free and it’s excellent for editing and printing SVG files). If you have an older version (prior to 1.0.1), we recommend uninstalling it first. Inkscape is available in Windows, Macintosh, and Linux versions. Note the folder where inkscape.exe is installed (the Windows default is C:\Program Files\Inkscape\bin.)
Save PNG area, below the preview image
- Click Setup, then enter the inkscape.exe folder.
- To save a PNG file when you click Create test chart , check Save PNG (bitmap) file and select the PNG (image) height in pixels. The width will be proportional. ? opens a link to this page.
The bitmap (PNG) conversion is performed by issuing a system command with a syntax described in the Inkscape Man Page. For an SVG file named “chart_temp.svg” with image height specified as 640 pixels in a typical Windows system, the system command is
“C:\Program Files\Inkscape\bin\inkscape.exe” –export-type=png -h 640 “C:\imatest\Graphics\chart_temp.svg”
PNG is the only standard bitmap file format included in Inkscape’s list of export types: svg, png, ps, eps, pdf, emf, wmf, xaml. PNG files can be converted into other bitmap file formats in almost any image editor. We frequently use Irfanview, which is free and powerful.
Printing SVG charts
You can print SVG charts directly from Inkscape. Images can also be converted bitmap (PNG) format (not recommended for printing) or saved in PDF format (from Inkscape) and printed by a PDF viewer such as Adobe Acrobat or Foxit reader.
You should always preview printed images prior to issuing the final print command.
Printing from Inkscape
- Download and install Inkscape. To access the excellent built-in tutorials, open Inkscape and click , .
- Run Imatest Test Charts to create an SVG chart. Be sure to choose an appropriate folder and file name. The file extension is svg.
- Open the saved SVG file with Inkscape. You may want to do some editing. For example, to create a mirror image, select the chart image and click , . You can right-click on the selected chart, click Ungroup, then rearrange the chart to meet your needs.
- Set the print options. The settings for correct printing are somewhat complex.
Document Properties window
Click File, Document Properties… to open the Document Properties window, shown on the right. Display the Page tab. Under Format you can select a standard page size such as US Letter, A4, etc., or you can select a custom page size. Most large format inkjet printers require custom page size. For example, for a 13×19 inch print, enter 19.00 for Width, 13.00 for Height, and in (inches) in the units box to the right of Width. Page orientation: should be set to Landscape. When you have finished selecting the page size, click X on the upper-right to close the window.
In the Inkscape window (below), select the figure, click on the small padlock icon between W and H to lock the aspect ratio, then set either W or H to the desired dimension. The other will follow. Set X to the left and Y to the bottom margins. The values shown (X = 0.5, Y = 0.25, W = 10, H = 8, in (inches)) center the image on US Letter-size 8.5x11 inch paper. Alternatively, you can enlarge the image by dragging one of the corner arrows while pressing the Ctrl key to maintain the aspect ratio.
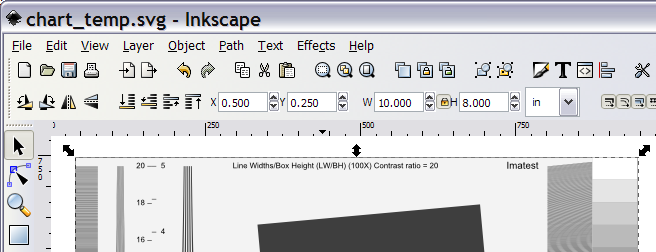
Portion of Inkscape window showing print settings (X, Y, W, H,…)
Epson R2400 printer driver dialog box
- Click on , to open the Print dialog window. Then click on to open the printer Properties dialog window. High quality print settings and papers should always be used. Set Orientation to Landscape. If ICC color management is not used and the printer driver can select gamma, be sure to use the same gamma you used to create the chart (2.2 is generally recommended).
- The image on the right shows the Print dialog box for the Epson R2400, set to perform color management in the printer driver because Inkscape is not ICC compliant. (It does not recognize ICC profiles). Using color management/ICC profiles results in the most accurate tonal response: the contrast will be closest to what you expect.
- If you have an ICC printer profile, you may be able to apply it in the printer driver window. Manufacturer-supplied profiles are often sufficient; custom profiles are better when tonal values are critical. SilverFast 8.5 – Printer Calibration is an excellent low-cost means of obtaining ICC printer profiles without a spectrophotometer— using a flatbed scanner calibrated with an It8.7 chart.
Adobe RGB (1998) is the recommended input profile because it has a gamma of exactly 2.2 (sRGB is only approximately 2.2). Relative Colorimetric rendering intent should have a more linear response than Perceptual (see Black Point Compensation). Print Preview should be checked because the print size will only be correct unless all settings described above are exactly correct– Inkscape is quite unforgiving with print size settings. The preview can be rather slow.
- Click in the Properties window, then in the Print dialog window. Printing starts after a processing delay, which can be quite long, depending on the computer’s memory and speed — often over a minute.
Inkscape Export Bitmap dialog box
Printing a bitmap file from an image editor
We don’t generally recommend this approach, in part because very large charts require huge file sizes and pixilation is likely. When possible, print directly from SVG or PDF files.
- Follow steps 1-4 above: Install Inkscape, create the SVG test chart, save it, open it in Inkscape, select the chart image, then set the page and image size using the Document Properties window and image size using the handles at the corner of the chart image.
- Click File, Export bitmap… to open the Export Bitmap window, shown on the right. Set units to in or cm, as desired. Width (upper right) is the width of the chart image to be printed (the length of the bars). Height is slightly larger than the visible height of the printed image because there is a blank white area above and below the bars.
- Set dpi (in Bitmap size) to 300 or 600 for Canon or HP printers; 360 or 720 for Epson printers. Smaller charts (under 24 inches wide) may be slightly sharper at the higher dpi setting, though the difference is nearly invisible. For very large prints (30 inches wide or wider) the lower dpi setting may be advisable to conserve memory. Width and Height show the resulting file pixel size (these boxes should not be changed).
- Set Filename to the desired location. Keep the PNG format. PNG is losslessly compressed — and highly compressed for a simple image of this type. Then click on Export.
- Load the image into your image editor. Print it on the same paper size specified in the Document Properties and with the same width indicated in the Export Bitmap window. If you have a color-managed workflow (strongly recommended), set the file profile to Adobe RGB (without changing the data). Adobe RGB is slightly more accurate than the Windows standard sRGB color space because it has a gamma of exactly 2.2 (sRGB is only approximate). Set the Rendering intent to Relative Colorimetric with Black Point compensation OFF.
Printing a PDF file from Foxit reader
Foxit Reader print dialog box.
We developed this approach when we were having trouble printing from Inkscape 0.46.
- We have had excellent results with this approach, but if you try it you should know how to set your printer driver to perform color management.
- Follow steps 1-4 above: Install Inkscape, create the SVG test chart, save it, open it in Inkscape, select the chart image, then set the page and image size using the Document Properties window and image size using the handles at the corner of the chart image.
- Click File, Save As… In the Save as type dialog box, select Portable Document Format (*.pdf), then save the file.
- Open the file in a PDF reader such as Foxit Reader.
- Click on File, Print… or the Print icon. The dialog box shown on the right (for Foxit Reader) appears.
- Be sure the size and printer driver settings are correct. The settings shown on the right are typical, but “mileage may vary”. Color management needs to be applied by the printer driver. Typical settings are shown on the right. Then click on OK. It is strongly recommended that you preview the print, if possible.
Measuring and calibrating the charts
A procedure for measuring the grayscale and color patches in test charts is given in Measuring test chart patches. The CGATS files produced by these measurements can be read by any of the Imatest modules that analyze color or grayscale charts: Color/Tone Interactive, Colorcheck, Stepchart, Rescharts (SFRplus), or MultiTest.
