Search Results for: MTF
Verification of Long-Range MTF Testing Through Intermediary Optics
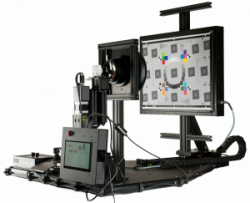
Measuring the MTF of an imaging system at its operational working distance is useful for understanding the system’s use case performance.
Interpreting MTF50
What MTF50 is Needed for Prints? Determining MTF50 depends on the print size. If you plan to print large posters (20 × 30 inches or over), the more MTF50, the sharper your prints will appear. Any high-quality, 4+ megapixel digital camera (that is, one that produces good test results; MTF50(corr) > 0.3 cycles/pixel) is capable of producing excellent 8.5 × 11 inches (letter-size; A4) prints. At that size a fine DSLR wouldn’t offer a large advantage in MTF. With fine lenses and careful technique (a different RAW converter from Canon’s and a little extra sharpening), my 6.3-megapixel Canon EOS-10D (corrected […]
Summary Metrics Derived from the MTF Curve
Summary Metric Description Comments MTF50 MTFnn Spatial frequency where MTF is 50% (nn%) of the low (0) frequency MTF. MTF50 (nn = 50) is widely used because it corresponds to bandwidth (the half-power frequency) in electrical engineering. The most common summary metric; correlates well with perceived sharpness. Increases with increasing software sharpening; may be misleading because it “rewards” excessive sharpening, which results in visible and possibly annoying “halos” at edges. MTF50P MTFnnP Spatial frequency where MTF is 50% (nn%) of the peak MTF. Identical to MTF50 for low to moderate software sharpening, but lower than MTF50 when there is a software […]
MTF Measurement Matrix
Imatest measures MTF using a variety of techniques (see table below), each of which gives different results in imaging systems because image processing depends on local scene content that is rarely constant throughout an image. Sharpening (high frequency boost) tends to be maximum near high-contrast features, while noise reduction (high frequency cut, which can obscure fine texture) tends to be maximum in their absence. For this reason, MTF measurements can be very different with different test charts. In principle, MTF measurements should be the same when no nonuniform or nonlinear image processing is applied (e.g., when the image is demosaiced […]
Test chart suitability for MTF measurements
Chart suitability display | Inkjet matte | B&W photo paper | Color LVT | B&W LVT | MTF suitability calculations Whenever a test chart is used to measure camera MTF (sharpness)— and that includes a large portion of Imatest measurements— we need to know if the chart is good enough to reliably measure MTF. In practice, “good enough” means that chart MTF projected on the image sensor will have little effect on the MTF measurement (which, by definition, includes the chart and the camera). This is generally the case for charts large enough to conform to traditional Imatest recommendations. But there are situations where the charts are […]
Compensating camera MTF measurements for chart and sensor MTF
Summary— Starting with Imatest 5.1 MTF measurements can be compensated for measured chart quality. Chart MTF compensation can double the megapixel suitability of a test chart. Results taken with different test charts will be more consistent. An approximate lens MTF calculation (independent of chart MTF compensation) has been added. It is based on a geometrical model of sensor MTF, which is used because reliable sensor MTF measurements are difficult to obtain. It’s not perfect, but it is good enough for many measurements. A Chart Quality Calculator lets you determine the suitability of a test chart (based on the camera’s Vertical […]
Slanted-edge MTF measurement consistency
Note: This page is not quite complete, but we felt that the results are important enough to be presented in its present (nearly complete) state. Method – Results – MTF50 failure – MTF Area In this page we analyze the consistency of slanted-edge MTF measurements, focusing on the effects of noise and region size on measurement consistency. We describe the test procedure in sufficient detail to enable Imatest users to perform similar studies for themselves. We also discuss some important and recognizable situations where consistency may be compromised. these include systems with strong response above the Nyquist frequency (0.5 cycles/pixel), which […]
MTF Compare
Compare MTFs of individual edge regions in different cameras and lenses Introduction to MTF Compare MTF Compare (not included in Imatest Studio), is a post-processor for comparing the MTFs of different cameras, lenses, and imaging systems that have been analyzed by SFR, Rescharts Slanted-edge SFR, SFRplus, or eSFR ISO, and had results saved in CSV files. Comparisons are displayed as quotients of MTFs, i.e., transfer functions. For two imaging systems A and B, MTF Compare plots MTF(A)/MTF(B) or MTF(B)/MTF(A) along with MTF(A) and MTB(B) (shown as faint lines below). Details depend on the Display setting. Displays ratios or values of […]
MTF curves and Image appearance
Correlating measurement with appearance Modulation Transfer Function (MTF) is a fundamental measure of imaging system sharpness. It is introduced in Sharpness and discussed further in Sharpening. MTF is measured by Imatest SFR, SFRplus, and by several Rescharts modules. The most frequent questions that arise in sharpness (MTF) testing are “What does the MTF curve mean?” and “How does MTF correlate with image appearance?” In this page we attempt to answer these questions through examples that let you quickly compare images with corresponding MTF curves by clicking on Quick links to the left of each each edge image. Introduction The procedure […]
SFR results: Edge and MTF (Sharpness) plot
A key result of the SFR, SFRplus, and eSFR ISO modules If you entered Imatest on this page, you may want to explore the background information in these links. Sharpness introduces sharpness measurements and MTF. How to test Lenses with Imatest contains concise instructions on testing lenses using SFRplus and eSFR ISO. Image quality factors lists the factors measured by Imatest. Table of contents (documentation) Imatest SFR, SFRplus and eSFR ISO display Edge profiles and SFR (Spatial frequency response, i.e., MTF) plots with spatial frequency labeled in one of the following units: Cycles per […]
Summary Metrics Derived from the MTF Curve
Summary Metric Description Comments MTF50 MTFnn Spatial frequency where MTF is 50% (nn%) of the low (0) frequency MTF. MTF50 (nn = 50) is widely used because it corresponds to bandwidth (the half-power frequency) in electrical engineering. The most common summary metric; correlates well with perceived sharpness. Increases with increasing software sharpening; may be misleading because it “rewards” excessive sharpening, which results in visible and possibly annoying “halos” at edges. MTF50P MTFnnP Spatial frequency where MTF is 50% (nn%) of the peak MTF. Identical to MTF50 for low to moderate software sharpening, but lower than MTF50 when there is a software […]
MTF Compare
Compare MTFs of individual edge regions in different cameras and lenses Introduction to MTF Compare MTF Compare (not included in Imatest Studio), is a post-processor for comparing the MTFs of different cameras, lenses, and imaging systems that have been analyzed by SFR, Rescharts Slanted-edge SFR, SFRplus, or eSFR ISO, and had results saved in CSV files. Comparisons are displayed as quotients of MTFs, i.e., transfer functions. For two imaging systems A and B, MTF Compare plots MTF(A)/MTF(B) or MTF(B)/MTF(A) along with MTF(A) and MTB(B) (shown as faint lines below). Details depend on the Display setting. Displays ratios or values of […]
SFR results: Edge and MTF (Sharpness) plot
A key result of the SFR, SFRplus, and eSFR ISO modules If you entered Imatest on this page, you may want to explore the background information in these links. Sharpness introduces sharpness measurements and MTF. How to test Lenses with Imatest contains concise instructions on testing lenses using SFRplus and eSFR ISO. Image quality factors lists the factors measured by Imatest. Table of contents (documentation) Imatest SFR, SFRplus and eSFR ISO display Edge profiles and SFR (Spatial frequency response, i.e., MTF) plots with spatial frequency labeled in one of the following units: Cycles per […]
MTF curves and Image appearance
Correlating measurement with appearance Modulation Transfer Function (MTF) is a fundamental measure of imaging system sharpness. It is introduced in Sharpness and discussed further in Sharpening. MTF is measured by Imatest SFR, SFRplus, and by several Rescharts modules. The most frequent questions that arise in sharpness (MTF) testing are “What does the MTF curve mean?” and “How does MTF correlate with image appearance?” In this page we attempt to answer these questions through examples that let you quickly compare images with corresponding MTF curves by clicking on Quick links to the left of each each edge image. Introduction The procedure […]
Slanted-edge MTF measurement consistency
Note: This page is not quite complete, but we felt that the results are important enough to be presented in its present (nearly complete) state. Method – Results – MTF50 failure – MTF Area In this page we analyze the consistency of slanted-edge MTF measurements, focusing on the effects of noise and region size on measurement consistency. We describe the test procedure in sufficient detail to enable Imatest users to perform similar studies for themselves. We also discuss some important and recognizable situations where consistency may be compromised. these include systems with strong response above the Nyquist frequency (0.5 cycles/pixel), which […]
Compensating camera MTF measurements for chart and sensor MTF
Summary— Starting with Imatest 5.1 MTF measurements can be compensated for measured chart quality. Chart MTF compensation can double the megapixel suitability of a test chart. Results taken with different test charts will be more consistent. An approximate lens MTF calculation (independent of chart MTF compensation) has been added. It is based on a geometrical model of sensor MTF, which is used because reliable sensor MTF measurements are difficult to obtain. It’s not perfect, but it is good enough for many measurements. A Chart Quality Calculator lets you determine the suitability of a test chart (based on the camera’s Vertical […]
Interpreting MTF50
What MTF50 is Needed for Prints? Determining MTF50 depends on the print size. If you plan to print large posters (20 × 30 inches or over), the more MTF50, the sharper your prints will appear. Any high-quality, 4+ megapixel digital camera (that is, one that produces good test results; MTF50(corr) > 0.3 cycles/pixel) is capable of producing excellent 8.5 × 11 inches (letter-size; A4) prints. At that size a fine DSLR wouldn’t offer a large advantage in MTF. With fine lenses and careful technique (a different RAW converter from Canon’s and a little extra sharpening), my 6.3-megapixel Canon EOS-10D (corrected […]
MTF Measurement Matrix
Imatest measures MTF using a variety of techniques (see table below), each of which gives different results in imaging systems because image processing depends on local scene content that is rarely constant throughout an image. Sharpening (high frequency boost) tends to be maximum near high-contrast features, while noise reduction (high frequency cut, which can obscure fine texture) tends to be maximum in their absence. For this reason, MTF measurements can be very different with different test charts. In principle, MTF measurements should be the same when no nonuniform or nonlinear image processing is applied (e.g., when the image is demosaiced […]
Understanding collimator MTF loss using bronze and golden sample testing
by Henry Koren, inspired by Paul Romanczyk, edited by Norman Koren Not all MTF measurement systems will necessarily provide the same results. The quality of the test target can impact the measurements you obtain. Long distance tests are ideally performed at the hyperfocal distance, where there is enough depth of field to have acceptable focus at infinity.
Test chart suitability for MTF measurements
Chart suitability display | Inkjet matte | B&W photo paper | Color LVT | B&W LVT | MTF suitability calculations Whenever a test chart is used to measure camera MTF (sharpness)— and that includes a large portion of Imatest measurements— we need to know if the chart is good enough to reliably measure MTF. In practice, “good enough” means that chart MTF projected on the image sensor will have little effect on the MTF measurement (which, by definition, includes the chart and the camera). This is generally the case for charts large enough to conform to traditional Imatest recommendations. But there are situations where the charts are […]