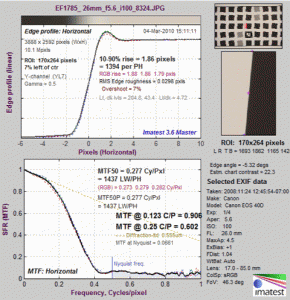
The Edge/MTF plot from Imatest SFR is shown in Figure 1. SFRplus, eSFR ISO, SFRreg, and Checkerboard produce similar results and much more.
Figure 1. Edge/SFR results for an SFRplus image from a 10 Megapixel DSLR
- Upper-Left—A narrow image that illustrates the tones of the averaged edge that is aligned with the average edge profile (spatial domain) plot, immediately below.
- Middle-Left—Average Edge (Spatial domain): The average edge profile shown here linearized, i.e., proportional to light energy. A key result is the edge rise distance (10-90%), shown in pixels and in the number of rise distances per Picture Height. Other parameters include overshoot and undershoot (if applicable). This plot can optionally display the line spread function (LSF: the derivative of the edge).
- Bottom-Left—The Spatial Frequency Response (MTF), shown to twice the Nyquist frequency. A key summary result is MTF50, the frequency where contrast falls to 50% of its low frequency value, which corresponds well with perceived image sharpness. It is given in units of cycles per pixel (C/P) and Line Widths per Picture Height (LW/PH). Other results include MTF at Nyquist (0.5 cycles/pixel; sampling rate/2), which indicates the probable severity of aliasing and user-selected secondary readouts. The Nyquist frequency is displayed as a vertical blue line. The diffraction-limited MTF response is shown as a pale brown dashed line when the pixel spacing is entered (manually) and the lens focal length is entered (usually from EXIF data, but can be manually entered).
For this camera, which is moderately sharpened, MTF50P (displayed only when the Standardized sharpening display is unchecked) is identical to MTF50.
Click on the thumbnails or image below so see the relationship between visible sharpness and Edge and MTF measurements for the Canon EF 17-85mm zoom at 26mm, f/5.6, which is not a great lens— sharpness falls off badly in the corners— but makes an excellent example. The first image shows a 3D map of MTF50 over the image surface. The remaining images show the enlarged edge and the edge profile and MTF measurements for several regions. To obtain this plot, Run an SFRplus or eSFR ISO image in Rescharts (you can click SFRplus setup), then Select 8. Image & Geometry with the Crop to ROI option (or you check a box in the Edge and MTF plot). After you click on the region (1. Center V, etc.) you can quickly scroll through regions using your keyboard’s up and down-arrows (↑ and ↓).
|
|
|
|
|
|
 |
 |
Notes:
-
-
-
- At typical screen resolutions, the edge shown above would be contained in an image around 1 meter high.
- SFR Results: MTF (sharpness) plot describes this Figure in detail.
- MTF curves and Image appearance contains several examples illustrating the correlation between MTF curves and perceived sharpness.
-
-


