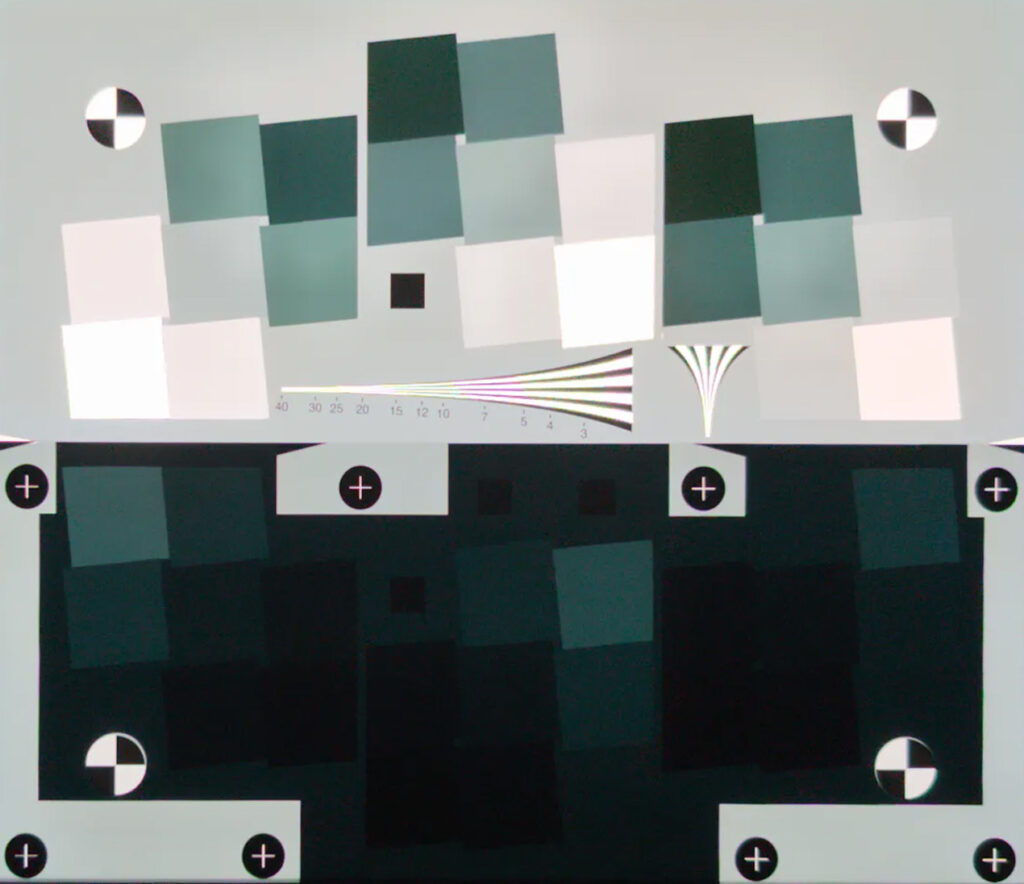
The InfoDR target is a two-layer transmissive film chart comprised of 42 patches and 48 slanted edges, with a total density range of 5.2 or 104 dB. Enables the measurement of information capacity over a wide range of illumination levels. Can be analyzed with Imatest 26.1.4. See the white paper: Image Quality Testing Based on Information Metrics
Purchase Chart
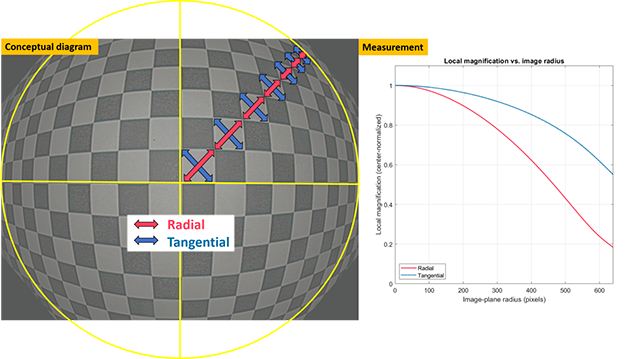
Checkerboard analysis enhanced to calculate local magnification and related metrics based on Q.Wang et al. 2016 Quantifies how magnification varies across the image field Provides deeper insight into lens distortion beyond a single global distortion metric Models the relationship between object and image radii Computes both radial and tangential magnification variations Outputs distortion plots, projection classification, corrected images, and data for further analysis
Learn More
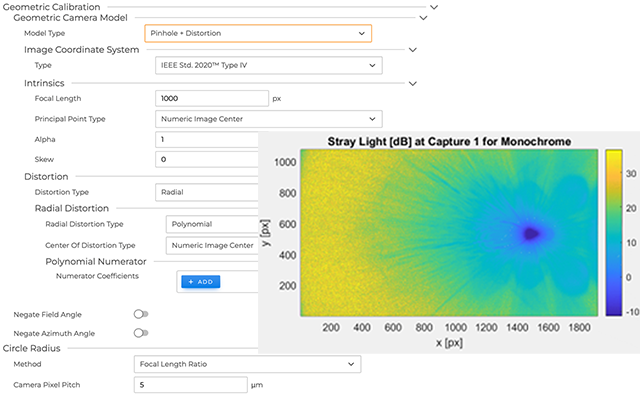
New Outputs
Color/Tone CCE Summary Metrics: Flatfield nonuniformity with respect to center ROI: JSON/CSV results now includes the uniformity of the side and corner regions relative to the center region, as a percentage (0-100).
Other
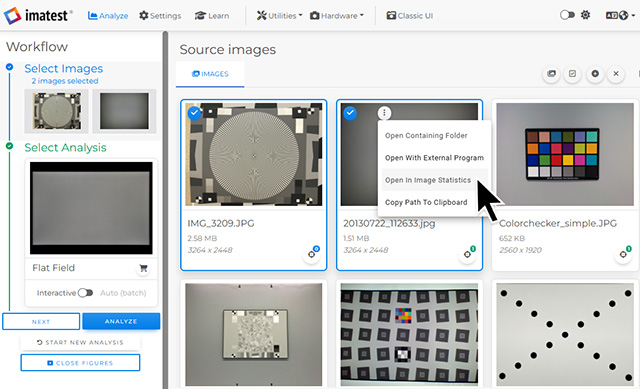
Color Science: Now includes the ability to use Display P3 (D65) luminance weights.Imatest IT is now compatible with .NET framework 9.0
Uploaded
Failed
Quote Cart