

Opto-Electronic Conversion Function
- Technical Committee
- ISO/TC 42 Photography
- Published
- 2015-01-13
What is OECF?
The opto-electronic conversion function (OECF) is the relationship between the log luminance of a scene and the digital values in the image a camera makes of it: the camera’s tonal response curve. ISO 14524 measures it by photographing a chart of gray patches of known density under even, controlled lighting, then plotting each patch’s digital value against its log luminance.
Why measure it
- See how the camera renders tones: its gamma and contrast, and where highlights and shadows clip.
- Linearize image data for other measurements, such as SFR in ISO 12233.
- Relate noise to the scene, as in ISO 15739, and determine ISO speed, as in ISO 12232.
- Compare cameras, settings and firmware: changes in image processing show up in the tone curve.
Test Targets
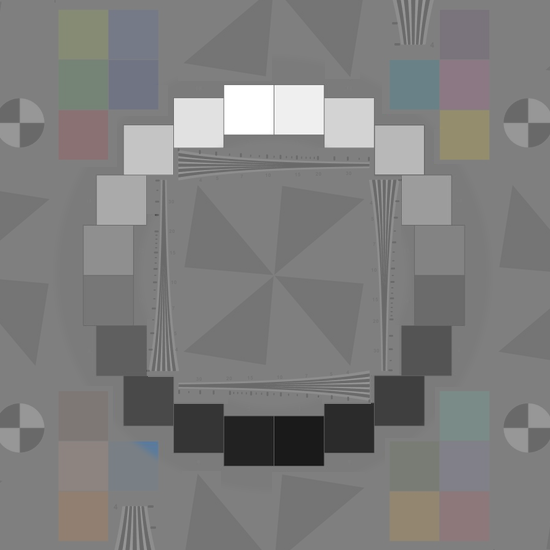
20-patch ISO 14524 radial targets are included as part of the ISO 12233 eSFR test chart. These are available for purchase in inkjet, film and photographic substrates.
A simple 12-patch target is available printed on semigloss paper.
OECF Chart Designs
ISO 14524 charts come in 12, 16 and 20 patch versions, with the gray patches set in a ring. More patches sample the tonal response curve more finely. Our targets use the 20 patch version, which we prefer; it is the ring in the eSFR ISO chart.
High dynamic range (HDR) cameras need a larger number of patches spanning a wider range of densities than these charts provide, such as our 36-patch dynamic range target. See Dynamic Range Test Charts.
Test Methods
For automatic detection, use our flagship eSFR ISO module with ISO 12233 test targets that have embedded ISO 14524 tonal patches.
For only testing OECF and noise, use the interactive Color/Tone module. For advanced batch processing, use Color/Tone Auto.
ISO 14524 Tonal Patch Radial Symmetry
ISO 14524 targets arrange their gray patches in a ring around the center of the image, rather than in a row like a linear step chart. Every patch then sits at about the same distance from the center, which matters because a lens does not image the field evenly.
- Lens falloff (vignetting) darkens the image toward its edges. On a linear step chart the end patches lie farther from the center than the middle ones, so falloff is mixed into the measured tonal response. On a ring, every patch is dimmed by about the same amount, and the curve’s shape reflects the camera, not the lens.
- Color shading, a tint that changes toward the edges of the field, also varies with distance from the center, so it affects the gray patches of a ring alike and they stay comparable.
- The ring is compact and leaves room for other patterns: in the ISO 12233 (eSFR ISO) chart it surrounds the slanted edges, so the OECF, gamma for linearizing the edges, SFR, noise and color all come from one image.
A linear step chart remains convenient for a quick check with Color/Tone analysis. Neither kind of reflective chart has the density range for dynamic range measurements, where a dynamic range test target is needed.
Linearization
Image sensors respond linearly to light, but most image files are not linear. Camera processing applies gamma encoding (an encoding gamma of about 0.45 for sRGB files), and often a shoulder that rolls off the highlights. Linearization reverses that encoding so that pixel levels are again proportional to luminance. Tonal Response and Gamma explains this in depth.
Converting to linear data
The OECF relates digital values to log luminance, so it gives the conversion directly. Look up each pixel level on the measured curve to find its log luminance, then take the antilog (10 raised to that value) to get a number proportional to luminance. Where the encoding is a simple gamma, this is the same as raising normalized pixel levels to the power 1/gamma: about 2.2 for an sRGB file with an encoding gamma of 0.45.
Why linearization is important
- MTF (SFR) calculations assume a linear signal, so gamma-encoded images must be linearized before sharpness is measured. A good estimate of gamma is enough, and the 4:1 edge contrast of ISO 12233:2017 charts makes MTF less sensitive to it.
- Color correction matrices and ISO 18844 flare measurements are also calculated on linear data.
- The right gamma depends on the image: about 0.45 to 0.6 for color space files, but about 1.0 for raw files. Measuring it from the OECF is more reliable than assuming a default.
- Where the tonal response curve flattens, in a shoulder or at clipping, it cannot be inverted accurately. Clipped edges exaggerate MTF, so keep test patterns within the curve’s working range.
Companding and decompanding
High dynamic range sensors often capture more bits than their interface carries, so they compand: they compress the linear signal into fewer bits, for example 16-bit data into 12 bits on the AR0331. The companding curve is piecewise linear, with knee points: dark levels keep their full precision while brighter levels are stored in progressively coarser steps. A companded raw image is therefore not linear, and its tonal response curve bends at each knee instead of following a straight line with a gamma of 1. ISO 14524 analysis can be used to validate if a companded image was properly linearized.
Decompanding applies the inverse curve, from the sensor manufacturer’s companding table or knee points, to restore linear raw data before analysis. In Imatest, decompanding is applied when reading raw files, from a JSON file describing the sensor’s companding. Measuring the ISO 14524 OECF afterwards is a good check: the tonal response curve of a correctly decompanded image is close to a straight line, without kinks.