


Authors: Christian Taylor and Amelia Limbocker (Imatest LLC)
Presented March 4, 2026 at the IS&T Electronic Imaging Symposium 2026, in the AVM (Autonomous Vehicles and Machines) session.
Abstract
Near-infrared (NIR) imaging is now prevalent in machine vision, automotive, and biomedical applications, but most step-chart definitions were created for visible imaging. Popular standards assume visible-band weighting and do not account for NIR-sensitive systems. This leads to charts with target densities unoptimized for NIR applications.
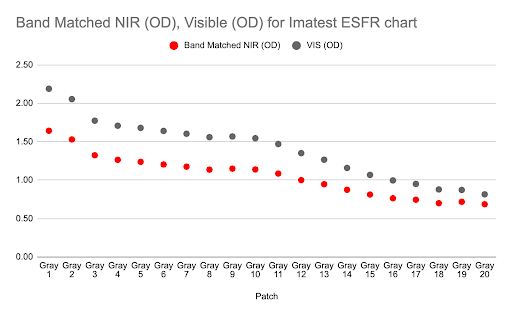
We present a methodology for designing NIR test charts whose optical densities (ODs) align with the effective bandpass of a specific camera. First, we model the ISO 5 visual density calculation and the ISO 14524 OECF method for determining density targets for a test chart from the spectra of an inkjet print. That method is modified to accept new bandpass weights to accommodate sensitivities not accounted for by ISO 5-3. Three new weights are applied, and reflectance factor density targets are calculated. The results show that target densities shift with alternative spectral weightings, motivating a different NIR chart design.