

Characterize the limits of your system response.
Our dynamic range charts are designed to verify what luminance range your camera can perform with adequate contrast and signal-to-noise ratio. When analyzed with the Imatest Color/Tone module, dynamic range chart images can show the limits of your camera’s perception.

36-Patch Dynamic Range
- 50 dB, 100 dB or 150 dB of Dynamic Range
- Gray background for proper auto-exposure
- Slanted edge and color patch features
- Constructed from two and three layers of photographic film
- Characterize real-world system performance

InfoDR Test Chart
- Information-based dynamic range
- Combines noise with sharpness (SFR) information
- Estimates usable image information across exposure levels
- Reference file supplied with chart purchase

Contrast Resolution
- Measure distinguishability of low contrast objects within larger fields with Imatest 5.0
- 100 dB of Dynamic Range
- Grey background for proper auto-exposure
- Slanted edge features

DarkWorld Mask
- Goes over 36-patch test charts
- Idealized dark scene with minimum flare
- May be difficult for autoexposure

XYLA
- Dark background with linear steps
- 84 dB, 120 dB or 150 dB of Dynamic Range
- Includes self-contained light source
- Difficult to detect, affected by light falloff

ISO 21550
- Optical density 4 to 6
- Supports the ISO standard
- Good for macro systems
- Low cost
Dynamic Range Test Charts
-

Imatest 36-Patch Dynamic Range Test Charts
Price range: $600.00 through $2,260.00Select options This product has multiple variants. The options may be chosen on the product page -

Imatest VisNIR Dynamic Range Chart
Price range: $1,940.00 through $2,260.00Select options This product has multiple variants. The options may be chosen on the product page -

Imatest Contrast Resolution Chart
Price range: $1,550.00 through $1,890.00Select options This product has multiple variants. The options may be chosen on the product page -

Imatest InfoDR Chart
Price range: $1,300.00 through $1,450.00Select options This product has multiple variants. The options may be chosen on the product page -

Simplified ISO-15739 digital camera noise test chart
$310.00Add to cart -

Tiffen 4 x 4″ Neutral Density 1.0 Filter
$450.00Add to cart -

Imatest DarkWorld Mask & Frame for HDR targets
Price range: $150.00 through $170.00View products -
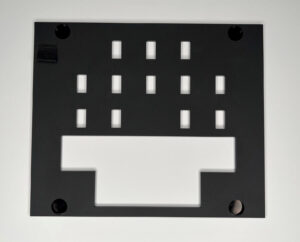
Imatest Veiling Glare Mask and Frame for Contrast Resolution
Price range: $150.00 through $190.00View products -

Xyla Dynamic Range Test Chart
Price range: $7,250.00 through $11,450.00Select options This product has multiple variants. The options may be chosen on the product page -

Frame for 8″ x 10″ film charts
$150.00Add to cart -

ISO-21550 Dynamic Range Film Target
$250.00Add to cart