|
This page is obsolete! It has been replaced by Color/Tone Test Chart Reference & Guide. Stepchart is no longer recommended. Use Color/tone Interactive or Auto instead. |
Additional charts, including circles arranged on a square
Special (multi-row) Charts (a part of Color/Tone, available with Imatest™ Master) analyzes
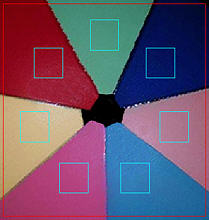
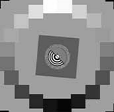
— patterns consisting of 7 to 12 squares uniformly distributed around a circle, including portions of monochrome or color “pie” charts similar to the one shown on the left. These charts are useful for microscopy and for systems with significant light falloff (vignetting).
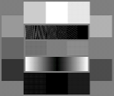
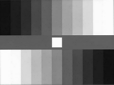
— any of the monochrome test charts shown below, which can also be analyzed by Stepchart. They are described in detail in Stepchart: Special and ISO charts.
 QA-61 ISO-16067-1 Scanner |
 QA-62 |
ST-51 |
 ST-52 ISO-14524 12-patch OECF target |
 ISO-15739 Noise target |
 20-patch OECF targets |
ITE Grayscale |
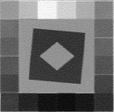
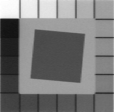
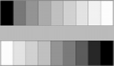
These illustrations show how the monochrome charts should be cropped.
Instructions
Photograph or scan the chart, taking care to avoid glare, which can be problematic with charts with semigloss and glossy surfaces, especially with wide angle lenses. A recommended lighting setup is described here and in the page on the Imatest testing lab.
To start Special Charts, run Imatest and click the button on the left side of the Imatest window. The Color/Tone window will appear with brief instructions.
Select Special Charts from the popup menu in the middle-right of the Color/Tone window. The contents of this window is highlighted (brown text, yellow background) when Color/Tone starts.
A standard Windows file selection dialog appears, labelled Special Charts image file. Select an image file to open. You may, if you wish, press View (![]() ), Thumbnails to see thumbnails in the dialog box (illustrated on the right). This is sometimes helpful for locating the file to open.
), Thumbnails to see thumbnails in the dialog box (illustrated on the right). This is sometimes helpful for locating the file to open.
After the file is selected the Special Chart selection box, shown below, appears. A thumbnail of the input image is shown on the right.
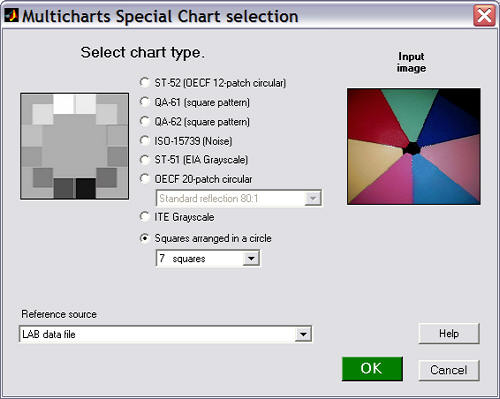
Select the chart type and the reference source. If an incorrect reference source is entered, it can be changed later in the Color/Tone window. If you select Squares arranged in a circle, choose the number of squares in the pattern (7-12). If you choose OECF 20-patch circular, choose one of the following in the box below the OECF 20-patch radio button.
|
OECF 20-patch circular charts (more detail here)
|
|
| TE 241 | Available from Image Engineering/Esser Test Charts. Transmissive chart. 12600:1 contrast ratio. 0 ≤ density ≤ 4.1 |
| Low contrast 20:1 | From ISO/DIS 14524, Table A3. 0.1 ≤ density ≤ 1.4 |
| Standard reflection 80:1 | From ISO/DIS 14524, Table A3. 0.1 ≤ density ≤ 2.0 |
| Normal contrast 160:1 | From ISO/DIS 14524, Table A3. 0.1 ≤ density ≤ 2.3 |
| High contrast 1000:1 | From ISO/DIS 14524, Table A3. 0.1 ≤ density ≤ 3.1 |
If you choose ITE Grayscale, select either ITE Grayscale I: gamma = 0.45 or ITE Grayscale II: gamma = 1.0 in the box just above the ITE Grayscale radio button.
The reference source can be one of the following.
| Default reference values (if applicable) | Available for the monochrome charts: ST-52, QA-61, QA=62, ISO-15739, EIA Grayscale. Not for Squares arranged in a circle. |
| Read from a density file | For monochrome charts only. One value per line. a* = b* = 0. You will need to enter the file name. |
| Read from a L*a*b* file | Three values per line (L*, a*, b*), separated by commas (CSV format). ” “ |
| Read from a 5000K xyY data file | Three values per line (x, y, Y), separated by commas (CSV format). ” “ |
| Read from a 6500K xyY data file | Three values per line (x, y, Y), separated by commas (CSV format). ” “ |
| Last file: (file name if applicable) | The previous file name for this type of chart, if applicable. |
|
Here is an example of an L*a*b* file in CSV (comma-separated variable) format. The format is the same for xyY files. Spaces are for visual clarity (readability) only. The numbering order of the patches is shown below. |
55.261, -38.342,31.37
28.778, 14.179, -50.297 65.711, 18.13, 17.81 51.038, -28.631,-28.638 51.935, 49.986, -14.574 81.733, 4.039, 79.819 42.101, 53.378, 28.19 |
Coarse crop box (greatly reduced)
If a reference file is called for, a dialog box for entering the file name will appear after the crop boxes. Details of required file contents are found in Numbering and orientation of the patches, below.
If the image is the same size and type as the previous image analyzed by Color/Tone, you’ll be asked if you want to use the same ROI (region of interest).
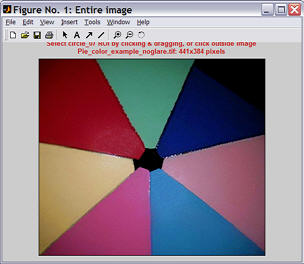
If the image is a different size or type, or if you answer No, a coarse crop box appears, shown greatly reduced on the right. Select a portion of the image, or click outside the image to select the entire image. Recommended cropping for the monochrome charts is shown near the top of the page. The initial crop doesn’t have to be precise: you’ll have a chance to refine the crop in the fine crop box. The crop box can be enlarged or maximized to make the selection easier.
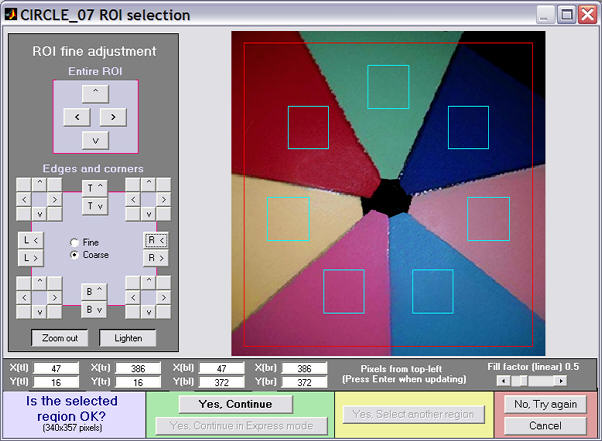
After you have made the rough crop, the fine adjustment box appears. The original crop is displayed as the red rectangle. The patch regions to be selected are the small cyan squares or rectangles. This dialog box can be enlarged or maximized to facilitate the adjustment. It offers numerous options.
Fine crop adjustment
The original crop is displayed as the red rectangle. The patch regions to be selected are the small cyan squares or rectangles. This dialog box can be enlarged or maximized to facilitate the adjustment. Numerous options are available.Its numerous options are described in the Color/Tone instructions. Fill factor (linear) allows the size of the squares to be adjusted.
- The entire ROI can be moved ( , upper-left).
- The top, bottom, left, or right sides can be moved ( , middle-left).
- Corners can be moved individually (any of the 8 buttons in each of the four corners, middle-left).
- Pixel values for the four corners can be entered (X(tl), Y(br), …, where tl = top-left, br = bottom right, etc.). The origin is the upper-left. Be sure to press the key after entering a value.
- You can choose between Fine and Coarse movement (1 or 5 pixels of movement per click).
- The display can be zoomed out or in.
- The display can be lightened to view the dark regions more clearly.
- The Fill factor (linear) slider in the gray area above the button specifies the relative size of the squares. Its default value is 0.5. Smaller values can be used where lens distortion or pattern orientation makes alignment difficult.
When you have completed the fine adjustment, click one of the buttons on the bottom of the window. If you click , an additional dialog box may appear. You may, for example, be asked for the required reference file. Some of the entries in the input dialog boxes, like Reference file, can be changed later. If you click , it will go directly to the Color/Tone window, using saved values.
Numbering and orientation of the patches
The table below shows the patch order and orientation of supported charts.
|
Orientation and numbering of patches for squares arranged in a circle
|
||
|
1 7 patches |
8 1
7 2 6 3 5 4 8 patches |
1
9 2 8 3 7 4 6 5 9 patches |
|
1
10 2 9 3 8 4 7 5 6 10 patches |
1
11 2 10 3 9 4 8 5 7 6 11 patches |
12 1
11 2 10 3 9 4 8 5 7 6 12 patches |
Pattern orientation rule: For n patches,
If n is odd or even and not a multiple of 4 (n = 7, 9, 10, or 11), patch 1 is centered at the top of the circle.
if n is a multiple of 4 (8, 12), patches 1 and n are side-by-side at the top, with patch 1 to the right of n.
Patches are numbered clockwise, starting at the top or just to the right of the top (for n a multiple of 4).
Patches for the monochrome charts below are numbered individually, following published descriptions or standards. There is no general rule.
|
Orientation and numbering of patches for monochrome targets
|
|||
|
1 2 3 4 5 6
20 7 19 8 18 9 17 10 16 15 14 13 12 11 |
1 2 3 4 5 6
20 7 19 8 18 9 17 10 16 15 14 13 12 11 |
1 2 3 4 5 6 7 8 9
10 11 12 13 14 15 16 17 18 |
1 2
3 4 5 6 7 8 9 10 11 12 |
|
QA-61 ISO-
16067-1 Scanner |
QA-62
|
ST-51
EIA Grayscale |
ST-52 ISO-14524
12-patch OECF target |
|
3 1 2
5 4 7 6 9 8 11 12 10 |
3 1 2 4
5 6 7 8 9 10 11 12 13 14 15 16 17 19 20 18 |
1 2 3 4 5 6 7 8 9 10 11
12 13 14 15 16 17 18 19 20 21 22 |
|
|
ISO-15739
Noise target |
20-patch OECF targets
|
ITE Grayscale
|
|
Use these orders when creating reference files (density, L*a*b*, or xyY). These charts are described in more detail in Stepchart: Special and ISO charts.
|
This page is obsolete! It has been replaced by Color/Tone Test Chart Reference & Guide. Stepchart is no longer recommended. Use Color/tone Interactive or Auto instead. |
Examples of results
All Color/Tone results are available in Special Charts, though not all results are usable. For example, the Black & White density produces jumbled plots for colored “pie” charts and many of the color displays display little useful information for monochrome charts.
The original chart is simulated (synthecially recreated) forall patterns except Squares arranged in a circle.
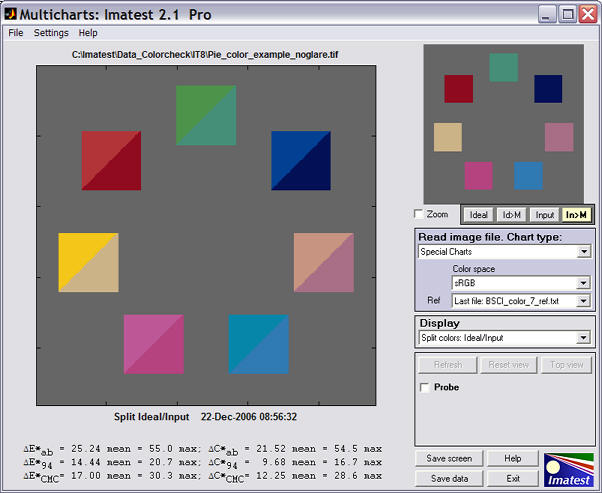
For squared arranged in a circle the selected squares are displayed on a gray background, even though the original is the “pie” chart illustrated above. Apart from that, Special charts displays are similar to Color/Tone displays.
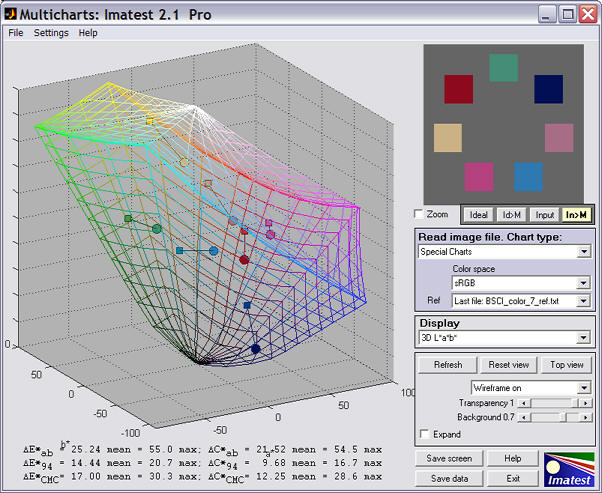
The 3D L*a*b* plot is typical. It can be rotated to facilitate visualization of color shifts.
