View Release Notes
For beginners: We recommend these web pages for getting started:
Introduction to the Imatest Main Window
Image Quality Factors – Using Imatest – Getting started – Imatest Updates and Features
VIDEOS – Online training – Consulting – News
| Offline documentation | Download the website for offline view (with a web browser) |
| Image Quality |
IQ factors (KPIs) measured by Imatest, with links to detailed descriptions and instructions. |
| Sharpness | Introductions to sharpness and sharpening; comparisons of different charts; chart quality limitations & how to overcome them |
| Other IQ factors | Noise, SNR, Temporal noise, Dynamic Range (DR), Chromatic Aberrations, Distortion, Veiling glare, Shannon information capacity & Image information metrics, etc. |
| Getting started | Why Imatest?, Test charts, Lighting, Image capture technique, Setting up your lab, Using Imatest software |
| Start using Imatest software | Installation, Using Imatest, Image file formats & devices, Activation/Deactivation |
| General Instructions | Special standards, Supported devices, Test manager, Raw files, Test lab, INI files, Pass/Fail Monitor |
| Acquiring images | Files, formats, devices, and utilities for acquiring images |
| Knowledge Base highlights | Links to articles for troubleshooting, activation, and general advice on operation. |
| Troubleshooting | What to do when Imatest doesn’t work as expected |
| Simatest Camera/ISP Simulator | Simatest – Image Signal Processing / Camera Simulator – examples – Image sensor noise |
| IQ Utilities | SSIM, Image Statistics, Radial geometry |
| Slanted-Edge sharpness modules | SFR (manual ROIs), SFRplus, eSFR ISO, SFRreg, Checkerboard (auto ROI detection) The four auto-detection slanted-edge sharpness module are compared here. |
| Other sharpness modules | Log F-Contrast, Star, Random/Dead Leaves/Spilled coins, Wedge, Sharpness utilities & postprocessors |
| Sharpness utilities & postprocessors | MTF Compare, Image stabilization, Batchview, Find ShGarpest Files |
| Tone, Color, Noise & Dynamic Range modules | Color/Tone (Interactive & Auto), CCM (Color Correction Matrix), CDP, Contrast Resolution, Colorcheck, Stepchart, Measuring patches, Gamutvision for evaluating ICC color profiles and gamut mapping. |
| Spatial & Flat field modules | Flatfield, Flatfield Interactive, Distortion, Dot pattern, Testing displays |
| Miscellaneous modules and utilities | Lighting Control, Arbitrary charts, Device Manager, Auto White Balance/Exposure/Focus (AWB, AE, AF), Printing & displaying test charts, Rename Files, Educational Apps, Database |
| Industrial Testing edition | Modules, Instructions for various interfaces (EXE, C, C++, Python, .NET), INI file reference, Pass/Fail, Operator Console, Speedup |
| Appendix | FAQ, Versions, Troubleshooting, Change Log, INI file reference, License |
Image Quality
General — Introduction to Image Quality Factors (Key Performance Indicators – KPIs)
Image quality factors – Overview and Imatest measurements Recommended for getting started.
Introduction – Summary table – Image quality factors – Sharpness – Texture – Noise – Information capacity and metrics – Tonal response – Dynamic range – Color accuracy – Distortion – Uniformity – Blemishes – Exposure accuracy/ISO sensitivity – Lateral chromatic aberration – Stray light (flare) – Veiling glare – Color moiré – Software artifacts – Data compression – Printer quality factors
Sharpness
 plot from a slanted edge (SFR or SFRplus)") Sharpness – What is it and how is it measured?
Sharpness – What is it and how is it measured?
Introduction – MTF – MTF equation – Spatial frequency units – Summary metrics– MTF measurement matrix – comparing measurement techniques – Slanted-Edge measurements – Why a slanted edge? – Clipping – Noise reduction – Interpreting MTF50 – AutoFocus (AF) Speed – Calculation details – Slanted-edge algorithm – Imatest vs. ISO calculation – Links
Sharpening – and Standardized Sharpening for comparing cameras
Introduction – Examples – Oversharpening/Undersharpening – Examples – Unsharp masking (USM) – Links – Standardized sharpening
Comparing sharpness in different cameras – The application: “Image-centric” (for pictorial images) or “object-centric” (for medical, machine vision, etc.) strongly affects how images are compared.
Validating the Imatest slanted-edge calculation
Slanted-edge versus Siemens Star – A comparison of sensitivity to signal processing
Introduction – Images – Raw results – Slanted-edge results – Sinusoidal (Log F-Contrast and Siemens star) results – Extreme sharpening – Summary – Conclusions
Slanted-edge versus Siemens Star, Part 2 – Results for four additional cameras
Slanted edge vs. Siemens star MTF calculations: 2024 white paper
Slanted-edge measurement consistency and repeatability – comparing different ISO speeds and ROI sizes. Incomplete, but still useful.
Nyquist frequency, aliasing, and Color Moire – introducing a color aliasing metric derived from wedges.
Diffraction, optimum aperture, and defocus – Lens aberrations – Diffraction – Pixel response limits and Q – Defocus
Display (Monitor) Sharpness – Display the chart – Capture the image – Analyze – Results – TV Lines – Monitor gamma – CMS systems
Camera Monitor Systems (CMS) – for automotive mirror replacement systems and some endoscopes
LSF (Line Spread Function) correction factor for slanted-edge MTF measurements
Compensating camera MTF measurements for chart and sensor MTF
Introduction – Calculation – MTF compensation files – Applying the compensation – Sensor MTF compensation for measuring lens MTF – Chart MTF measurements
Other Image Quality Factors
Temporal Noise – comparing the two-image and multi-image measurements
| Information capacity news, video, and links are on Solutions – Image Information Metrics. |
|
The EI2024 paper, Image information metrics from slanted edges, is an excellent introduction to the new metrics. Two 2023-2024 white papers contain the latest information capacity measurements and results, including Edge SNRi and filter design. Introduction to Image Information Metrics is the most concise introduction to image information capacity and related metrics, with minimal equations and technical detail. Image Information Metrics in Imatest is an intermediate introduction to image information capacity and related metrics. Image Information Metrics and Applications: Reference (41 pages) has all the equations and technical detail. It’s the reference for the shorter documents. |
| The Siemens star method, introduced in 2020, is slower but better for observing the effects of image processing artifacts (demosaicing, data compression, etc.). |
Getting Started with Image Quality Testing
Why Imatest? | Test Charts | Lighting | Image Capture Technique | Setting up Your Lab | Using Imatest Software
Sample images for several modules from Github
Start Using Imatest Software
| Please note: Each Imatest license can be activated on only one computer at a time, but the activation can be easily moved between computers, especially if they’re online. You can install Imatest– and keep it installed– on as many computers as you like (Macintosh as well as Windows– your license works for both; you never have to uninstall it). To move the activation to another computer, you’ll need to deactivate it on the old computer then activate it on the new one, following the instructions above. You may do this as often as you like. |
Imatest Instructions – general
Saved settings – Imatest-v2.ini and INI files for use with Imatest IT
Acquiring images – Files, formats, devices, and utilities
Supported image acquisition hardware for Imatest Image Master
Using Direct Image Acquisition – Acquiring images directly from devices
Sony AYA Interface for direct image acquisition
The Imatest Functional Interface – A simplified interface for running tests with consistent settings
Knowledge Base highlights – Links to articles for troubleshooting, activation, and general advice on operation.
Simatest ISP/Camera simulator
Simatest examples – Examples of using Simatest to measure image sensor noise and model camera and ISP performance
Image quality utilities degrade, enhance, examine, or analyze any image (not just test charts)
Slanted-Edge sharpness modules
SFR – Basic analysis of slanted-edges (manual ROI selection)
: SFRplus chart run with SFR") Using SFR Part 1 – Setting up and photographing SFR targets
Using SFR Part 1 – Setting up and photographing SFR targetsSFR results: Auto Focus (AF) plot
| Feature | SFRplus |
eSFR ISO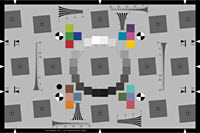 |
SFRreg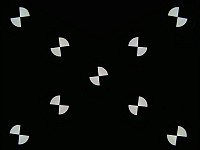 |
Checkerboard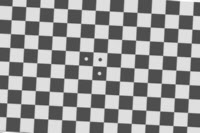 |
| Sharpness map detail | High | Medium | Depends on arrangement | High |
| ISO-standard chart design | – | ♦ | – | – |
| Color analysis | ♦ | ♦ | (only for SFRreg center chart) | – |
| Tonal response (OECF) | ♦ | ♦ | (only for SFRreg center chart) | – |
| Noise analysis | Limited | ♦ | Limited | Limited |
| Distortion | ♦ Good | Limited | – | ♦ Best |
| Geometry (rotation, FoV, keystone, etc.) |
♦ | ♦ | – | ♦ |
| Features and recommended uses |
Imatest’s original automatically-detected chart, in use since 2009. Robust and versatile. Some white space recommended above and below top and bottom bars. More spatial and distortion detail than eSFR ISO. |
ISO-standard chart design. Includes wedge analysis and (optional) color patches. Supports detailed noise analysis. |
Several individual charts are typically placed around the image field. For |
Relatively insensitive to framing: can zoom in or out as long as distance is large enough so chart quality is not an issue and there are detectable corners. Well-suited for through-focus measurements. Very accurate distortion measurements. |
♦ denotes strong support; – denotes no support.
SFRplus – Automated analysis of slanted-edges
Using SFRplus Part 1 – The SFRplus chart: features and how to photograph it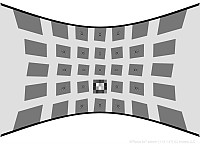 Pre-distorted and special charts for Fisheye Lenses – with many applications such as automotive rear view cameras
Includes SFRplus, eSFR ISO, and SFRreg charts. Previewing pre-distortion
eSFR ISO – Automated analysis of the ISO 12233:2014 Edge SFR chart
SFRreg – Automated analysis of registration mark patterns
Test at infinity focus with Long Range projection systems
Test imaging systems with ultrawide fisheye lenses (>180 degrees)
Test at very long camera-to-chart distances
Test at variable distances for Depth of Field.
Checkerboard – Automated analysis of checkerboard patterns
Other (Rescharts) sharpness modules – Log F-Contrast, Star, Random, Wedge
 Introduction – Getting started – The Rescharts window – Rescharts modules – Slanted-edge SFR – SFRplus – Log frequency (simple) – Log frequency-contrast – Star – Wedge – Random/Dead Leaves – Focus Score
 chart") Random/Dead Leaves – Scale-invariant test charts (including Imatest Spilled Coins)
Random/Dead Leaves – Scale-invariant test charts (including Imatest Spilled Coins)for measuring texture sharpness
Sharpness utilities & postprocessors
Longitudinal (Axial) Chromatic Aberration, Depth of Field, and lens focal length.
and comparing sharpness of different images
 Introduction – Operation – Metrics – Results
Tone, color, and spatial modules
Tone, Color, Noise, and Dynamic Range

Black point compensation demystified – Round trips for evaluating printer profile quality

Spatial and Uniformity (Flat field) modules

Miscellaneous modules and utilities
Imatest IT – Industrial Testing (non-GUI)
Appendix
Index of the Table of Contents
Image quality — Sharpness — Other IQ factors — IQ Utilities — Getting started — Imatest Instructions – general —
Troubleshooting — Knowledge Base highlights — Slanted-Edge sharpness modules — Other sharpness modules —
Tone, Color, Noise & Dynamic Range modules — Spatial & Uniformity modules —
Miscellaneous modules and utilities — Industrial Testing edition — Appendix