Compare MTFs of individual edge regions in different cameras and lenses
Introduction to MTF Compare
MTF Compare (not included in Imatest Studio), is a post-processor for comparing the MTFs of different cameras, lenses, and imaging systems that have been analyzed by SFR, Rescharts Slanted-edge SFR, SFRplus, or eSFR ISO, and had results saved in CSV files. Comparisons are displayed as quotients of MTFs, i.e., transfer functions. For two imaging systems A and B, MTF Compare
- plots MTF(A)/MTF(B) or MTF(B)/MTF(A) along with MTF(A) and MTB(B) (shown as faint lines below). Details depend on the Display setting.
- Displays ratios or values of MTFnn (spatial frequencies where MTF is nn% of the low frequency value) and MTFnnP (spatial frequencies where MTF is nn% of the peak value) for nn = 70, 50, 30, 20, and 10.
| Postprocessor comparison Each lets you compare sharpness of different regions and/or images |
|
| Postprocessor to SFR, SFRplus, and eSFR ISO. Input is two CSV results files for individual regions. Lets you compare individual edges from any region of any two images (or the same image). Displays MTF for both images and transfer function (A/B) or (B/A). | |
Image Stabilization/ Sharpness Compare |
Postprocessor to SFRplus-only. Input is two or three JSON results files. Image Stabilization must be checked in the SFRplus settings window. The region selection must be the same for all the files, but files may have different sizes. Lets you compare sharpness of regions (in approximately the same location) or of the image as a while. Can compare sharpness of two image files or calculate the effectiveness of (Optical) Image Stabilization using three image files. |
| Postprocessor to SFR, SFRplus, and eSFR ISO (primarily the latter two) that lets you compare summary results for several files run as a batch and stored in a file whose name has the form root file_sfrbatch.csv. Most useful for measuring sharpness at the center, part-way, corners, and weighted mean for a range of apertures, but very versatile: it can analyze any image sequence. | |
These comparisons contain more detail than simple comparisons of MTF50 or other summary results (MTF20, etc.). As with all Imatest modules, a great many display options are available.
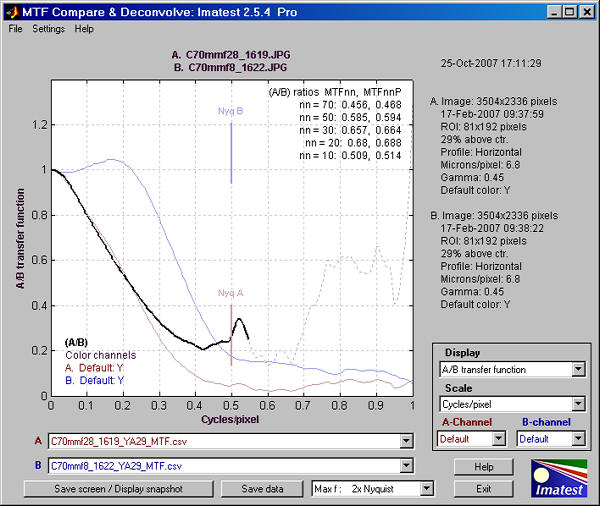
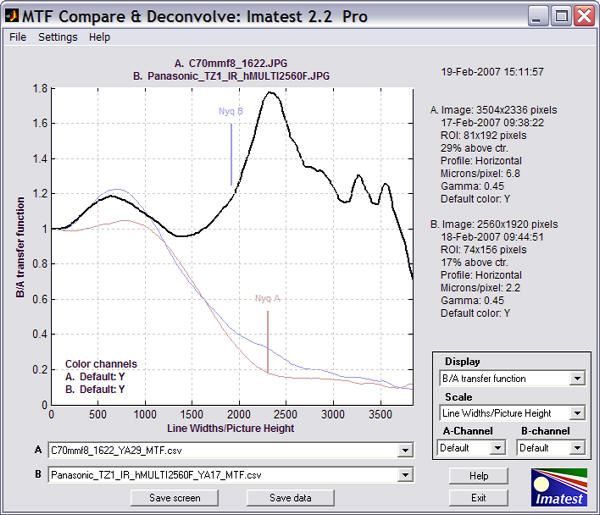
MTF comparison of Canon 24-70mm f/2.8L, 70mm, high contrast edge near center
A. f/2.8 (pale brown), B. f/8 (pale blue)
If the MTF of the sensor by itself could be measured (which is not easy thanks to diffraction and other experimental issues) MTF Compare would allow the MTF of the lens itself can be measured by dividing the system (lend+sensor) MTF by the sensor-only MTF.
This plot above compares the results of two SFR runs for the same lens and focal length at two different apertures (f/2.8 and f/8) using the same high contrast edge above the center of the Applied Image QA-77 test chart. The SFR run for f/8 (B, above) is shown greatly reduced on the right. The A/B transfer function (MTF(A)/MTF(B)) is shown as a solid bold black line —— up to the lowest frequency where the denominator (MTF(B)) drops below 0.04. Results above this frequency are unreliable due to noise; hence they are shown as a dashed thin gray line – – – –.
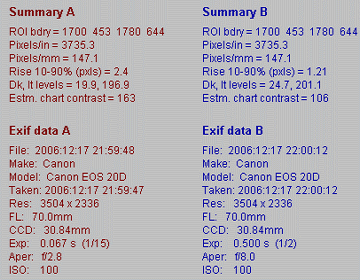
In the MTF Compare figure (above) the input file names (csv files saved from SFR runs) are shown in the A. and B. boxes below the plot. The corresponding image file names are shown above the plot. The A and B Nyquist frequencies are shown as short, faint brown and blue lines. Important input data is summarized on the right.
Since the input to MTF Compare is saved SFR output, and since no Imatest output can be saved in evaluation mode, MTF Compare is not practical for running in evaluation mode.
Instructions
Getting started
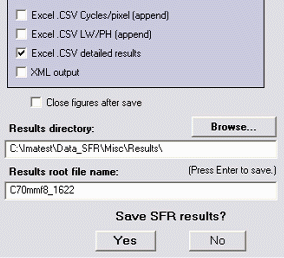
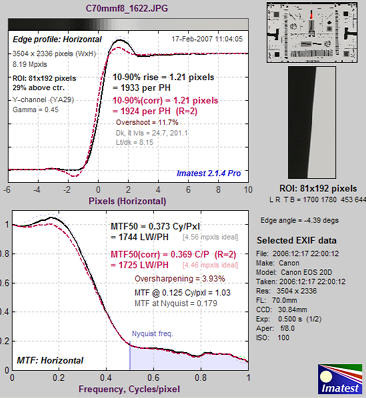
MTF Compare is a post-processor for Imatest SFR and Rescharts Slanted-edge SFR that uses SFR’s Excel-readable CSV output files. In order to compare MTFs, these CSV output files must be saved in SFR runs. To do so, make sure Excel .CSV detailed results is checked in the SFR Save dialog box, shown on the right. You may, if you wish, change the Results directory and root file name from their defaults to make them easier to identify and retrieve. Then press on the bottom.
The illustration below is similar to the one near the top of the page, except that it is based on the low-contrast edge closer to the center of the image of the QA-77 chart, which has much less in-camera sharpening than the high-contrast edge and the maximum display frequency is 0.5 cycles/pixel. The EOS-20D, like most digital cameras, has significant nonlinear signal processing, i.e., strong sharpening takes place in the vicinity of high contrast features, but little, if any, sharpening takes place in their absence— i.e., sharpening is not applied uniformly throughout the image. But even though the MTFs are much lower than the MTFs of the contrasty edge, the A/B ratio (transfer function) is comparable for spatial frequencies below 0.4 cycles/pixel. Results at higher frequencies (shown as faint dashed lines) are dominated by noise and hence are meaningless.
MTF Compare results showing (f/2.8)/(f/8) transfer function
To run MTF Compare (Imatest Master only), press in the upper right of the Imatest Main Window, just below , which is often grayed out.
CSV input files are selected by pressing the down arrows ![]() on the right of the A and B boxes on the lower left and selecting either Browse… or Recent files, which opens a box containing up to 12 recently used files. The selected files must be CSV output files generated by Imatest SFR.
on the right of the A and B boxes on the lower left and selecting either Browse… or Recent files, which opens a box containing up to 12 recently used files. The selected files must be CSV output files generated by Imatest SFR.
When both A and B contain valid data, a plot appears, using the saved Display and Scale selections.
Display options
Display controls what is displayed, i.e., the y-axis.
- A/B Transfer function MTF(A)/MTF(B) is displayed a bold solid black line —— up to the lowest frequency where the denominator (MTF(B)) drops below 0.04, and as a thin dashed gray line – – – – at higher frequencies, where noise makes results unreliable. MTF(A) is displayed as a faint brown line ——, and MTF(B) is displayed as a faint blue line ——.
-
B/A Transfer function Similar to A/B, except that MTF(B)/MTF(A) is displayed.
- A strong, B faint MTF(A) is displayed as a strong brown line —— ; MTF(B) is displayed as a faint blue line ——.
- B strong, A faint MTF(B) is displayed as a strong blue line —— ; MTF(A) is displayed as a faint brown line ——.
- Summary and EXIF data displays a summary of the results and EXIF data (available in JPEG files). A portion of this display is shown on the right.
Scale controls the scaling of the display, i.e., the x-axis.
- Cycles/pixel A maximum of 1 is always displayed.
- Line Widths/Picture Height (LW/PH) The maximum value displayed is the lower of the maximum values for A and B. Care must be used in interpreting results because sensors have widely varying heights (measured in number of pixels).
- Cycles/mm Pixel spacing (microns per pixel, pixels per mm, or pixels per inch) must be entered in the SFR input dialog box for both A and B for the cycles per distance scales to be displayed. The maximum value displayed is the lower of the maximum values for A and B. Care must be used in interpreting results because sensors have widely varying pixel spacings and heights.
- Cycles/inch
A and B-channels determine the color channel used for the analysis. The values are not stored between runs: Default is always displayed when MTF Compare starts.
- Default uses the default channel setting that was used and stored in the SFR run. This is typically the Y (Luminance) channel, but it can be any of the others.
- (corr) uses the results for the default channel with Standardized sharpening applied.
- R Red channel.
- G Green channel.
- B Blue channel.
- Y Luminance channel (not yellow). Approximately 0.3*R + 0.59*G + 0.11*B.
Maximum display frequency (located at the bottom of the window between and ) is expressed as a fraction of the Nyquist frequency. The default, 2x Nyquist (1 cycle/pixel) shows all frequencies of interest for high performance digital cameras. But Imatest is sometimesused to measure systems that have much broader or rougher transitions, hence poorer high frequency response (for example, scanned printed paper). In such cases, much of the plot would be wasted. Available settings are
- 2x Nyquist (1 cycle/pixel) [the default] shows all frequencies of interest.
- 1x Nyquist (0.50 cycles/pixel)
- 0.5x Nyquist (0.25 cycles/pixel)
- 0.2x Nyquist (0.10 cycles/pixel)
Other controls
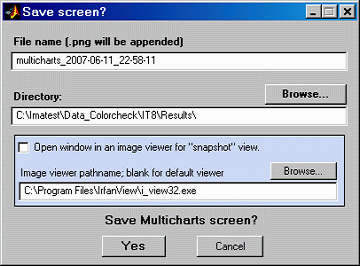
(shown on the right) saves a snapshot of the screen (the entire MTF Compare GUI window) as a PNG image file. It also allows you to immediately view the snapshot so it can be used a reference for comparing with other results.
File name and Directory at the top of the window set the location of the file to save.
When you check the Open window in an image viewer… box, the current screen will be opened either the system default viewer (if the box under Image viewer is blank) or a viewer/editor of your choice (if the box contains the path name to the viewer/editor). I recommend using Irfanview, which is fast, compact, free, and supports an amazing number of image file formats. Its normal location in English language installations is C:Program FilesIrfanViewi_view32.exe.
saves MTF Compare calculation results in an Excel-readable CSV file format.
opens this web page in a browser window.
closes MTF Compare.
The File dropdown menu has controls that allow you to set the font size (small, normal, or large) and reset the screen size and location to its original values.
The Help dropdown menu has controls that allow you to open this web page in a browser window, register Imatest, and obtain version information.
Another example
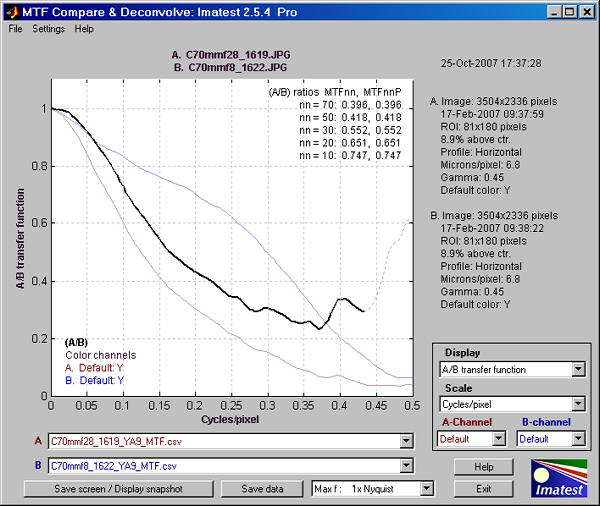
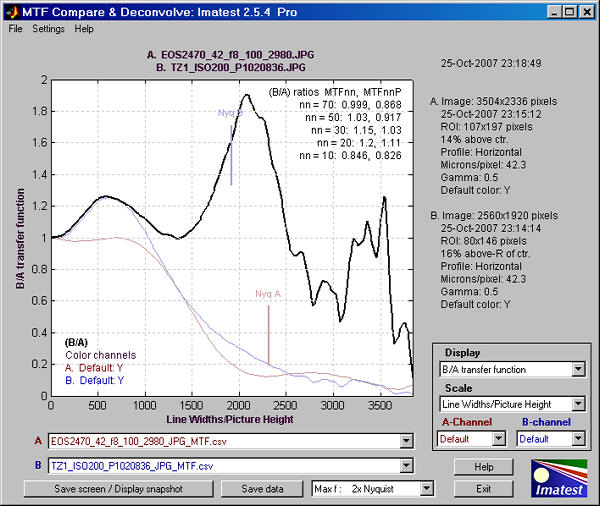
Comparison of two very different cameras: the Canon EOS-20D and Panasonic Lumix DMC-TZ1
This screen compares two very different cameras— the 8.3 megapixel Canon EOS-20D DSLR (with a high quality 24-70mm lens @ 70mm, f/8, which is about the optimum aperture) and the little 5 megapixel Panasonic Lumix DMC-TZ1 (a tiny camera that sports a 10x Leica zoom lens at f/3.6, which is about optimum for the TZ1’s small (1/2.5 inch ˜ 7 mm diagonal) sensor. The test image for the EOS-20D was taken at an outside lab; the image for the TZ1 was downloaded from the Imaging-resource.com website.
Line Widths/Picture Height was chosen for Scale because it best represents total image quality. The picture height (in pixels) is similar for the two cameras: 2336 for the EOS-20D; 1920 for the TZ1. MTF Performance of the two cameras is remarkably similar, especially around the 50% level, though the hump in the TZ1’s response indicates much stronger sharpening than the EOS-20D (DSLRs tend to use sharpening more conservatively). Indeed, a “halo” is visible near the edge. With additional sharpening the EOS-20D would clearly outperform the TZ1. If Cycles/mm or cycles/inch had been used for Scale, the results would have been harder to interpret because the sensor height is smaller for the TZ1. The pixels are also smaller: 2.2 microns vs. 6.8 microns. (Pixel size does not affect LW/PH measurements.)
Why, apart from the choice of lenses, bother with the heavy, expensive EOS-20D? Because they differ in a number of other image quality factors beyond simple MTF. The tiny 2.2 micron pixels in the TZ1 have more noise and a smaller dynamic range than the 6.8 micron pixels in the EOS-20D. As important as it is, MTF is not the only game in town.
These tests were repeated in July 2007. The main difference was that we tested a Panasonic DMC-TZ1 in our own lab under similar conditions to the Canon EOS-20D (same target and lighting and same Canon 24-70 mm f/2.8L lens, f/8, 42 mm focal length). The results are remarkably consistent.
Repeat of the test of two cameras: the Canon EOS-20D and Panasonic Lumix DMC-TZ1:
different cameras measured at different locations
