Although Imatest is primarily orientated toward testing cameras, it includes several tests for monitors (displays). It can measure the sharpness of all sorts of displays, including flat panels, projectors, heads up displays (HUDs), virtual & augmented reality head-mounted displays (HMDs) .
It can also measure display defects, as described in Testing display defects with Imatest Blemish Detect, as well as the sharpness of Camera Monitor Systems (CMS).
This post describes how to measure monitor sharpness. It applies to a large variety of displays and monitors. The technique is similar to CMS measurements, but there are a few differences.
| Please note that the SFR smoothing algorithm was improved in Imatest 2020.1. Results from earlier versions may be less reliable. |
Display the chart – Capture the image – Analyze the image – Results – TV Lines
Appendix I: Monitor gamma – Appendix 2: CMS systems
1. Display a test chart pattern on your screen
We believe that the slanted-edge is the best pattern for representing a display’s visible sharpness. Slanted-edge MTF analysis is based on the widely-used and well-accepted ISO 12233 standard, which is Imatest’s primary method of measuring sharpness.
|
Vertical/horizontal vs. slanted edges in display test images
Straight vertical and horizontal edges in test images (which will be displayed parallel to the monitor pixel boundaries; found, for example, in unrotated Checkerboard images), photographed tilted, are sometimes recommended for monitor MTF measurements, but should be avoided
|
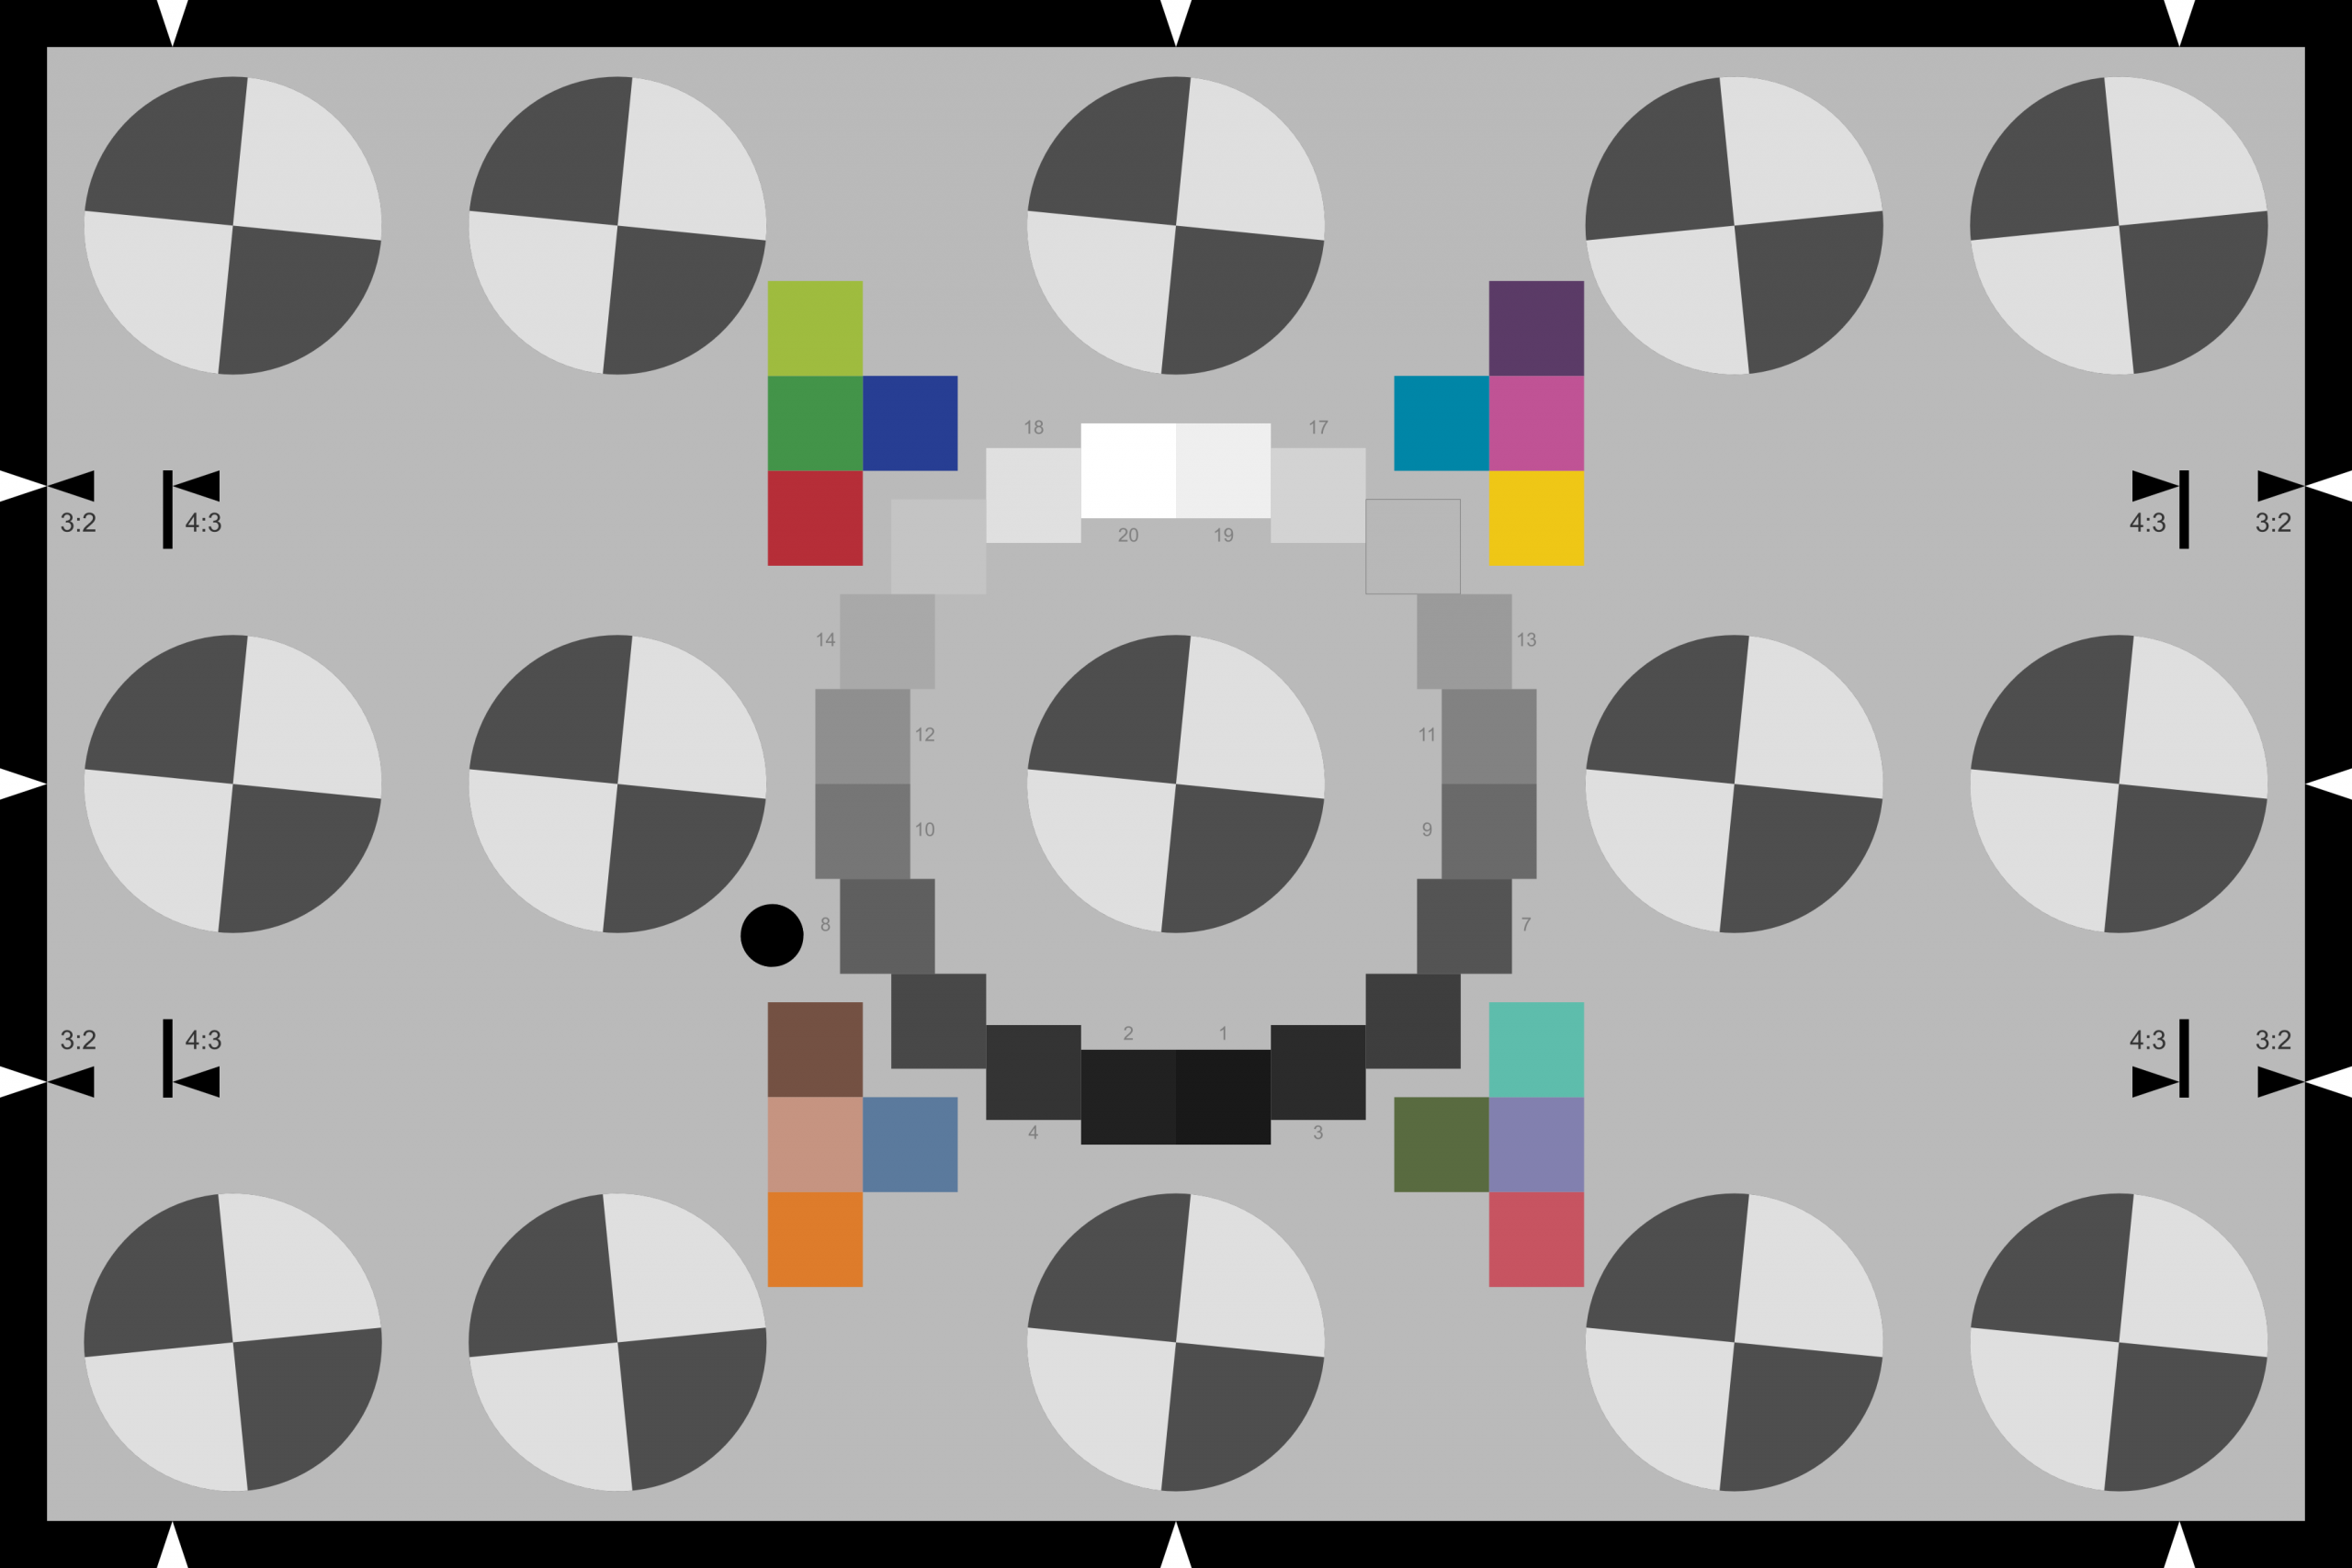
SFRreg bitmap image. Click on it to view full-sized. Right-click on it to download.
A downloadable SFRreg bitmap image with multiple slanted-edges (small file size because it’s a PNG) is shown on the right. It is derived from one of many vector graphics test patterns that can be generated by the Imatest Test Charts module and rasterized using Inkscape.
10:1 edge contrast is higher than the the standard 4:1 contrast specified by ISO 12233 for camera sharpness, but the higher contrast facilitates edge detection in the presence of the monitor pixel structure. 10:1 is a “sweet spot” for display MTF measurement; we don’t recommend higher contrasts.
This image can be displayed with an image viewer that can be set to 1:1 magnification (where one image pixel corresponds to one screen pixel). Irfanview and Fast Stone Image Viewer are two excellent free viewers. We particularly like Fast Stone, which makes it easy to display the image at 1× magnification and move the image around the screen for good framing.
You can also download a vector graphics PDF version of this chart, SFRreg_center_no_distort.pdf, which can be displayed in any PDF viewer at any magnification with maximum screen resolution.
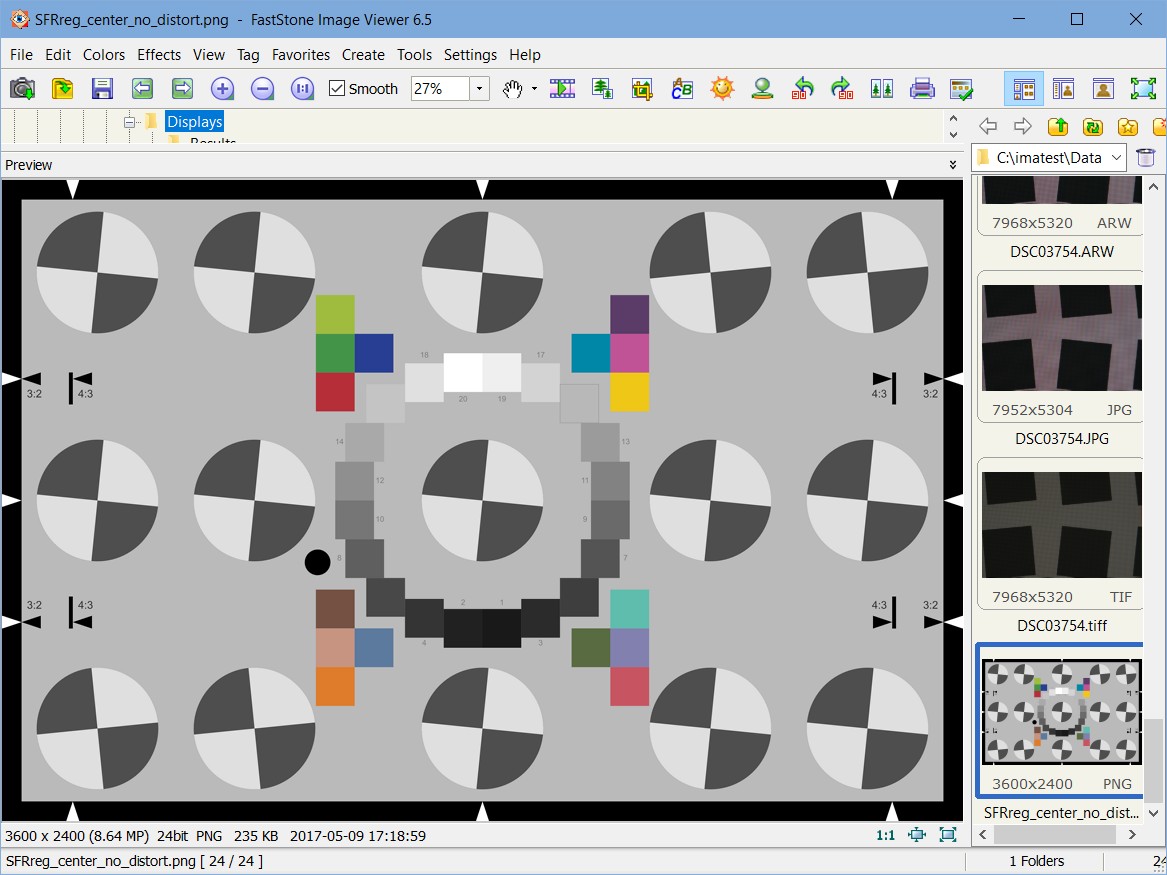 Fast Stone view of the SFRreg image
- To enlarge the image to 1:1 magnification (1 screen pixel per image pixel), press 1 (on the keyboard) or click on View, Zoom, 100% (1).
- To fill the screen with the image, double-click on it or click on View, Slide show (with Auto Play unchecked).
- Use the mouse to move the image around the screen for best framing.
Though the Imatest Screen Patterns module can be used to display a test pattern directly from Imatest, it’s not recommended because of image resizing issues on systems with multiple monitors with different scaling settings.
Takeaway — Almost any image of a slanted-edge will work as long as it’s displayed with the maximum sharpness of the monitor. 10:1 contrast is recommended.
2. Capture a high-resolution image of your display
Camera and lens — Use a high quality mirrorless or industrial camera to photograph your display or projector image. Modern Micro Four-Thirds or APS-C mirrorless cameras work very well (full frame cameras are overkill). DSLRs are not recommended because of mirror slap, and because mirrorless cameras are now so widely available. For testing monitors, use a high quality macro (close-up) lens, preferably one with magnification on the scale (or magnification easily derived from the distance setting).
The 24 megapixel Micro Four-Thirds camera and older 60mm macro lens (with manual focus and a magnification scale) described in Compensating camera MTF measurements for chart and sensor MTF — Chart MTF measurement works very well for monitor MTF testing. The specialized camera mount is not necessary.
- Mount the camera on firm support — a good tripod should be sufficient.
- Make sure the monitor gamma is reasonably close to 2.2 (the standard value, expected of any well-calibrated monitor). See Appendix.
- The ambient light should be dim, but the environment doesn’t need to be totally dark.
- Frame the image so there are at least 8 camera pixels per display pixel (by which we mean combined R, G, B pixels for color monitors). Include at least one near-vertical and near-horizontal edge. In the example image below, we used a 42 megapixel Sony A7R II camera, which has a 4.51 micron pixel pitch, with the older version of the Canon TS-E 90mm lens, set to its maximum magnification of 0.29× (at the minimum 0.5 mm focus distance). For the 2560×1440 pixel ASUS PB278 monitor, which has a pixel pitch of 0.233 mm, this resulted in an image with 15 pixels per monitor pixel. Note that this was not necessarily the optimum system, but it’s what was available during the “stay at home” order.
Overexposed! :-(
- Underexpose the image by about 1 f-stop (using the camera’s exposure compensation setting) to avoid saturating the green pixels. Be especially careful to avoid overexposing the monitor image (which almost always happens with default auto-exposure settings). In overexposed images, monitor pixels are white when they should be red, green, and blue.
- For manual focus lenses, focus very carefully, taking advantage of focus peaking or the camera’s built-in focus magnifier.
- Set the aperture to f/8 or f/11.
- Use a reasonable ISO speed, generally not over ISO 400. Noise (which gets worse at higher ISO speeds) usually has little effect on measurements, but why take a chance?
- Set the self-timer to 2 seconds to minimize chances of camera shake from pressing the shutter.
- Capture both RAW and JPEG images. Sometimes aggressive image processing in JPEGs leads to saturated pixels. We’ve had slightly better results with RAW images converted with dcraw. (The difference is not great.)
Here are some images from our tests of the ASUS PB278 monitor with the A7R II/90mm TS lens at 0.29× magnification. More details in section 3, below. These were RAW images converted with dcraw. Luminance and color saturation were considerably less than the in-camera JPEG.
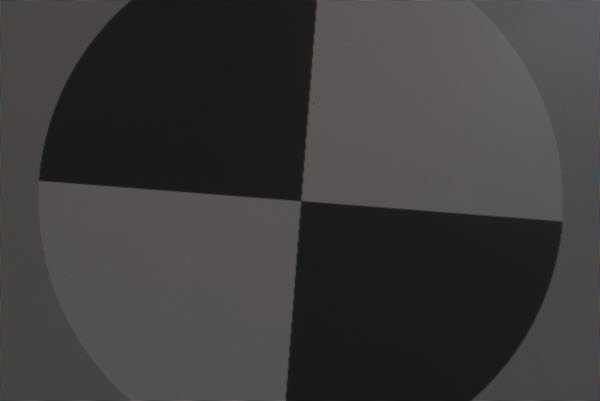
Entire image (greatly reduced). Only a small portion of the screen has been captured.
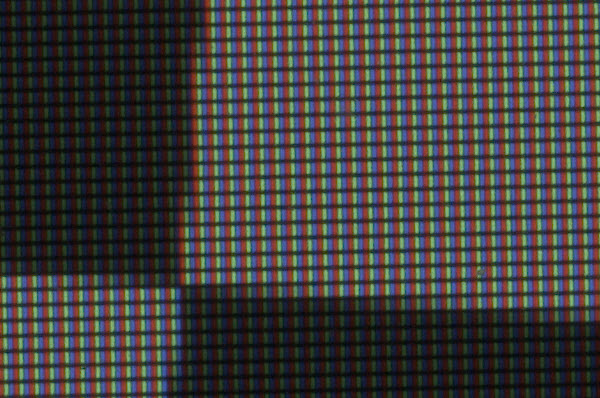
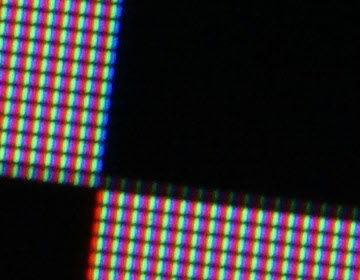
Crop of image at 1:1 magnification. Note the slanted-edges in the original image.
3. Analyze the captured image with Imatest
Open the image in Imatest SFR. Here are the recommended dcraw settings for directly reading a RAW image for a commercial camera.
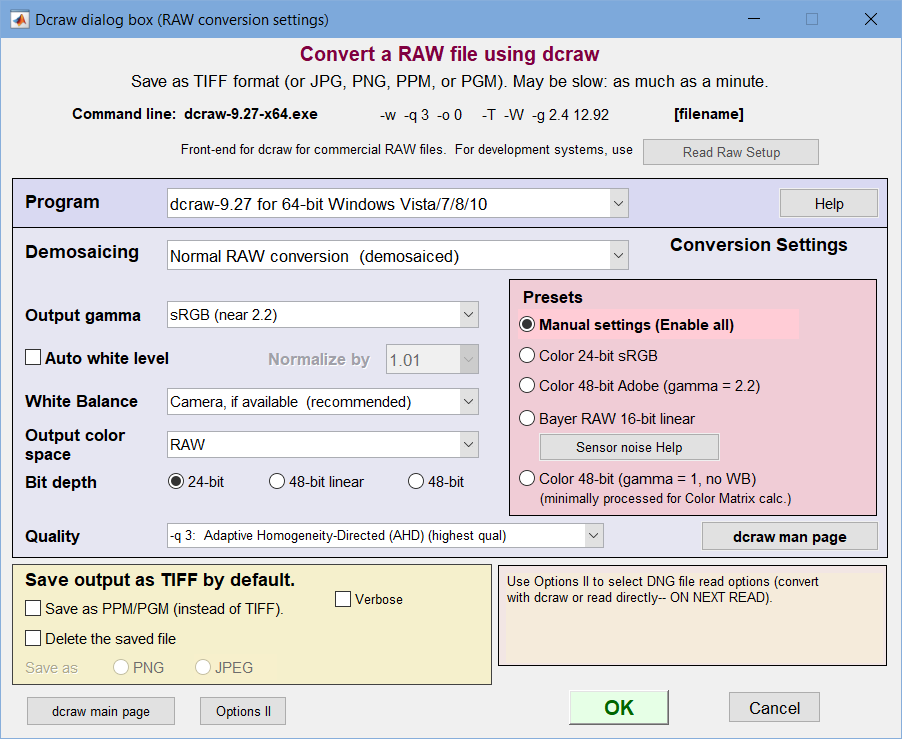 dcraw settings for monitor MTF analysis
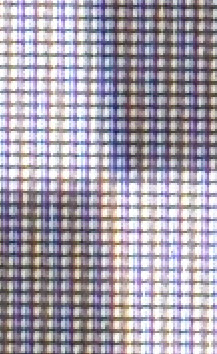
Output color space = RAW tends to keep color saturation low, leading to slightly improved results. You may want to try other settings: these are not requirements. Select two regions, one near-vertical and one near-horizontal, to analyze. Here is the ROI repeat window, showing both regions. The color bands are an aliasing effect: they’re not in the image.
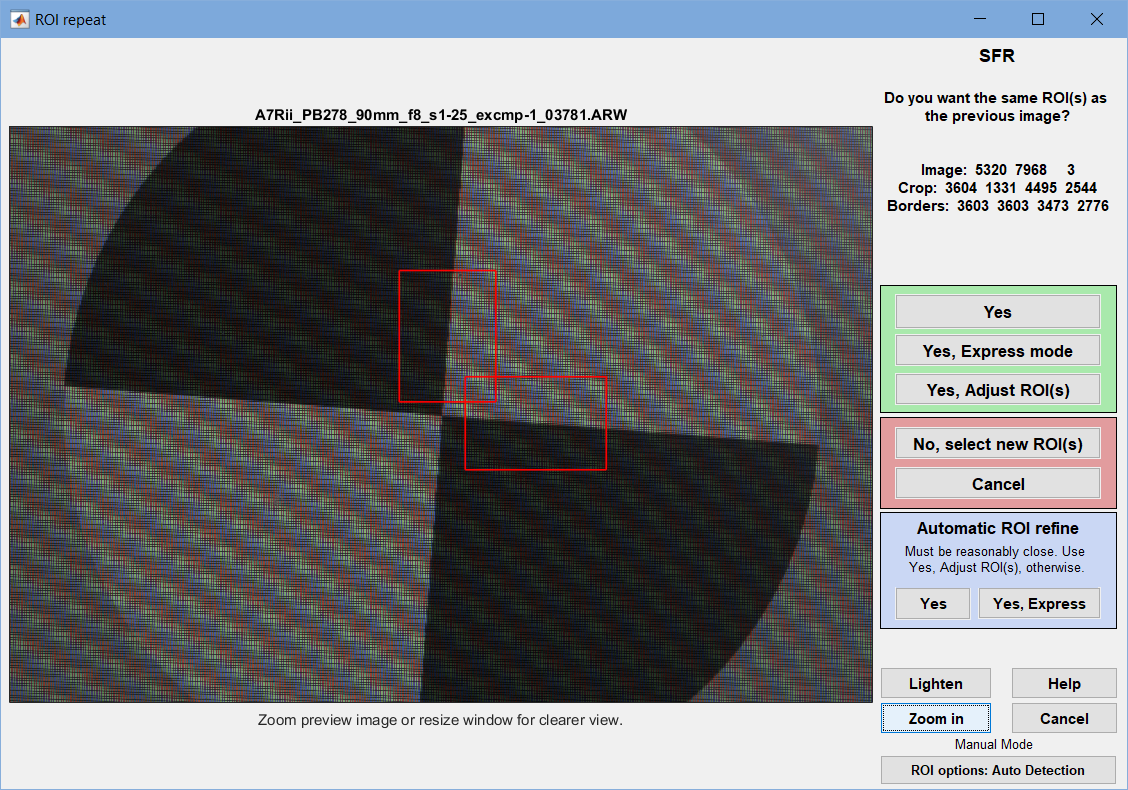 ROI repeat window, showing the two regions
The moiré pattern is an artifact of the display resolution; it’s not in the original image.
Click Yes to bring up the SFR settings window. (Yes, Express mode is fine if you don’t need to change settings.)
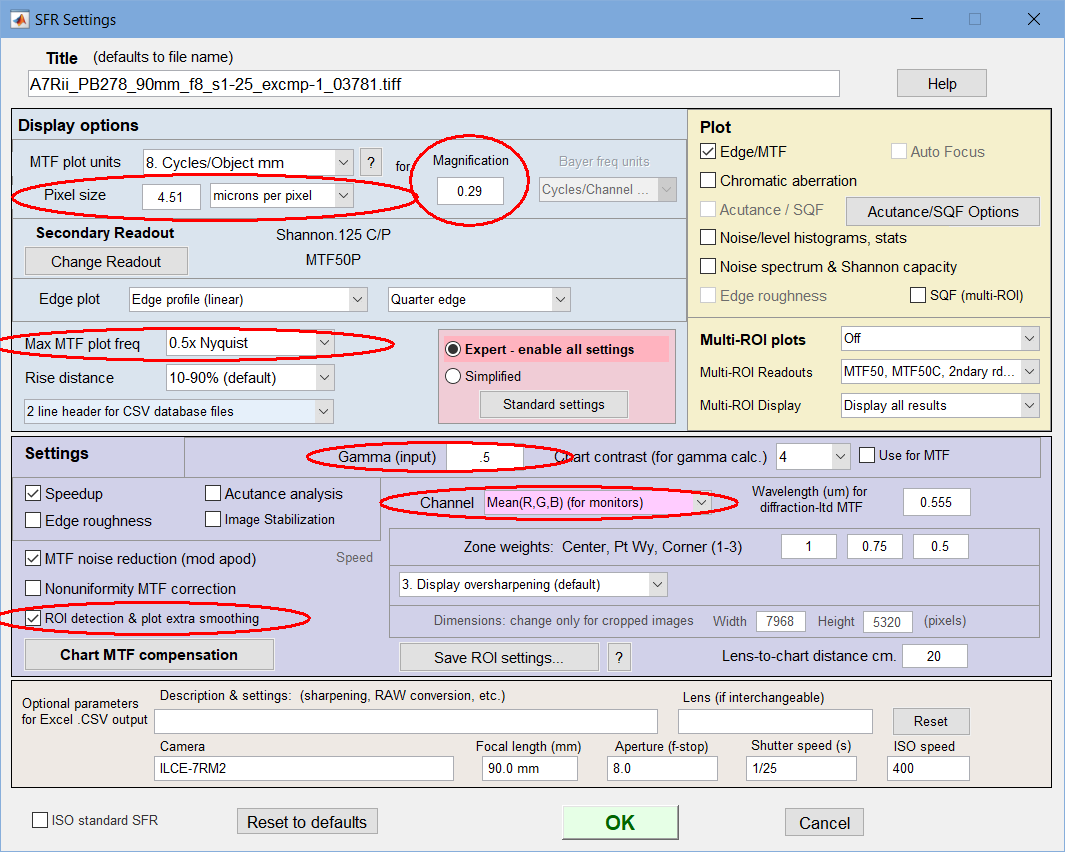 SFR settings window. Important settings, circled in red, are described below
| Setting | Recommendation | Description |
| MTF plot units |
Cycles/Object mm for monitor testing |
For Camera Monitor Systems (CMS), where MTF needs to be referenced to the monitor height, use LW/N pixels, where N represents the monitor height, which can be entered in the box on the right, normally reserved for magnification. This setting is explained below. |
| Pixel size | Pixel size (pitch), typically in μm, for the test camera | From camera specifications (or internet search) |
| Magnification | measured value | Magnification (M) of the object at the camera image plane. Can be measured from lens markings (if you’re lucky) or from measurement of an object of known size in the image. Lens geometry (camera focal plane-to-object distance and lens focal length) is not reliable for calculating M because lenses can deviate significantly from the simple lens equation. |
| Max MTF plot frequency | typically ≤ 0.5×Nyquist | for display-only. Not critical. Choose a value that lets you visualize results clearly. |
| Gamma (input) | typically 0.45 or 0.5 for sRGB files; 1 for files derived from RAW images. | Should be reasonably close: ±15% is adequate. Not critical. |
| Channel | Mean(R,G,B) (for monitors) | Important. The Y-channel (used in most camera analyses) overemphasizes the green channel. |
| ROI detection & plot extra smoothing | Checked | Important. This setting applies extra filtering to the the edge location detection so edges can be correctly detected in the presence of the monitor pixel structure. It does not affect the MTF results. The filter has been greatly improved in Imatest 2020.1. In earlier versions the structure of the monitor pixels often caused a detection failure. |
4. Results
Here are the results for vertical and horizontal edges. Click on the images to view them full-sized.
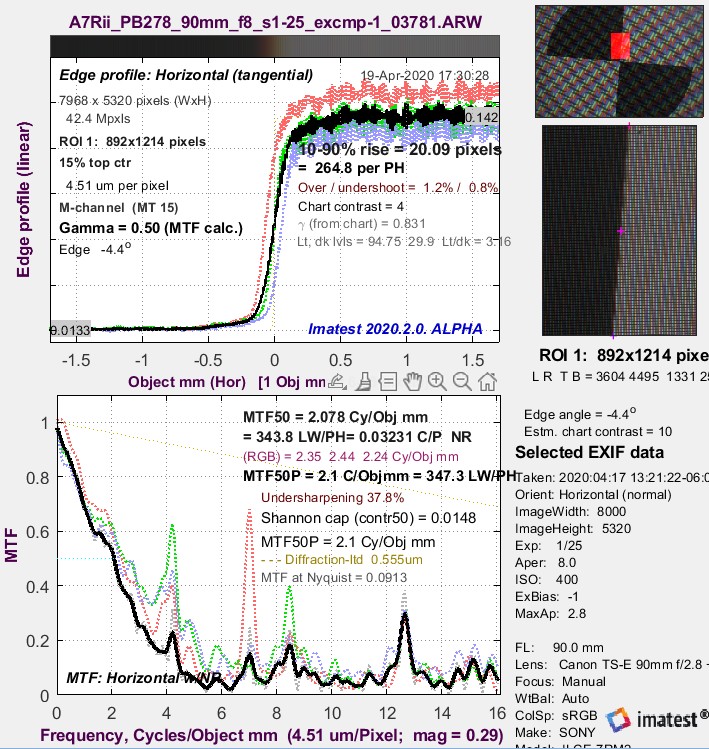 Vertical edge. MTF50 = 2.08 Cycles/Obj mm. Vertical edge. MTF50 = 2.08 Cycles/Obj mm. |
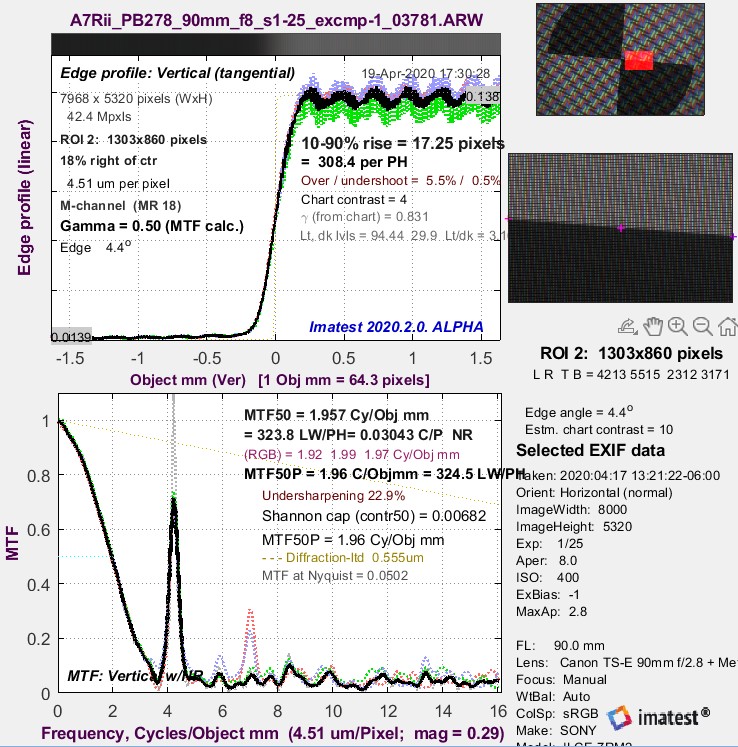 Horizontal edge. MTF50 = 1.96 Cycles/Obj mm. Horizontal edge. MTF50 = 1.96 Cycles/Obj mm. |
The Monitor Nyquist frequency = fNyq_M = 1/(2×pixel pitch) is not reported by Imatest. For this monitor, which has a pixel pitch of 0.233 mm, fNyq_M = 2.146 cycles/mm. MTF is closely related to pixel geometry. The first MTF peak is at 4.3 Cycles/Object mm = 1/pixel pitch = (2×fNyq_M).
Total monitor resolution in Cycles (Line Pairs) or Line Widths per Display Height can be found using the technique described in Appendix II, originally developed for Camera Monitor Systems.
In the Settings window, set MTF plot units to LW/N Pixels (PH) (or LP/N Pixels (PH)), then enter the Monitor image height (pixels) (which may be much larger than the test image) into the box labeled Picture Ht (pxls) to the right of Pixel size. From Appendix II,
Monitor image height = 0.233 mm × 1440 pixels × 0.29 / 0.00451 mm = 21574 pixels.
With this setting, plots have an identical appearance, except for the x-axis scales. MTF50(vertical edge) = 1394 LW/N Pixels (Line Widths per display height, where N pixels is the display height). MTF50(horizontal edge) = 1313 LW/N Pixels.
For some applications MTF in LW/Display Height may be more appropriate than Cycles/Object mm for specifying display performance.
TV lines were a common means of characterizing monitor or system sharpness in the old days of analog imaging, when Cathode Ray Tubes ruled the earth. They are still of interest because they can be used to compare analog and digital imaging systems.
TV lines are defined as the number of visibly distinguishable vertical lines measured over the height of a monitor. In this context, “Lines” refers to Line Widths (LW), where 1 cycle (Line Pair) = 2 Line Widths. This definition (Wikipedia) works well with Imatest measurements. For digital systems , the number of TV lines is approximately MTF20 (or better, MTF20P) in units of Line Widths per monitor height. Strictly speaking, MTF10 is closer to the Rayleigh diffraction limit, but MTF10 can be strongly affected by noise and other artifacts. MTF20P (which is less sensitive to strong software sharpening than MTF20, and usually isn’t very different from MTF10) is more robust and stable.
For the above system (the Asus PB278 monitor), TV lines can be measured from the vertical edge, shown on the left, above. MTF20 and MTF20P are approximately 3.2 cycles/Object mm = 6.4 Line Widths/Object mm. Since the monitor height is 0.233 mm/pixel × 1440 pixels = 335 mm, The number of TV lines (Line Widths) is 6.4×335 = 2144. Note that this is above the monitor Nyquist frequency = fNyq_M = 2.146 cycles/Object mm = 4.3 Line Widths/Object mm. This is consistent with the visible stair-stepping on the edges (a form of aliasing). It is much larger than typical NTSC TV monitors (400-600). We’ve come a long way.
Appendix I: Monitor gamma
Monitors are not linear devices. They are designed so that Brightness is proportional to pixel level raised to the gamma power, i.e., \(\text{Brightness = (Pixel level)}^{\gamma-display}\).
|
For most monitors, gamma should be close to 2.2, which matches the most common color spaces, sRGB and Adobe RGB. (They are encoded with an approximate inverse of gamma = 2.2.)
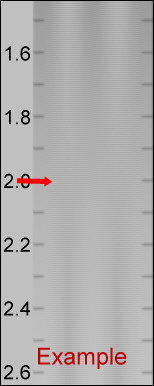
To view the gamma chart correctly, right-click on it, copy it, then paste it into Fast Stone Image Viewer. This worked well for me on my fussy system where the main laptop monitor and my ASUS monitor (used for these tests) have different scale factors (125% and 100%, respectively). The gamma will be the value on the scale where the gray area of the chart has an even visual density. For the (blurred) example on the left, gamma = 2. Although a full monitor calibration (which requires a spectrophotometer) is recommended for serious imaging work, good results can be obtained by adjusting the monitor gamma to the correct value. We won’t discuss the process in detail, except to note that we have had good luck with Windows systems using QuickGamma. |
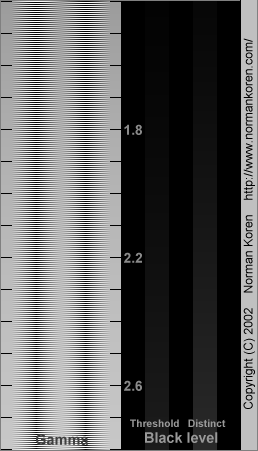 Gamma chart. Best viewed with Fast Stone image viewer. Gamma chart. Best viewed with Fast Stone image viewer. |
| Gamma, Tonal Response, and related concepts contains a detailed explanation of gamma: why it’s used, how to measure it, and much more |
Appendix II. Camera monitor systems
Camera Monitor Systems (CMS), are described in their own page. They use different units and don’t require as high a magnification of the monitor image, i.e., you should capture the complete monitor, instead of just a crop as we’ve done here. Here is a diagram of a typical CMS.
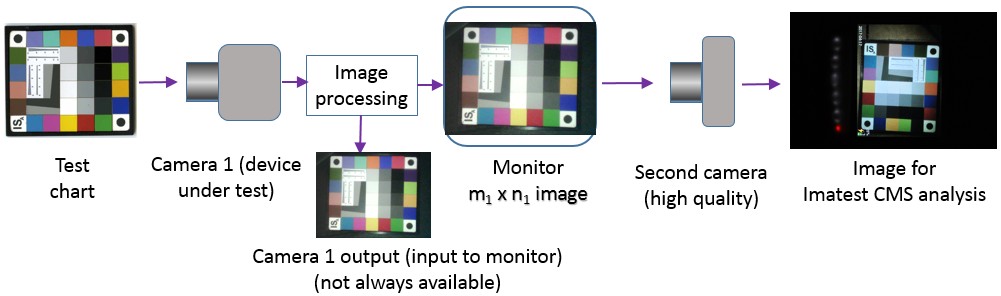 Camera Monitor System block diagram
![]() MTF units should be expressed in Line Widths per Display (Monitor) height. To do this, measure the monitor height in pixels in the camera image. In the settings window (shown on the right for SFR), select MTF plot units of 12. LW/N Pixels (PH) and enter the measured monitor height in Picture Ht (pxls). MTF plot units will be equivalent to LW/Monitor Height.
MTF units should be expressed in Line Widths per Display (Monitor) height. To do this, measure the monitor height in pixels in the camera image. In the settings window (shown on the right for SFR), select MTF plot units of 12. LW/N Pixels (PH) and enter the measured monitor height in Picture Ht (pxls). MTF plot units will be equivalent to LW/Monitor Height.
If the monitor height extends beyond the image, and the magnification is known, the following equation can be used to calculate the Monitor image height in pixels.
\(Monitor\ image\ height\ (pixels) = \\ \quad monitor\ pixel\ pitch \times monitor\ height\ in\ pixels \times magnification / camera\ pixel\ pitch\)
See also
- Sharpness
- Camera Monitor Systems are of increasing interest in the automotive industry. Display (monitor) sharpness (MTF) can be measured in units of Line Widths (LW) per N pixels, where N is the height in pixels of the monitor image in the second camera’s image. This is equivalent to Line Widths/Monitor Height.
- Testing display defects with Imatest Blemish Detect
- ISO 16505 — Road Vehicles — Camera Monitor Systems