Setting up and photographing SFR test charts
Imatest SFR measures spatial frequency response, also known as the Modulation Transfer Function (MTF), of digital cameras using a slanted-edge (light-to-dark) target, as described in Sharpness: What is it and how is it measured? Although it doesn’t provide the as strong a visual indication of MTF as wedge or sinusoidal chats (such as Log Frequency), it provides a more accurate quantitative measurement and uses space much more efficiently.
 |
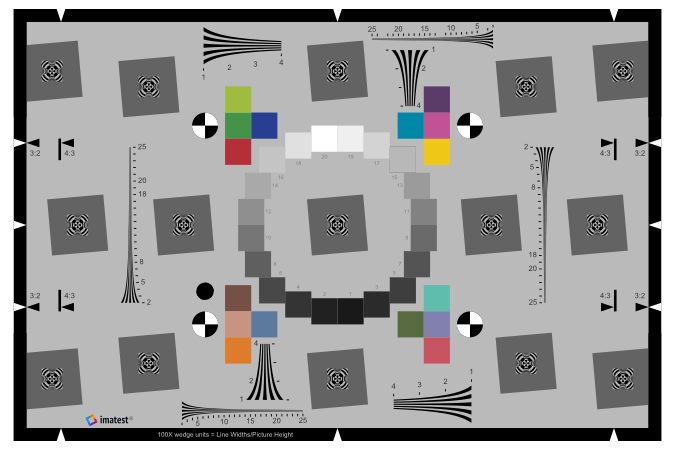 |
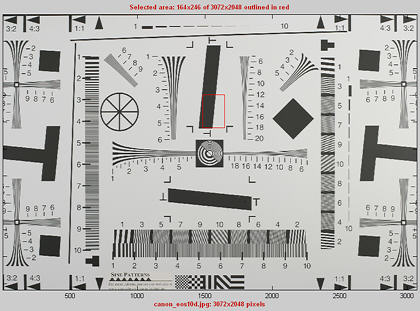
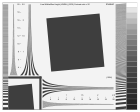
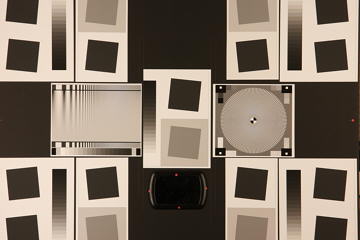
| Old ISO 12233:2000 test chart (left) with Imatest SFR cropping indicated by the red rectangle New ISO 12233:2014 test chart (right– supported with a high degree of automation in eSFR ISO) |
|
Imatest SFR also measures Chromatic aberration and noise. A standardized sharpening algorithm can be used to compare cameras with different amounts of sharpening (not recommended for camera development or lens testing).
These instructions also apply to the Rescharts Slanted-edge SFR module, which is performs identical calculations with a more interactive interface.
The SFRplus and eSFR ISO modules performs identical slanted-edge calculations using special test charts that enable automatic region selection and offer numerous advantages. If you are just starting MTF testing and if the available geometries fit your needs, we recommend one of these two chart/module combinations.
| Origins of Imatest SFR The algorithms for calculating MTF/SFR were adapted from a Matlab program, sfrmat, written by Peter Burns ( |
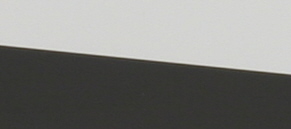
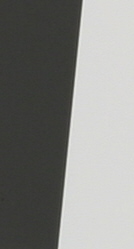
A horizontal slanted-edge for measuring vertical MTF is shown below; a vertical slanted-edge for measuring horizontal MTF is shown on the right. These edges were cropped from an image of the old ISO 12233:2000 test chart, shown above. A crop area is indicated by a red rectangle.
Imatest Master can analyze edges of nearly any angle. For best results, avoid exact vertical, horizontal, and 45° edges. |
 |
Obtaining, assembling, and photographing the target
Summary
- Obtain a test chart
- Print the chart or Display a pattern on an LCD screen.
- Assemble the printed charts into a target.
- Photograph the target.
- Tips: Lighting | Distance | Exposure | Photographing the target
- Test chart print quality
You can run Imatest SFR with any clean, sharp, straight black-to-white or dark-to-light edge. The solid areas need to be smooth and uniform: dark on one side and light on the other. For best results contrast should be no more than 10:1; 4:1 is recommended in the ISO 12233:2014 standard.
Obtain a test chart.
Several alternatives are available for obtaining test charts.
- Purchase a chart from the Imatest Store. SFRplus or eSFR ISO charts are strongly recommended. The ISO 12233 (QA-72) or QA-77 will do the job, but are not recommended (and no longer a part of the ISO 12233 standard). These (pre-2012) ISO 12233:2000 charts have very high contrast (>=40:1), which often results in reduced accuracy, and they have a great deal of wasted real estate: they lack usable edges in regions of great interest such as the four corners.
 For microscopic work, we recommend the SFRplus chrome-on-glass chart. Precision Ronchi Ruling from Edmund Optics, which come in several varieties, may be suitable for some applications even though they have higher than optimum contrast and edges on only one direction (two directions, i.e., a square or checkerboard pattern would be nicer). Choose a a lp/mm value that results in at least 40 image pixels per line pair (50-100 is even better). The ruling must be tilted by about 5 degrees when photographed.
- Create and print a test image from files generated by the Imatest Test Charts module. A variety of configurations, contrast ratios, and highlight colors are available. Contrasts between 10: and 2:1 are recommended. (4:1 contrast is specified in the ISO 12233:2014 standard.) Several Structured vector graphics (SVG) charts are available, including SFRplus and eSFR ISO, which have numerous advantages over the ISO 12233:2000 chart.

Nonlinear signal processing and chart contrast Although Imatest SFR is relatively insensitive to chart contrast (MTF is normalized to 100% at low spatial frequencies), measured SFR is often affected by chart contrast due to nonlinear signal processing in cameras, i.e., processing that depends on the contents of neighboring pixels, and hence may vary throughout an image. Nonlinear processing is almost universal in digital cameras (though you can avoid it by using RAW images with dcraw). It improves pictorial quality but complicates measurements. It takes two primary forms.
Different patterns respond differently to signal processing. Slanted-Edge versus Siemens Star compared two chart configurations of special interest because they are included in the ISO 12233:2014 standard. Signal processing algorithms are proprietary; they are a part of a manufacturer’s “secret sauce” for producing pleasing images. Though they vary a great deal, some generalizations can be made. Most cameras do NOT apply noise reduction and sharpening uniformly throughout an image. For this reason it can be useful to photograph both a relatively contrasty edge (though not so high that it causes clipping) as well as a relatively low contrast edge. Edge contrast can be selected with Imatest Test Charts. An estimate of chart contrast derived from the average light and dark pixel levels (away from the transition) and gamma is displayed in several places in SFR and Rescharts Slanted-edge SFR. (Estimated chart contrast = (avg. pixel level of light area/avg. pixel level of dark area)^(1/gamma) ). Nonlinearities are analyzed in depth in the Log F-Contrast module. |
Print the charts
The use of guide marks for tilting the chart
Print the test image with a high quality inkjet photo printer on semigloss, luster paper, or high quality matte paper. Alternatively, send it to a lab to be printed. Dry Creek Photo has an excellent listing. If you are printing small charts, print several to measure center and edge sharpness. Be sure the edges look clean and sharp to your eyes; examine them with a good magnifier or loupe. Chart quality is described in detail in Chart quality and distance, below.
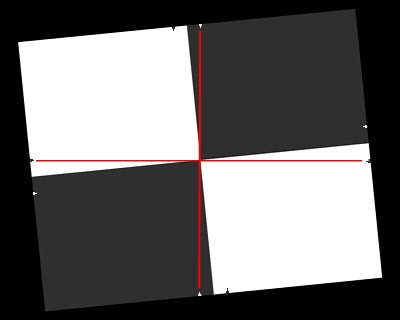
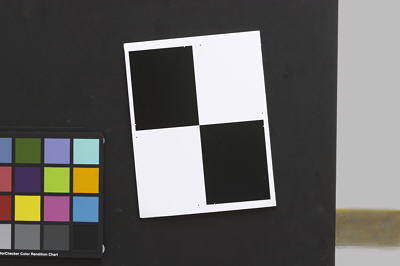
The bitmap charts are intended to be tilted approximately 5.7 degrees (anywhere between 2 and 7 degrees is OK) when they are photographed. They are tilted 5.7 degrees when the tick marks, located near the edges, are vertically or horizontally aligned with the center. This is illustrated by the red lines on the right. Imatest Master can analyze edges of nearly any angle; exact horizontal, vertical, and 45° edges should be avoided for best results.
Bitmap charts are printed straight and physically tilted because the edges print sharper that way. If they were printed at an angle, the printer dot pattern could cause some jaggedness. A 5.71° angle (tan-1(0.1)) is an offset of one part in 10. SVG charts are less affected by tilting.
Assemble the charts into a target to be photographed.
The following target is described in detail in Building a low-cost Test Lab. It can be used to measure lens performance near the center, part-way out, and near all four corners. The Log F-Contrast and Star charts to the left and right of center are not necessary for lens testing; they provide information about signal processing. Many other chart arrangements and added charts (the X-Rite Colorchecker, for example) are possible. Since 2009 we have used the SFRplus chartfor most of our lens testing.
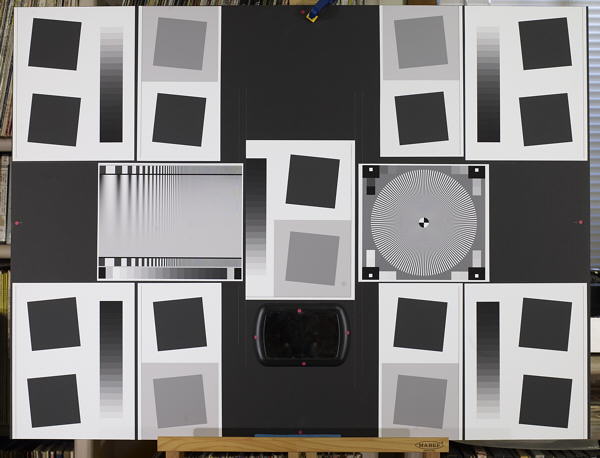
Sharpness target (30×40 inch) for cameras up to 13 megapixels
The printed charts are mounted on 32x40 or 40×60 inch sheets of 1/2 inch thick black foam board with spray adhesive (such as 3MTM 77 or Photo Mount) or double-sided tape (such as 3MTM Positionable Mounting Tape 568, which comes in 16 and 24-inch widths). If a ColorChecker is substituted, Velcro is recommended so it can be removed for dark storage. 1/2 inch foam board stays flatter than thinner boards. Black board results in less flare light than white board. (Flare light is light that bounces between lens elements and off the inside of the lens barrel, reducing image contrast.)
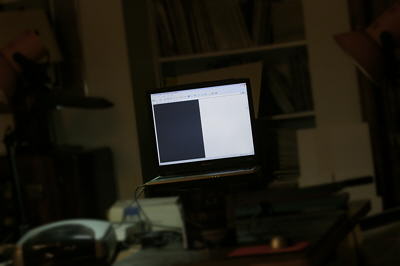 |
An image of a horizontal or vertical edge on an LCD monitor (desktop or laptop) may also be used as a target if the monitor does not flicker (many do). The camera should be tilted with respect to the monitor. The disadvantage of this technique is that you have only one edge to work with; you can’t easily create a map of lens performance. Imatest Screen Patterns can display suitable LCD test images. You can set contrast, which should be in the range of 4:1 to 10:1 to minimize clipping. To minimize artifacts (Moire, etc.) the camera must be far enough from the monitor so the sensor pixel “frequency” (1/(2*pixel spacing) at the image sensor) is at least 30% above the Nyquist frequency of the LCD screen. A rule of thumb is that the LCD screen image should take up no more than 1/3 to 1/4 the image width (1/9 to 1/16 the area). |
Photograph the target.
If possible, frame the chart so there are usable edges near the center, part-way out, and near the corners. Take care that the chart is properly aligned. A number of useful alignment techniques and tricks are presented in Building a low-cost Test Lab.
Lighting
The chart below summarizes lighting considerations. The goal is even, glare-free illumination. Lighting angles between 30 and 45 degrees are ideal in most cases. At least two lights (one on each side) is recommended; four or six is better. Avoid lighting behind the camera, which can cause glare. Check for glare and lighting uniformity before you expose. A description of recommended lighting setups can be found in The Imatest Test Lab. (We formerly recommended 4700K (near-daylight) SoLux quartz-halogen lamps, but we now recommend LED lamps, which are available with adjustable intensity and color temperature.) The BK Precision 615 Light meter (Lux meter) is an outstanding low-cost instrument (about $100 USD) for measuring the intensity and uniformity of illumination.

Distance
|
A letter-sized (8.5x11 inch) chart printed on Permium Luster paper on the Epson 2200 (a high quality pigment-based inkjet photo printer) was analyzed for MTF using the 6.3 megapixel Canon EOS-10D. There was no change when the image field was greater than 22 inches (56 cm) wide— twice the length of the chart. Performance fell off slowly for smaller fields.
Choose a camera-to-target distance that gives at least this image field width. The actual distance depends on the sensor size and the focal length of the lens. The minimum image field is illustrated on the right.
Commercial photographically-printed charts are often have better chart MTF than inkjet printers can achieve, and hence may be used at shorter distances— microscopic in some cases (chrome-on-glass charts).
Cameras with more pixels, and hence higher potential resolution, should should have a larger image field width.
|
Distance/field width guidelines for high quality inkjet charts
(You can get closer with photographically-printed charts.) |
|
|||||||||||||||||||||||||||||||||||||||||||||||||
| Image field width (in inches) = 8.8 × sqrt(megapixels) Image field width (in cm) = 22 × sqrt(megapixels) — or —There should be no more than 140 sensor pixels per inch of target or 55 sensor pixels per centimeter of the target. — or —The distance to the target should be at least 40X the focal length of the lens for 6-10 megapixel digital SLRs. (25X is the absolute minimun for 6 megapixel DSLRs; 40X leaves some margin.) For compact digital cameras, which have much smaller sensors, the distance should be at least 100X the actual focal length: the field of view is about the same as an SLR with comparable pixel count. The recommended distance is described in more detail in Chart quality and distance, below. |
||||||||||||||||||||||||||||||||||||||||||||||||||
| There is some confusion about lens focal lengths in compact digital cameras. They are often given as the “35mm-equivalent,” which many photographers can relate to viewing angle. 35-105mm or 28-140mm are typical “35mm-equivalent” numbers, but they are not the true lens focal length, which is often omitted from the specs. What is given is the sensor size in 1/n inches, a confusing designation based on the outside diameter of long-obsolete vidicon tubes. It The table on the right relates the 1/ndesignation to the diagonal dimension of the sensor. True focal length = “35mm-equivalent” × (diagonal mm.) / 44.3 | ||||||||||||||||||||||||||||||||||||||||||||||||||
Exposure
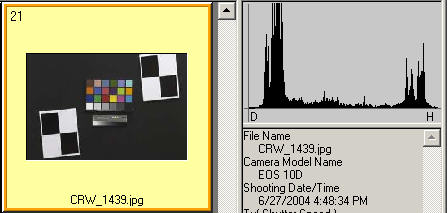
Proper exposure is important for accurate Imatest SFR results. Neither the black nor the white regions of the chart should clip— have substantial areas that reach pixel levels 0 or 255. The best way to ensure proper exposure is to use the histogram in your digital camera. Blacks (the peaks on the left) should be above the minimum and whites (the peak(s) on the right) should be below the maximum.
Low contrast test charts (with contrast ratios of 10:1 or lower) are helpful for avoiding clipping. The revised ISO 12233 chart (due out in 2012) has a contrast ratio of 4:1.
The above image (taken from the Canon File Viewer Utility) is close to a perfect exposure.
|
Save the image as a RAW file or maximum quality JPEG. If you are using a RAW converter, convert to JPEG (maximum quality), TIFF, or PNG. The file name should be descriptive and should indicate the parameters you are testing. The Imatest View/Rename Files module makes this easy. Use dashes and underscores ( – and _ ), but avoid spaces. (Spaces work with Imatest, but they can be troublesome in DOS command lines and web pages.) An example would be Canon_EOS10D_70-200f4L_100mm_f8_ctr.jpg.
You are now ready to run Imatest SFR.
|
|||||||||||||