Introduction
The impact of motion on image quality is an important aspect to be able to quantify because motion can degrade image quality. However, challenges exist because of the various dynamic and static elements that impact the assessment, including type of camera/object motion, ambient light level, ISO speed, and exposure time.
An example of an image quality metric standard to objectively quantify motion blur is found in the motion blur methodology included in the video metrics section of the IEEE 1858-2023 standard. With the approach in the standard, a horizontal motion is applied to a chart containing a slanted edge and a spilled coins (dead leaves) pattern. The analysis results at various chart velocities are compared to the results of those with no motion applied to the chart.
Other methods in the literature include Evaluation of motion blur image quality in video frame interpolation by Dinh et al. and Simulating motion blur and exposure time and evaluating its effect on image quality by Lin et al.
Lab Protocol
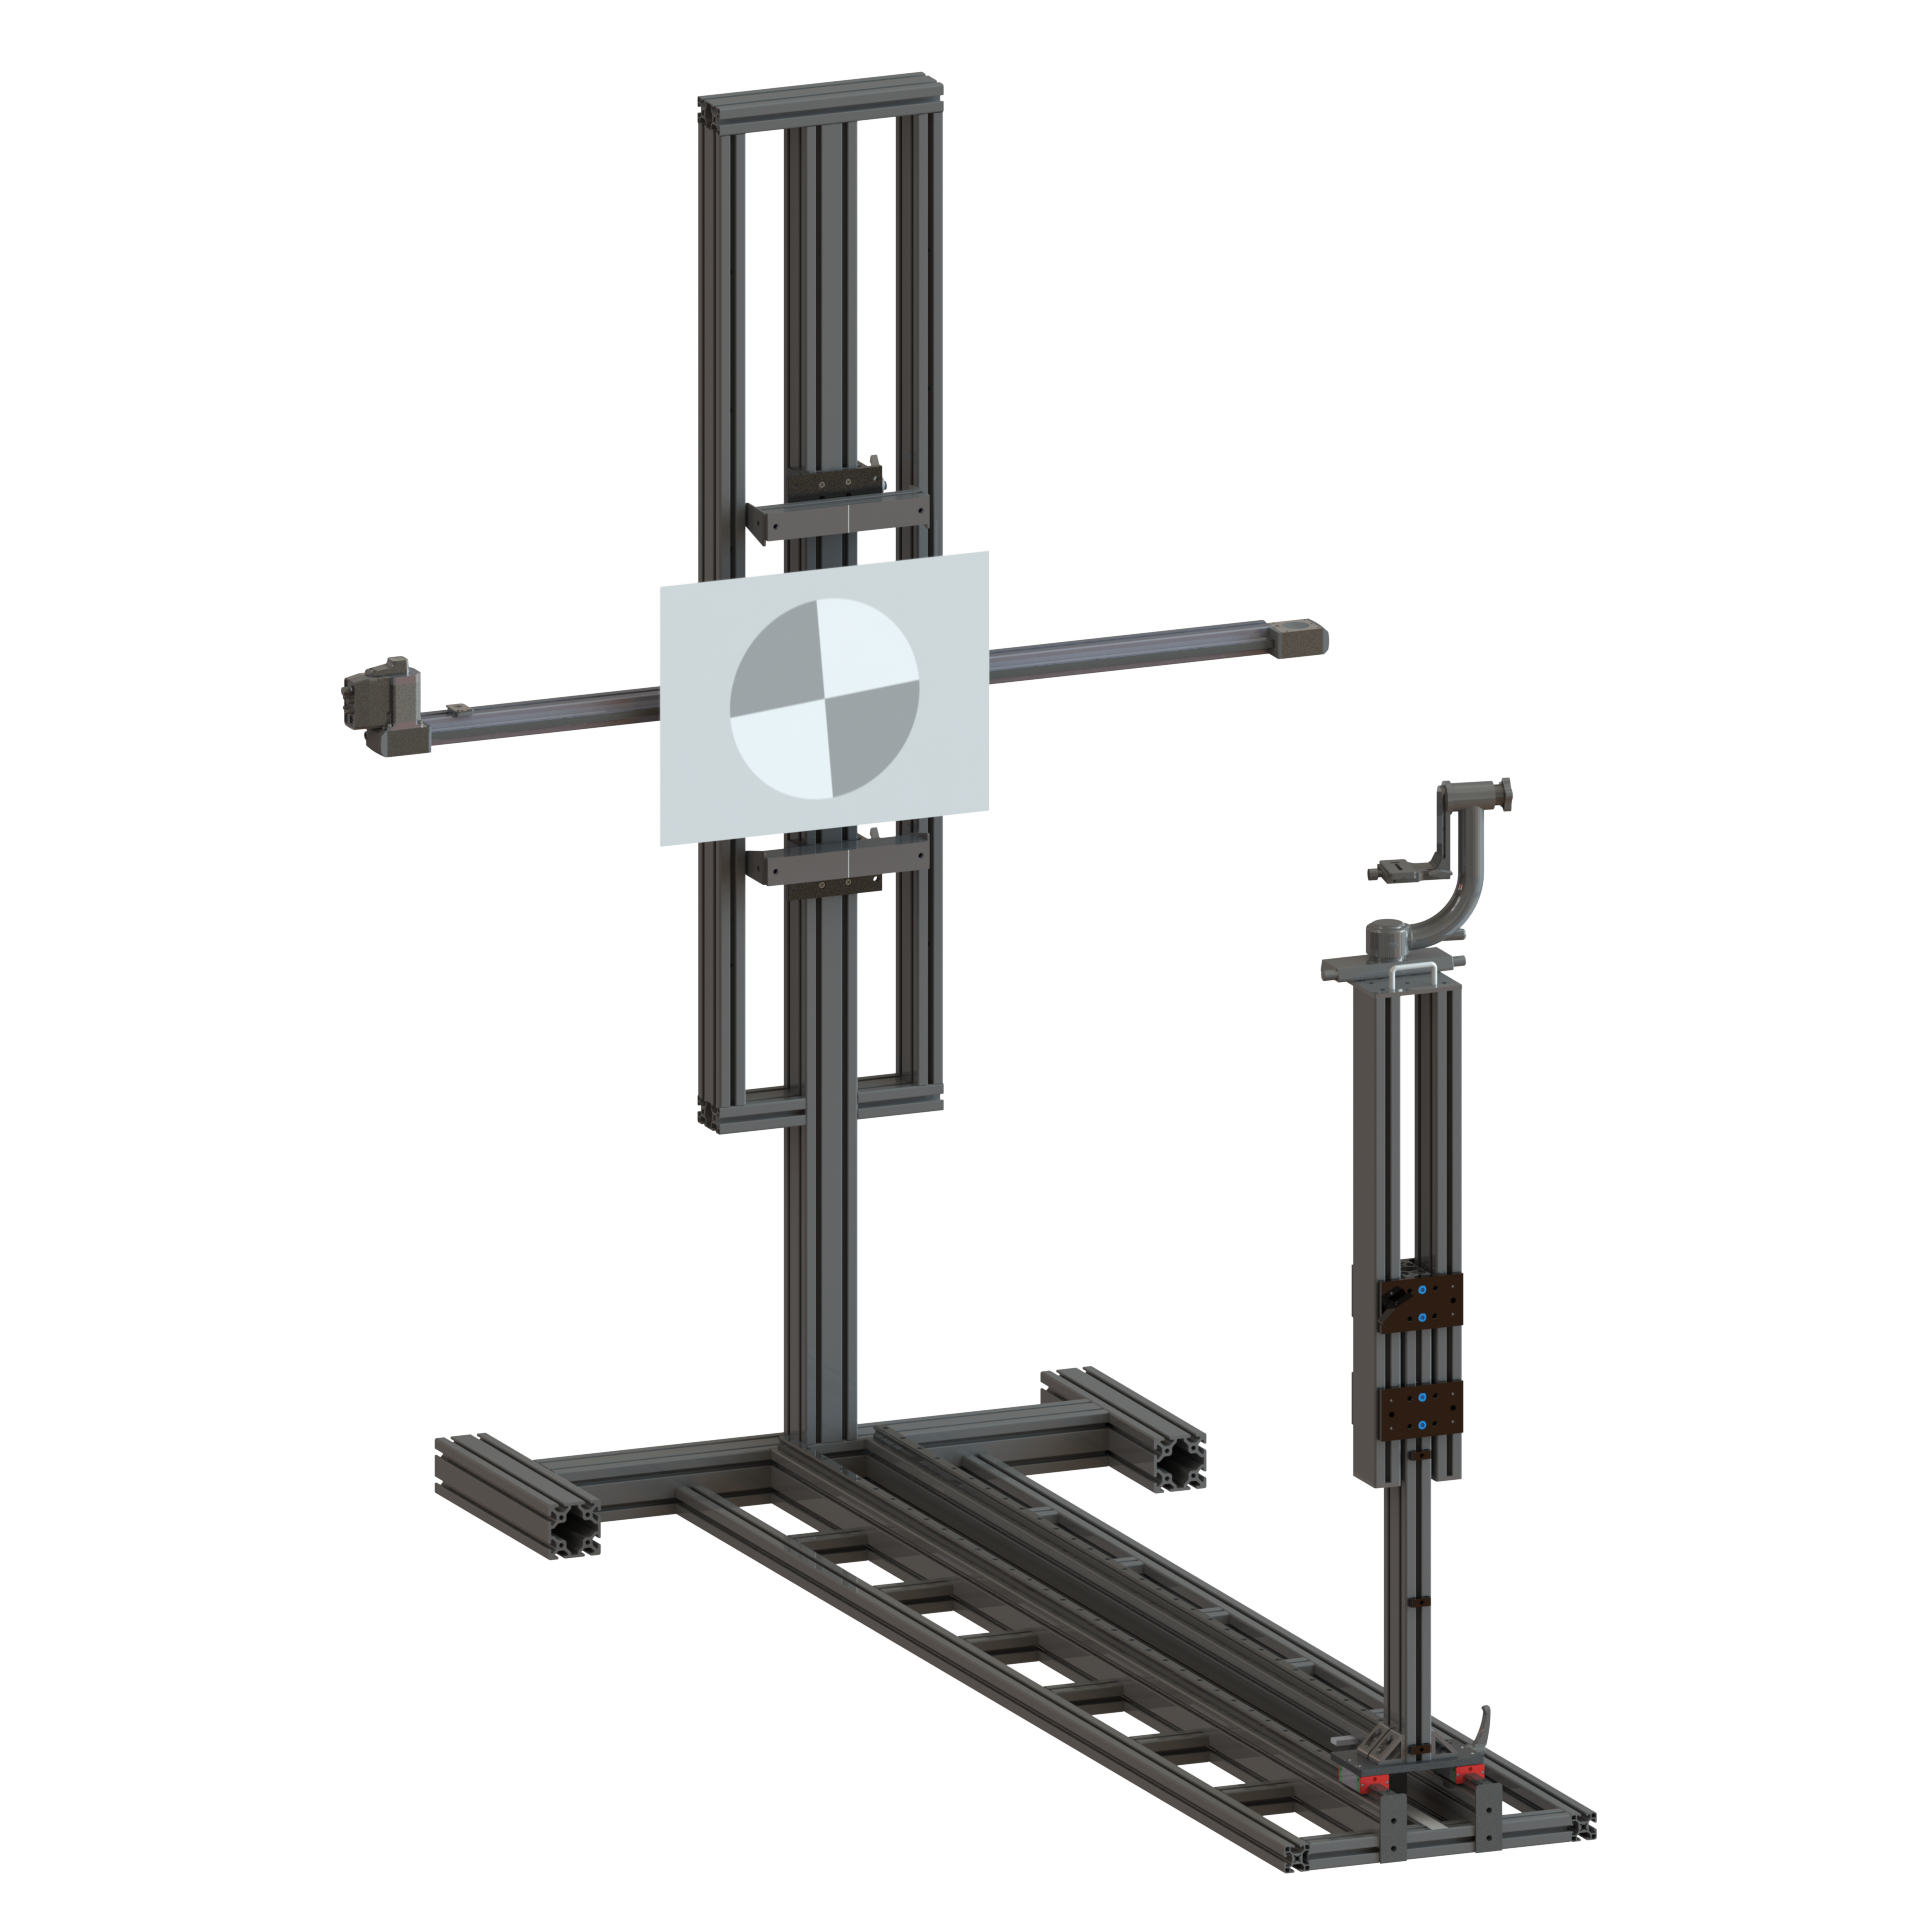
An approach that Imatest has taken uses sharpness results from slanted edges and exposure data from a timing box. Our Linear Motion Blur Tester is an add-on to our Modular Test Stand Base Module and is used to generate motion using a computer-controlled stage with precise linear movements. See Fig. 1. As with the IEEE 1858-2023 approach, a chart is captured both with horizontal motion and in a static condition.
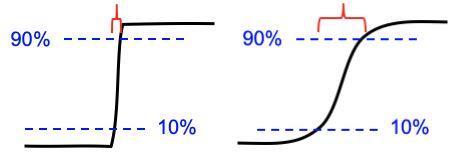
Analysis includes quantifying the spread of a slanted edge, specifically the width in pixel units of the 10-90% rise distance. See Figure 2 for an illustration of the edge rise distance. The greater the edge rise distance becomes, the greater the loss of sharpness is present. More details on this approach to measuring sharpness can be found in the Rise Distance and Frequency Domain section on our Sharpness: What is it and How it is Measured webpage.
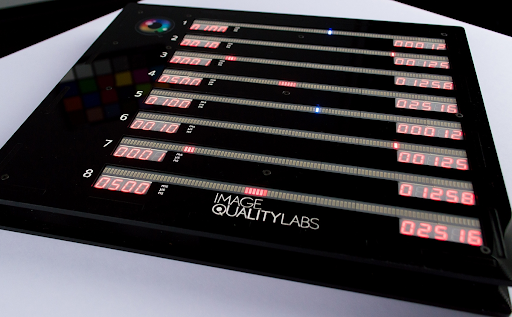
An additional element of the Imatest approach to motion blur quantification is to determine the exposure time using our IQL Camera Timing Test System. See Fig. 3. By analyzing 8 rows of scrolling LEDs along with roll-over counters, the exposure time can be determined.
Analysis
Tables 1 and 2 contain example data from three commercial products. Table 1 data is from videos captured at 100 lux illumination and Table 2 data is from videos captured at 1000 lux illumination.
Motion Parallel: The rise distance (in pixels) of the edge parallel to the direction of motion. If motion is horizontal, edges corresponding to Motion Parallel are also horizontal.
Motion Blur: The rise distance (in pixels) of the edge parallel to the direction of motion. If motion is horizontal, edges corresponding to Motion Blur are vertical.
As can be seen in the data, there are substantial differences in 10 – 90% width and exposure time between the dimmer 100 lux captures versus the brighter 1000 lux captures, particularly for the GoPro Hero 9 and LabPano Pilot Era cameras, with the 100 lux captures showing significant edge width. All example captures show an increase in % Spread Static to Motion Blur, regardless of capture illumination level or camera. Note also that the exposure time increases for all three cameras at the dimmer illumination.
Table 1. Motion Blur Data Captured at 100 lux illumination
|
Camera |
10 – 90% Width (Pixel Units) |
% Spread Static to Motion Blur |
Exposure Time (msec) |
||
|
Static |
Motion Parallel |
Motion Blur |
|||
|
GoPro Hero 9 |
1.02 |
1.12 |
9.11 |
893% |
17 |
|
GoPro Max 360 |
1.14 |
1.23 |
1.90 |
167% |
9 |
|
LabPano Pilot Era |
0.54 |
0.67 |
6.34 |
1174% |
45 |
Table 2. Motion Blur Data Captured at 1000 lux illumination
|
Camera |
10 – 90% Width (Pixel Units) |
% Spread Static to Motion Blur |
Exposure Time (msec) |
||
|
Static |
Motion Parallel |
Motion Blur |
|||
|
GoPro Hero 9 |
0.71 |
0.78 |
1.98 |
279% |
5 |
|
GoPro Max 360 |
0.94 |
1.19 |
1.26 |
134% |
5 |
|
LabPano Pilot Era |
0.73 |
0.53 |
0.88 |
120% |
12 |