

Information Capacity and more
Introduction – Summary of the information metrics – Information Capacity C – SNRi –
Object Detection Error Probability (ODEP) – Video – Documentation – Updates – White papers –
Documentation web pages – Conferences – Recent papers –
ISO 23654 – Call for participation
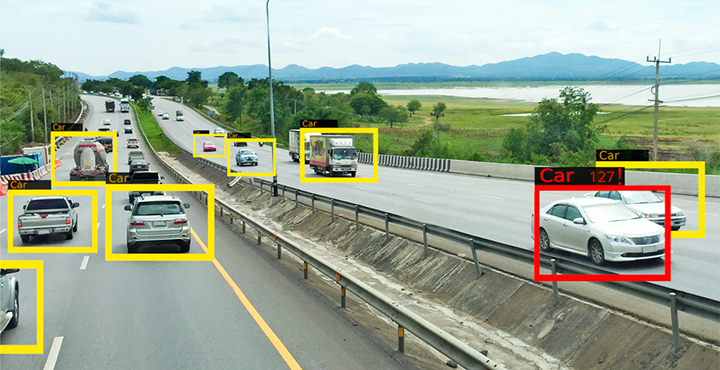 Validating Information Metrics Correlation with Object Detection Shannon information capacity correlates strongly with object detection confidence in AI models, outperforming traditional image quality metrics like MTF50, thereby offering a more accurate predictor of machine vision performance.
Introduction
The performance, i.e., the image quality, of cameras intended for the ever-expanding Machine vision (MV) and Artificial Intelligence (AI) markets — which include automotive (driver assistance and autonomous vehicles), robotics, security, and medical imaging systems — must be measured differently from pictorial (“pleasing”) images intended for human vision.
Questions that arise when designing camera systems for MV/AI applications include
- How best to select (or qualify) cameras?
- What are the best — most accurate, fastest, and most convenient — measurements for predicting MV/AI system performance?
- What image processing (ISP or filtering) is optimal?
To answer these questions, we must go beyond standard measurements of sharpness and noise and apply newly-developed metrics derived from information theory, including information capacity and related metrics for detecting and locating objects.
These metrics are important because Object Recognition in MV, and AI algorithms operate on information, not pixels.
|
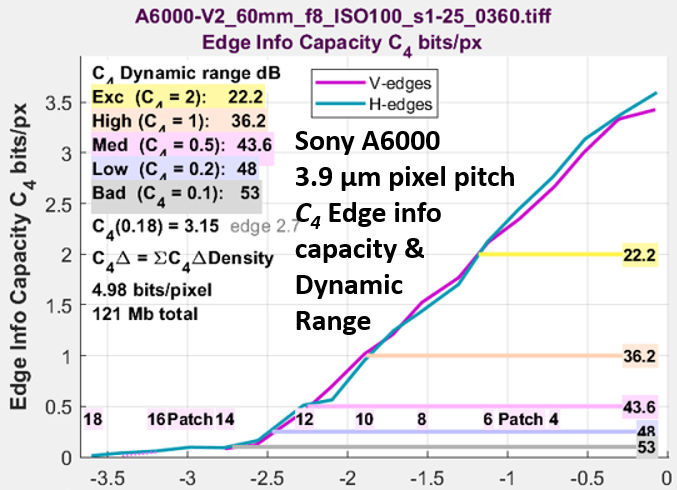
Traditional pixel-level image quality metrics, sharpness (MTF(f) or SFR(f)) and noise (or Signal-to-Noise Ratio, SNR) are incomplete metrics of camera performance. (Shannon) information capacity, C, which
is a complete performance metric that can be correlated to performance measurements such as the error rate for recognizing or classifying an object, for example, for determining whether it is a car, a bicycle, or a person).
Imatest has developed a fast, convenient method for measuring information capacity and related performance metrics, summarized below. The new metrics are included in Imatest 26.1+ releases. |
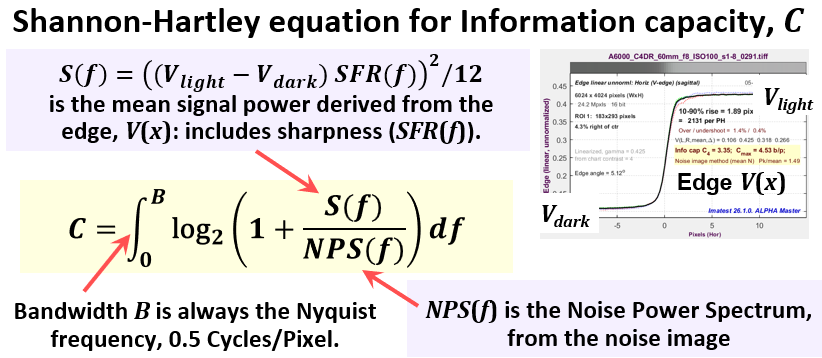
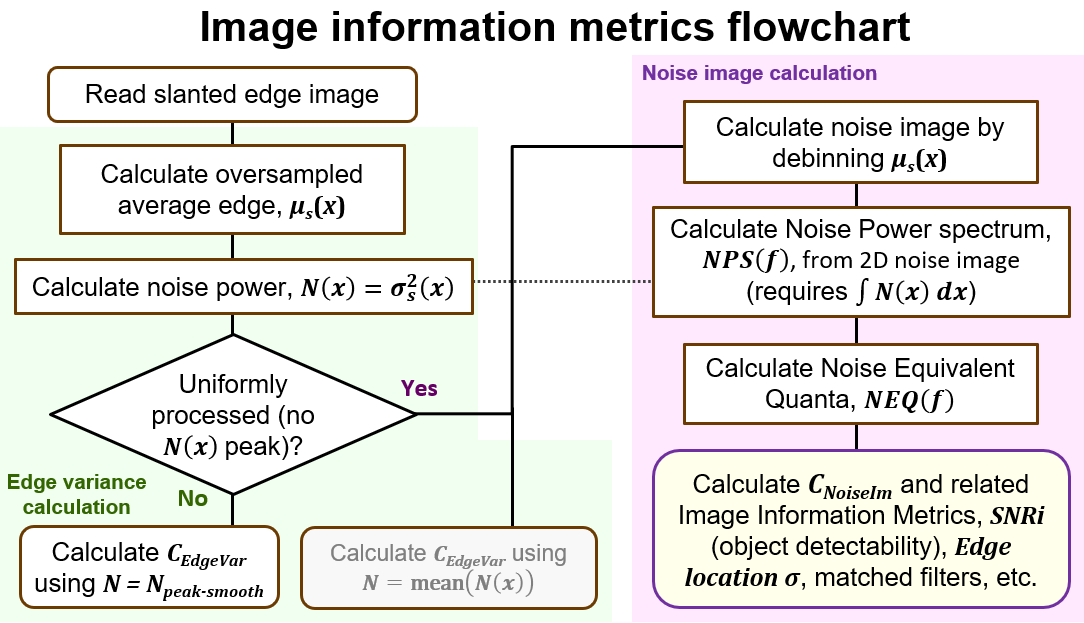
A matched filter defines the optimum image processing for a specific measurement and object. Practical filter (equalizer) design involves a mild tradeoff for the wide range of objects that need to be detected. The above metrics (C, SNRi, and ODEP) are derived from Spatially-dependent noise power (N(x)), Noise Power Spectrum (NPS(f)), and Noise Equivalent Quanta (NEQ(f)). The latter two information metrics share a common kernel, \(K(f) = MTF^2(f) / NPS(f)\). Information metrics are the basis of the ISO 23654 standard, now under development.
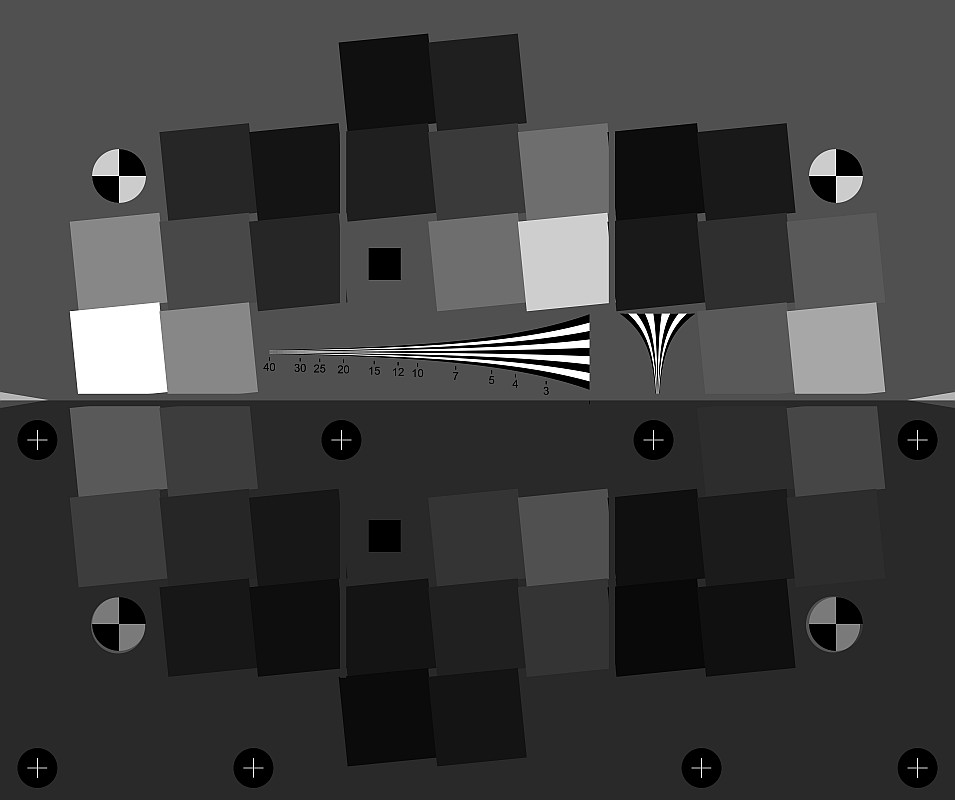
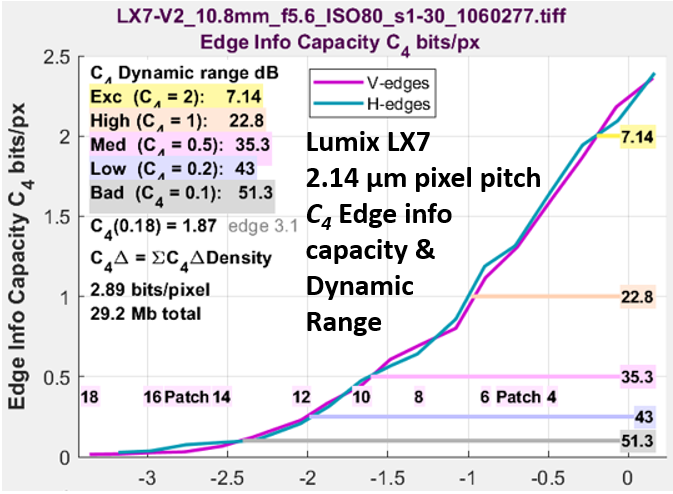
For uniformly processed-images, only CNoiseIm, which is more accurate than CEdgeVar , is reported. NoiseIm is omitted because it is always implied. The edge contrast (ratio) is usually reported in its place, i.e., C4 for 4:1 contrast edges. |
|
Norman Koren presented a short course and two technical papers at PDF handouts of the presentations are available for download, below.
|
Documentation, white papers, and instructions
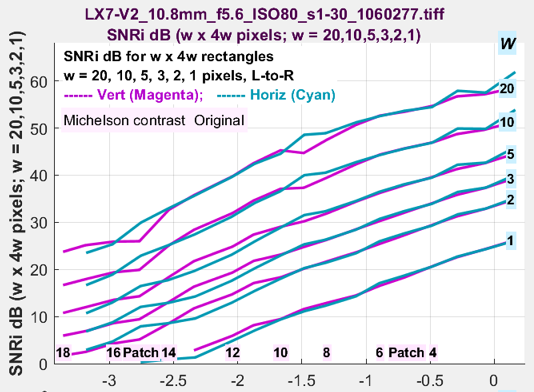
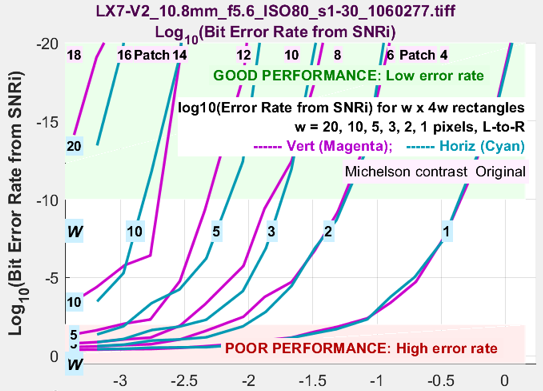
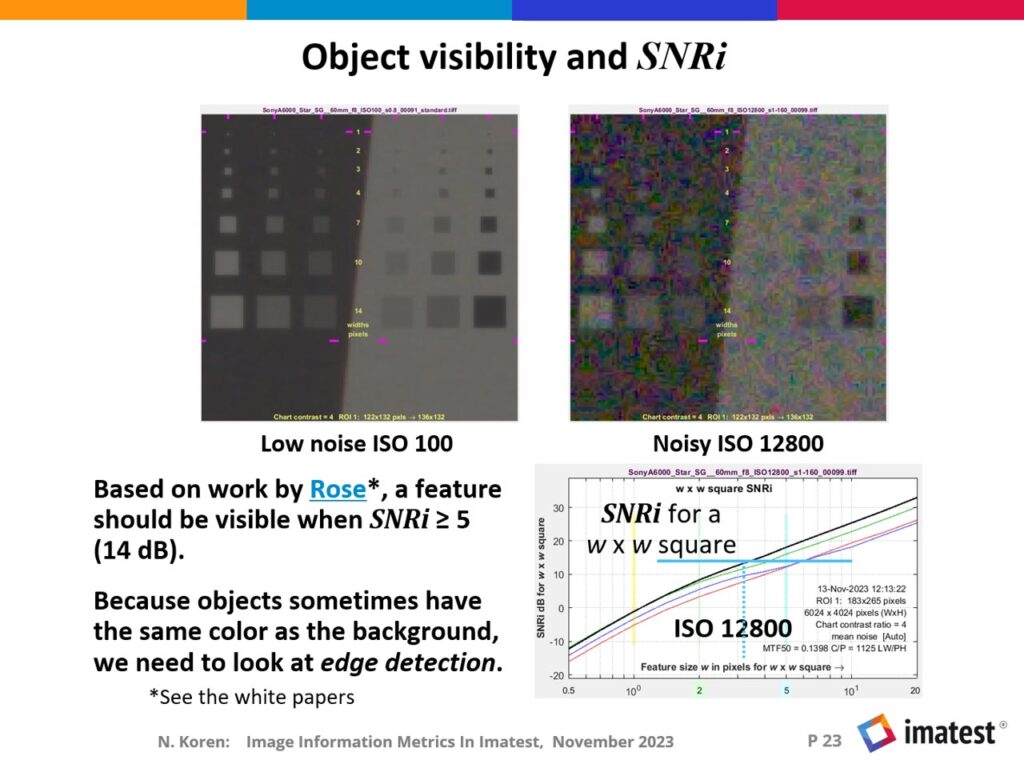
Updates — We continue to learn new things about the information metrics.The most important added calculation is Object Detection Error Probability (ODEP), which is a function of ideal observer SNR, SNRi. It a true metric for camera performance, i.e., how well an object can be detected. It requires the definition of a task (Detection, Recognition (Classification), or Recognition (DRI)). The most common task is Recognition: determining the type of object— car, person, boat, plane, etc. Key metrics used to quantify machine vision system performance are Mean Average Precision (mAP) and Intersection over Union (IoU). We will be working on verifying the hypothesis that SNRi is a predictor of mAP and Edge Location σ is a predictor of IoU. Recommended White PapersImage information metrics from slanted edges, (Adapted from a paper presented at Electronic Imaging 2024) is a detailed technical introduction to the new information metrics with the full set of equations. Image quality testing based on information metrics is a concise tutorial/short course/textbook for camera image quality testing, primarily for machine vision, focusing on the new metrics derived from information theory, which are highly predictive of camera performance. Not overly technical. Emphasizes the importance of both spatial and tonal measurements. Other White papersCamera Information Capacity from Siemens Stars (2020) describes a method that is slower and less convenient than the slanted edge, but better for observing the effects of image processing artifacts such as demosaicing, data compression, etc. Introduction to Image Information Metrics is a concise introduction to image information capacity and related metrics, with a minimum number of equations and technical detail. Most of the material is on this page or on Image information metrics from slanted edges. Image Information Metrics and Applications: Reference (41 pages) has all the equations and technical detail, but it may be challenging to read. It’s the primary reference for the metrics. Most of the material is on Image information metrics from slanted edges. Imatest software documentation web pages
Older or obsolete pages
Conferences (newest first)EMVA (European Machine Vision Forum), October, 2025, Furth Germany. Norman Koren presented a paper describing how to use EMVA 1288 measurements for the Simatest noise model. Autosens USA 2025 — Detroit, June, 2025. Norman Koren presented a 2 1/2 hour short course, Information Metrics for Optimizing Machine Vision Systems, that included an introduction to the Camera/ISP simulator, Simatest. Electronic Imaging 2025, February 5, 2025, Burlingame, California (near SFO). Norman Koren presented a two hour short course, Information Metrics for Optimizing Machine Vision Systems. Autosens Europe 2024 — Barcelona, Norman Koren, gave a three-hour tutorial on image information metrics. Autosens USA 2024 — Detroit The keynote talk, New camera quality measurements for optimizing Machine Vision systems (slides in PDF format), updated to include Edge location standard deviation (σ), is available for downoad here. Electronic Imaging 2024 Norman Koren presented a one-hour keynote talk on Image Information Metrics at Electronic Imaging 2024 in Burlingame, California. The updated and revised version of the talk (Image information metrics from slanted edges) is strongly recommended. The slides from the talk (PDF format) are available for download here. (The original paper is available for download here.) |
International Standard ISO 23654 (in development)
ISO 23654 began development in early 2023. Based on ISO 12233, it will specify how to calculate information capacity and related metrics from slanted edges. It is in the PWD (preliminary working draft) phase. It is open to new members.
Call for Participation
We are interested in working with machine vision and computer vision experts who are experienced with studying how image quality metrics correlate with object detection performance in computer vision systems. Please contact [email protected] if you are interested.