Automatic region detection in SFRplus and eSFR ISO tolerates moderate amounts of optical distortion (pincushion or barrel), but it has definite limits. In this page we describe special versions of SFRplus and eSFR ISO charts that can work (i.e., can be detected automatically) with highly barrel-distorted (“fisheye“) lenses, with fields of view up to around 160 degrees— which are used in a number of applications, particularly for automotive rear-view and sports cameras. Cameras with fields of view over 160 degrees— even approaching 360 degrees— can be tested with the SFRreg module, which uses multiple individual “registration mark” charts facing the camera.
|
Here is an example of a strongly barrel-distorted image (from the SFRplus settings window). Automatic ROI detection actually works, but ROI size has to be made very small to avoid including the chart edges or bars in the corner regions, and corners of the image are not included in the analysis. With more distortion, SFRplus is likely to fail entirely.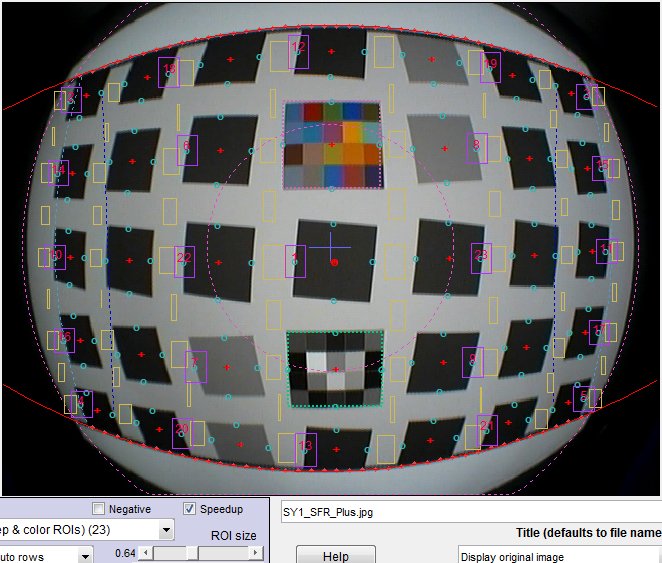
Strongly Barrel-Distorted (“fisheye”) image
(This image is actually from a pre-distorted chart with a less than optimum amount of pre-distortion.)
 To measure the performance of highly distorted fisheye lenses, Imatest offers several pre-distorted charts: charts designed with built-in pincushion distortion (the inverse of barrel distortion) so that the image used for SFRplus analysis has relatively small amounts of distortion.
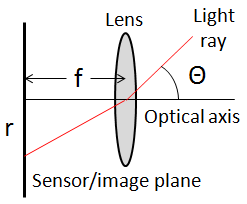
Fisheye lenses differ from normal (rectilinear) lenses in the mapping between the object angle Θ and the radius r on the image plane.
For rectilinear lenses, r = f tan Θ.
For typical fisheye lenses, there are several mappings, but the most common is r = f Θ.
Imatest pre-distorted charts are designed to produce the inverse of this mapping for a specific diagonal angular field of view, and they work well over a fairly large range of angular fields of view. Perfect correction is not required.
Imatest offers standard pre-distorted charts as well as custom charts that can have extreme distortion (which means that the chart height in the center can be much smaller than the edges, which may affect measurements in high resolution cameras). Pre-distortion is offered as an option for SFRplus and eSFR ISO charts in the Imatest Store.
Each SFRplus chart has two numbers printed in light gray (so they don’t affect measurements) on the right, below the bottom bar. The first number is half the optimum angular field of view in radians. Multiply by 360/π to get the angular field of view in degrees. For example 0.8333 corresponds to an angular FoV of 95.5 degrees, and works for Fields of View from about 85 to 120 degrees. (Standard charts work well for <85 degrees.) The second number is a scaling factor, needed to get correct distortion and Field of View measurements in SFRplus. These numbers should be entered into the SFRplus More settings window:
|
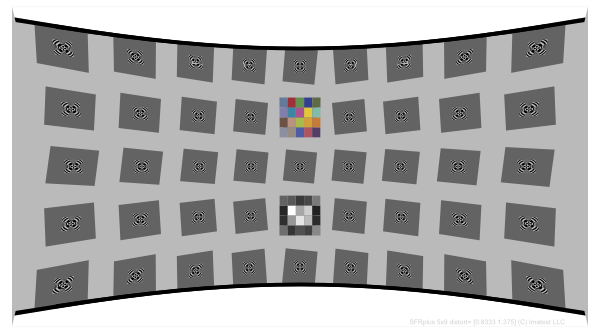
1. SFRplus Normal Distorted for 85-120º FoV Distortion parameter = 0.833. Optimum Field of View = 95.5o diagonal. Usable Fields of View = 85-120o. 5×9 squares shown |
 |
|
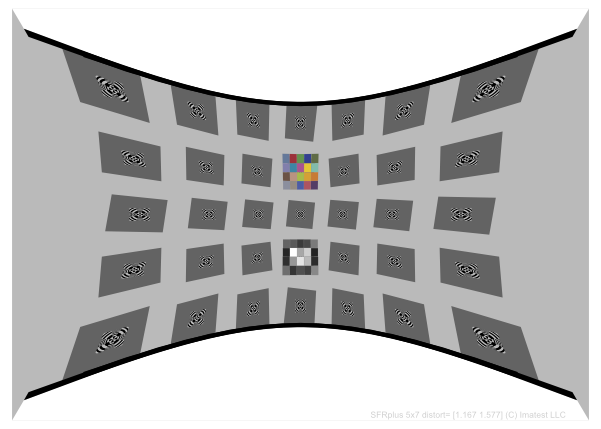
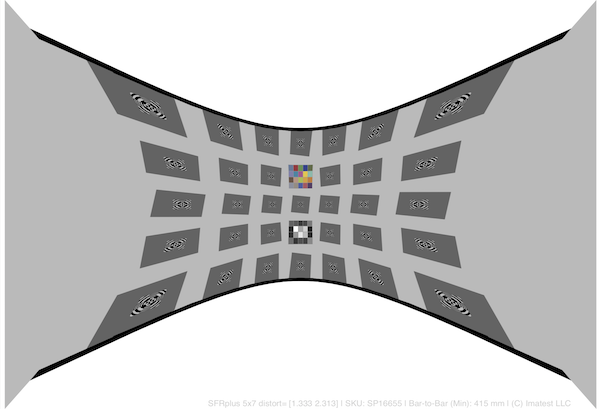
2. SFRplus Extra Distorted for 120-150º FoV Distortion parameter = 1.167. Optimum Field of View = 134o diagonal. Usable Fields of View = 120-150o. 5×7 squares shown |
 |
|
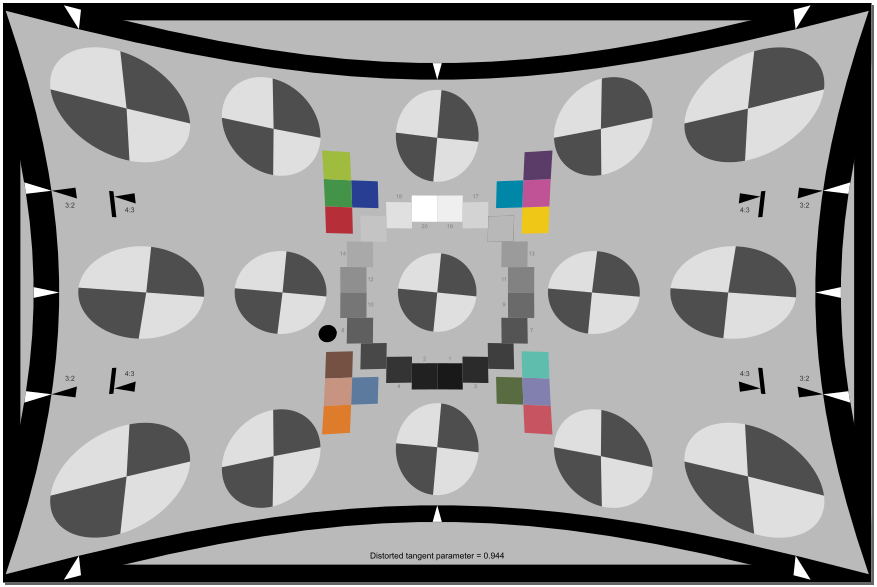
3. SFRplus Custom Distorted for up to 160º FoV Optimum Field of View = 160o diagonal. Usable Fields of View ≥ 150o. 5×7 squares shown The extreme corners of the image cannot be measured much beyond 160o.Caution is advised when using these extremely pre-distorted charts with high resolution cameras because the relatively small chart height in the center can affect measurements. See the discussion of fisheye lenses in Chart Quality Calculator. |
 |
|
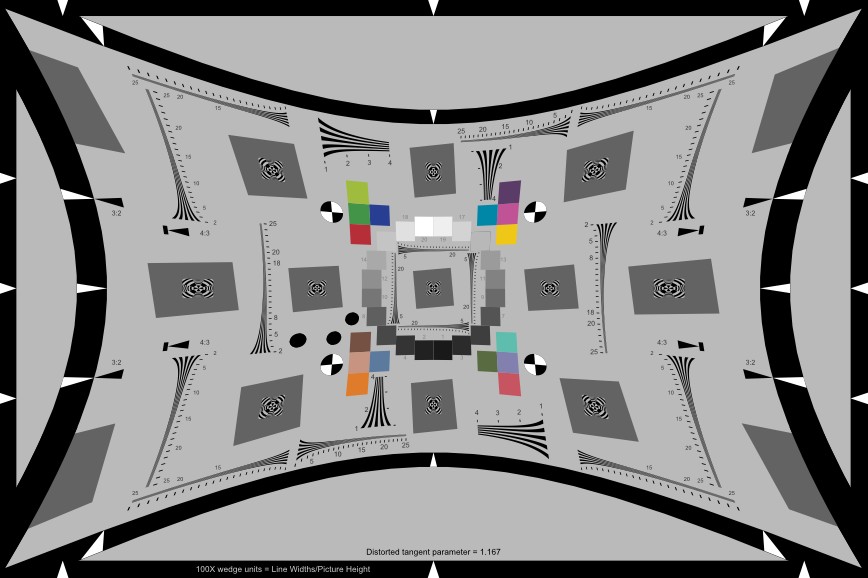
4. eSFR ISO Extra distorted for 120-150º FoV (shown with extra wedges) Optimum Field of View = 134o diagonal. Usable Fields of View = 120-150o. Enhanced version shown NOTE: This does not yet perform accurate FoV or Distortion calculations. Any version of the eSFR ISO chart can be produced in inkjet or LVT film media with any degree of distortion. |
 |
|
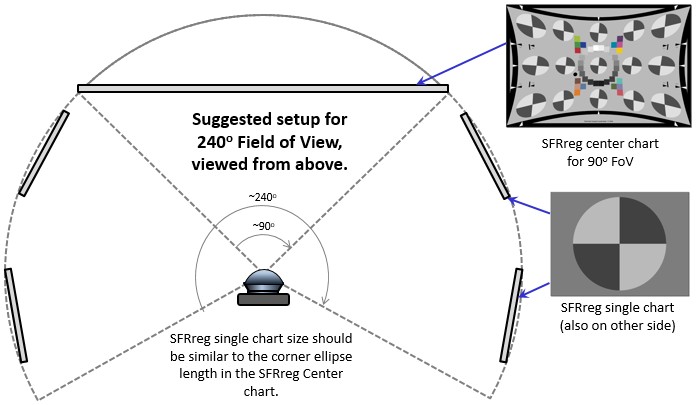
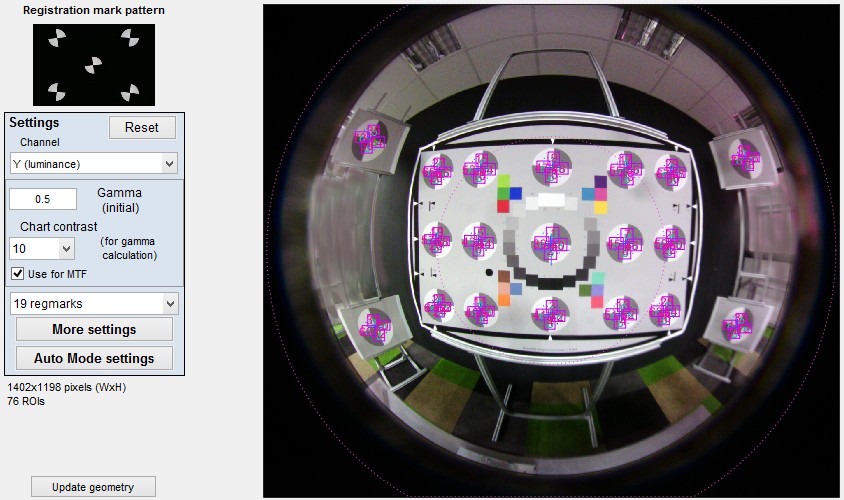
5. SFRreg charts for extreme Fields of View showing the SFRreg center chart for ~90 degree (horizontal angle) with added individual SFRreg charts for angles outside 90 degrees (can go well over 180º total FoV) NOTE: This target does not automatically perform color. tone, noise, tilt, rotation, FoV or Distortion calculations in Imatest versions prior to 5.0. All but FoV and Distortion will be added in 5.0. The SFRreg center chart is designed to cover central 90o in cameras with much larger Fields of View (can be > 180o). It is intended to be used with additional single SFRreg charts that typically face the camera. A top view of a typical arrangement is shown below. The charts on the sides typically represent two (or more) charts located in the corners (and possibly sides) of the camera’s field. For more details, see SFRreg Instructions.
The SFRreg setup window for an image with a SFRreg center chart and four outer charts facing the camera is shown on the right. Field of View is approximately 180 degrees. 19 registration marks were selected (15 in the center chart; 4 on the outside). |
|
Notes:
- Reflective inkjet charts are only available in matte finish because the wide viewing angles of these charts makes glare (specular reflections) difficult to control with semigloss charts.
- The aspect ratio of printed distorted charts is different from regular charts because of the distortion.
You can select pre-distorted charts in the Imatest Store by selecting a configurable inkjet chart and using the Distortion dropdown menu. Write us if you experience difficulties getting the options you need. Or you can select the SFRplus Automotive Test Chart.
Using pre-distorted SFRplus charts
The image should be framed in the same way as regular SFRplus charts: with some white space above and below the top and bottom bars. The pattern may run off the sides of the frame or the sides of the frame may extend beyond the image. The only difference (for SFRplus) is that the Distortion parameters (the two numbers on the lower-right of the chart) can be entered in the SFRplus More Settings window to obtain correct distortion and Field of View measurements.
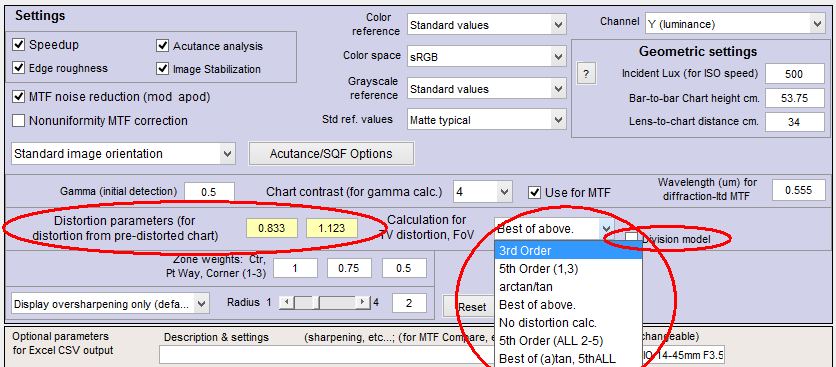 Portion of SFRplus More Settings window, showing Distortion parameters
(Only distortion and Field of View measurements are affected.)
You can select one of several distortion calculation models (Best of above is shown): 3rd Order ( ru = rd + krd3 ), 5th order ( ru = rd + h1rd3 + h2rd5 ), arctan/tan (often best for fisheye lenses), (5th Order ALL 2-5) ( ru = rd + h1rd2 + h2rd3 + h3rd4 + h4rd5 ).
Division distortion model — A division model of polynomial distortion is available (checkbox, shown above), where polynomial distortion of the form ru = rd + ∑knrdm is replaced by ru = rd /(1+ ∑knrdu ), where u = m-1 (for example, 5th order becomes ru = rd /(1 + h1rd2 + h2rd4 ). The division model tends to work much better than the standard model for strongly barrel-distorted (fisheye) lenses.
Here is an Image and geometry plot. Note that this chart is not perfectly corrected for distortion (it can be far from perfect), but the result is well within the limits of SFRplus. MTF is measured to near the corners.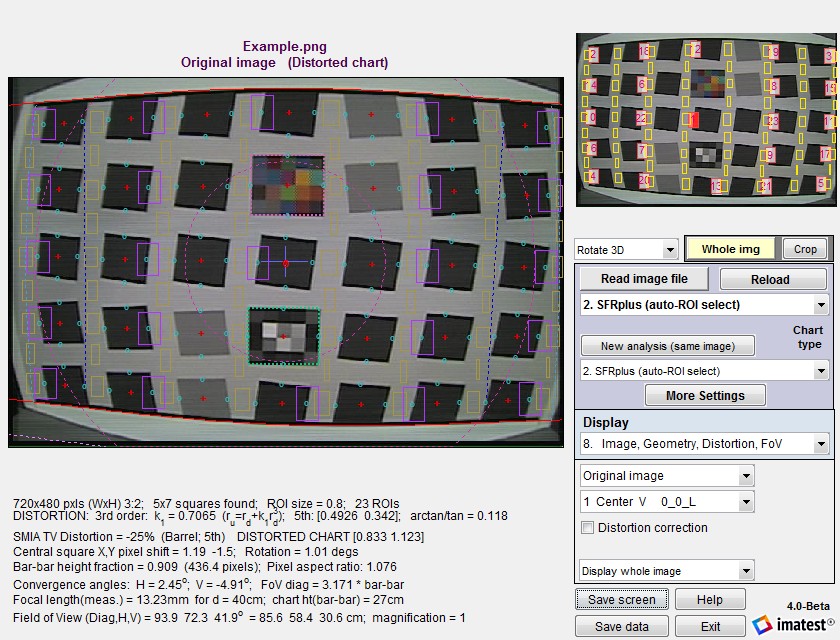
Image and Geometry plot for Pre-distorted image
Appendix: Creating and previewing pre-distorted charts
Although we recommend purchasing charts from the Imatest Store* (our charts meet the highest quality standards), we provide customers with the capability of printing their own. If you plan to do this, you should have a photographic-quality wide-body printer (Epson and HP are the leading suppliers), preferably with 12 inks (which have smoother gray tones than printers with fewer inks), and strong knowledge of ICC color management. Full details of making and printing SVG (Scalable Vector Graphics) charts are on SVG Test Charts. *The chart illustrations on this page are undistorted, but the links contain fields that let you specify distortion.
 Settings for Extra Pre-distorted chart, 5×7 squares, 4:1 contrast.
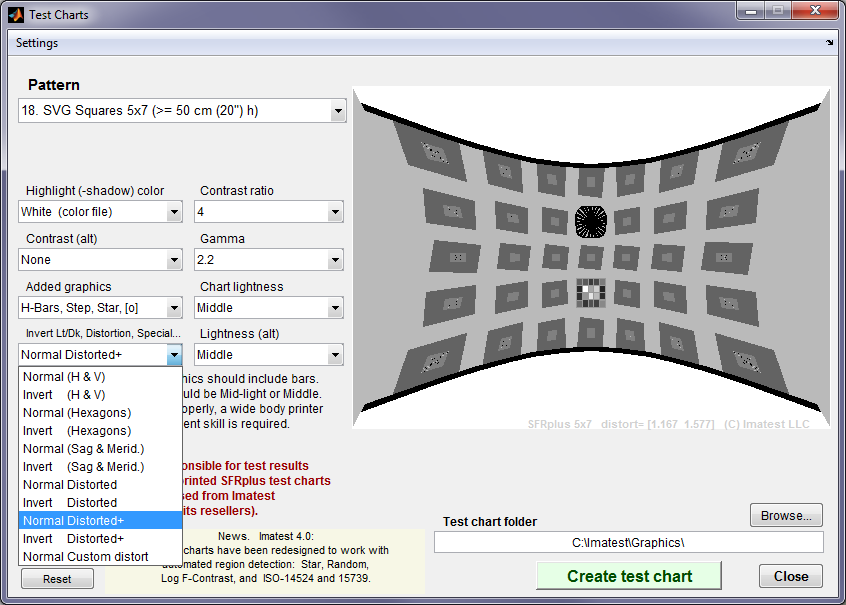
If you need to determine the appropriate amount of pre-distortion for your camera system (either for a chart you plan to order from the store or print yourself) you should
- Run Imatest Test Charts for the chart of interest.
- In the Distortion… dropdown menu (lower-left), select Normal Custom distort.
- Open a distorted image to preview (shown for the Colorchecker Classic chart, below).
- Adjust the distortion parameter to observe how pre-distortion would affect the image.
You can select distortion parameters up to π/2, which corresponds to a 180 degree field of view, which would be completely impractical because he chart would be totally compressed in the center. A parameter of around 1.4, corresponding to 160.4 degrees (shown in Custom distorted chart 3 (above)), is about the largest practical value.
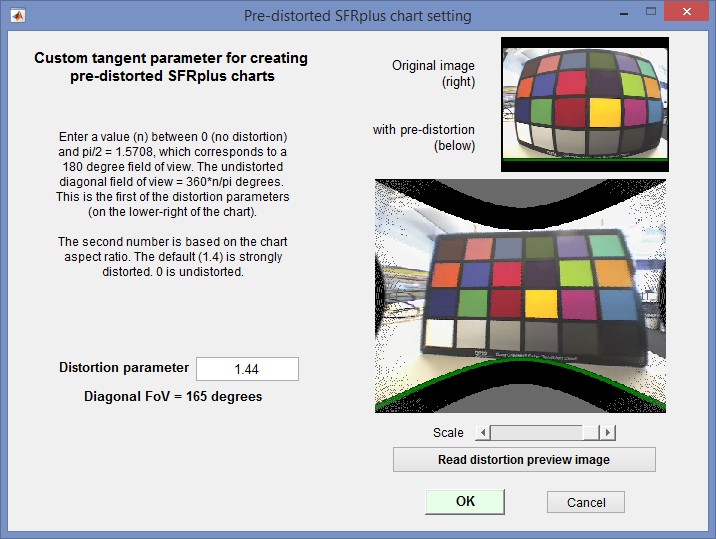 Pre-distorted chart setting window with distorted image preview
You can preview the effects of pre-distortion (for a SFRplus chart with bar-to-bar spacing approximately 96% of the vertical field of view) by reading in a distorted image of a subject (a scene) with recognizable straight lines. When the correct distortion parameter has been selected, the lines in the larger image on the right will appear straight, as shown above.