Imatest SFRreg performs highly automated measurements of sharpness (expressed as Spatial Frequency Response (SFR), also known as Modulation Transfer Function (MTF)) and Lateral Chromatic Aberration from images that contain registration mark patterns (circles with two light and two dark quadrants). Unlike standard test charts, these patterns do not need to be located on a flat (planar) surface. Since Region of Interest (ROI) detection is automatic, they may be positioned where needed. Depending on the image source, they offer several advantages. You can
|
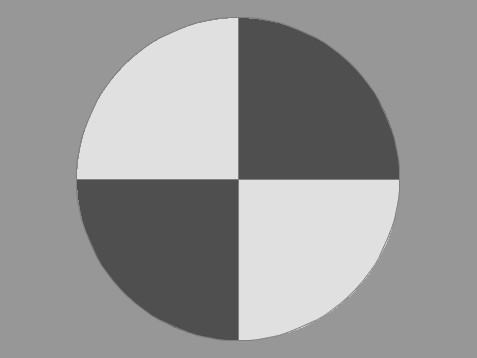 Registration mark Registration mark |
Registration mark charts, such as the one shown on the right, may be purchased from the Imatest store or printed on a high-quality inkjet printer.

Details of the regions to be analyzed are based on user-entered criteria (similar to SFRplus or eSFR ISO, which it closely resembles).
Sharpness is derived from light/dark slanted edges inside the registration marks, as described in Sharpness: What is it and how is it measured? SFRreg can handle a wide range of camera aspect ratios and chart arrangements.
SFRreg operates in two modes.
- Interactive/setup mode (run by pressing Rescharts in the Imatest main window, then selecting 10. SFRreg, pressing SFRreg Setup , or pressing the Interactive/Postprocessors dropdown menu, then selecting SFRreg setup), allows you to select settings and interactively examine results in detail. Saved settings are used for Auto Mode.
- Auto mode (run by pressing or by pressing the Fixed modules dropdown menu in the Imatest main window, then selecting SFRreg), runs automatically with no additional user input. ROIs are located automatically based on settings saved from the interactive/setup mode. This allows images of different sizes and framing to be analyzed with no change of settings. Auto mode works with large batches of files, and is especially useful for automated testing, where framing may vary from image to image.
This document introduces SFRreg and explains how to obtain and photograph the chart. Part 2 shows how to run eSFR ISO interactively inside Rescharts and how to save settings for automated runs. Part 3 and Part 4 illustrates the results for slanted-edge and other measurements, respectively.
SFRreg images from target projection systemImatest SFRreg is designed to work with images from long range target projector systems which consists of several projectors that project registration mark patterns towards a camera. These patterns appear at infinity focus at the camera. A typical image is shown below. |
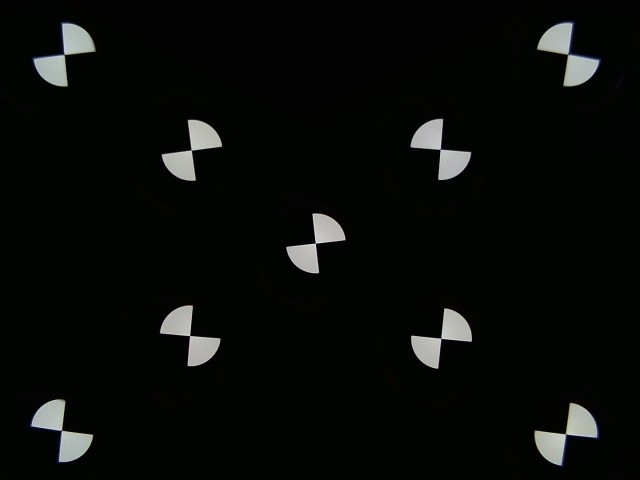 Image acquired from a 9-projector system
SFRreg images from arbitrary arrays of printed registration mark charts
SFRreg also works with printed registration mark patterns, which can be placed anywhere in the image. For extreme wide-angle (fisheye) lenses, they should be oriented facing directly towards the camera. You can add other charts— typically color or grayscale— to the image for additional measurements.
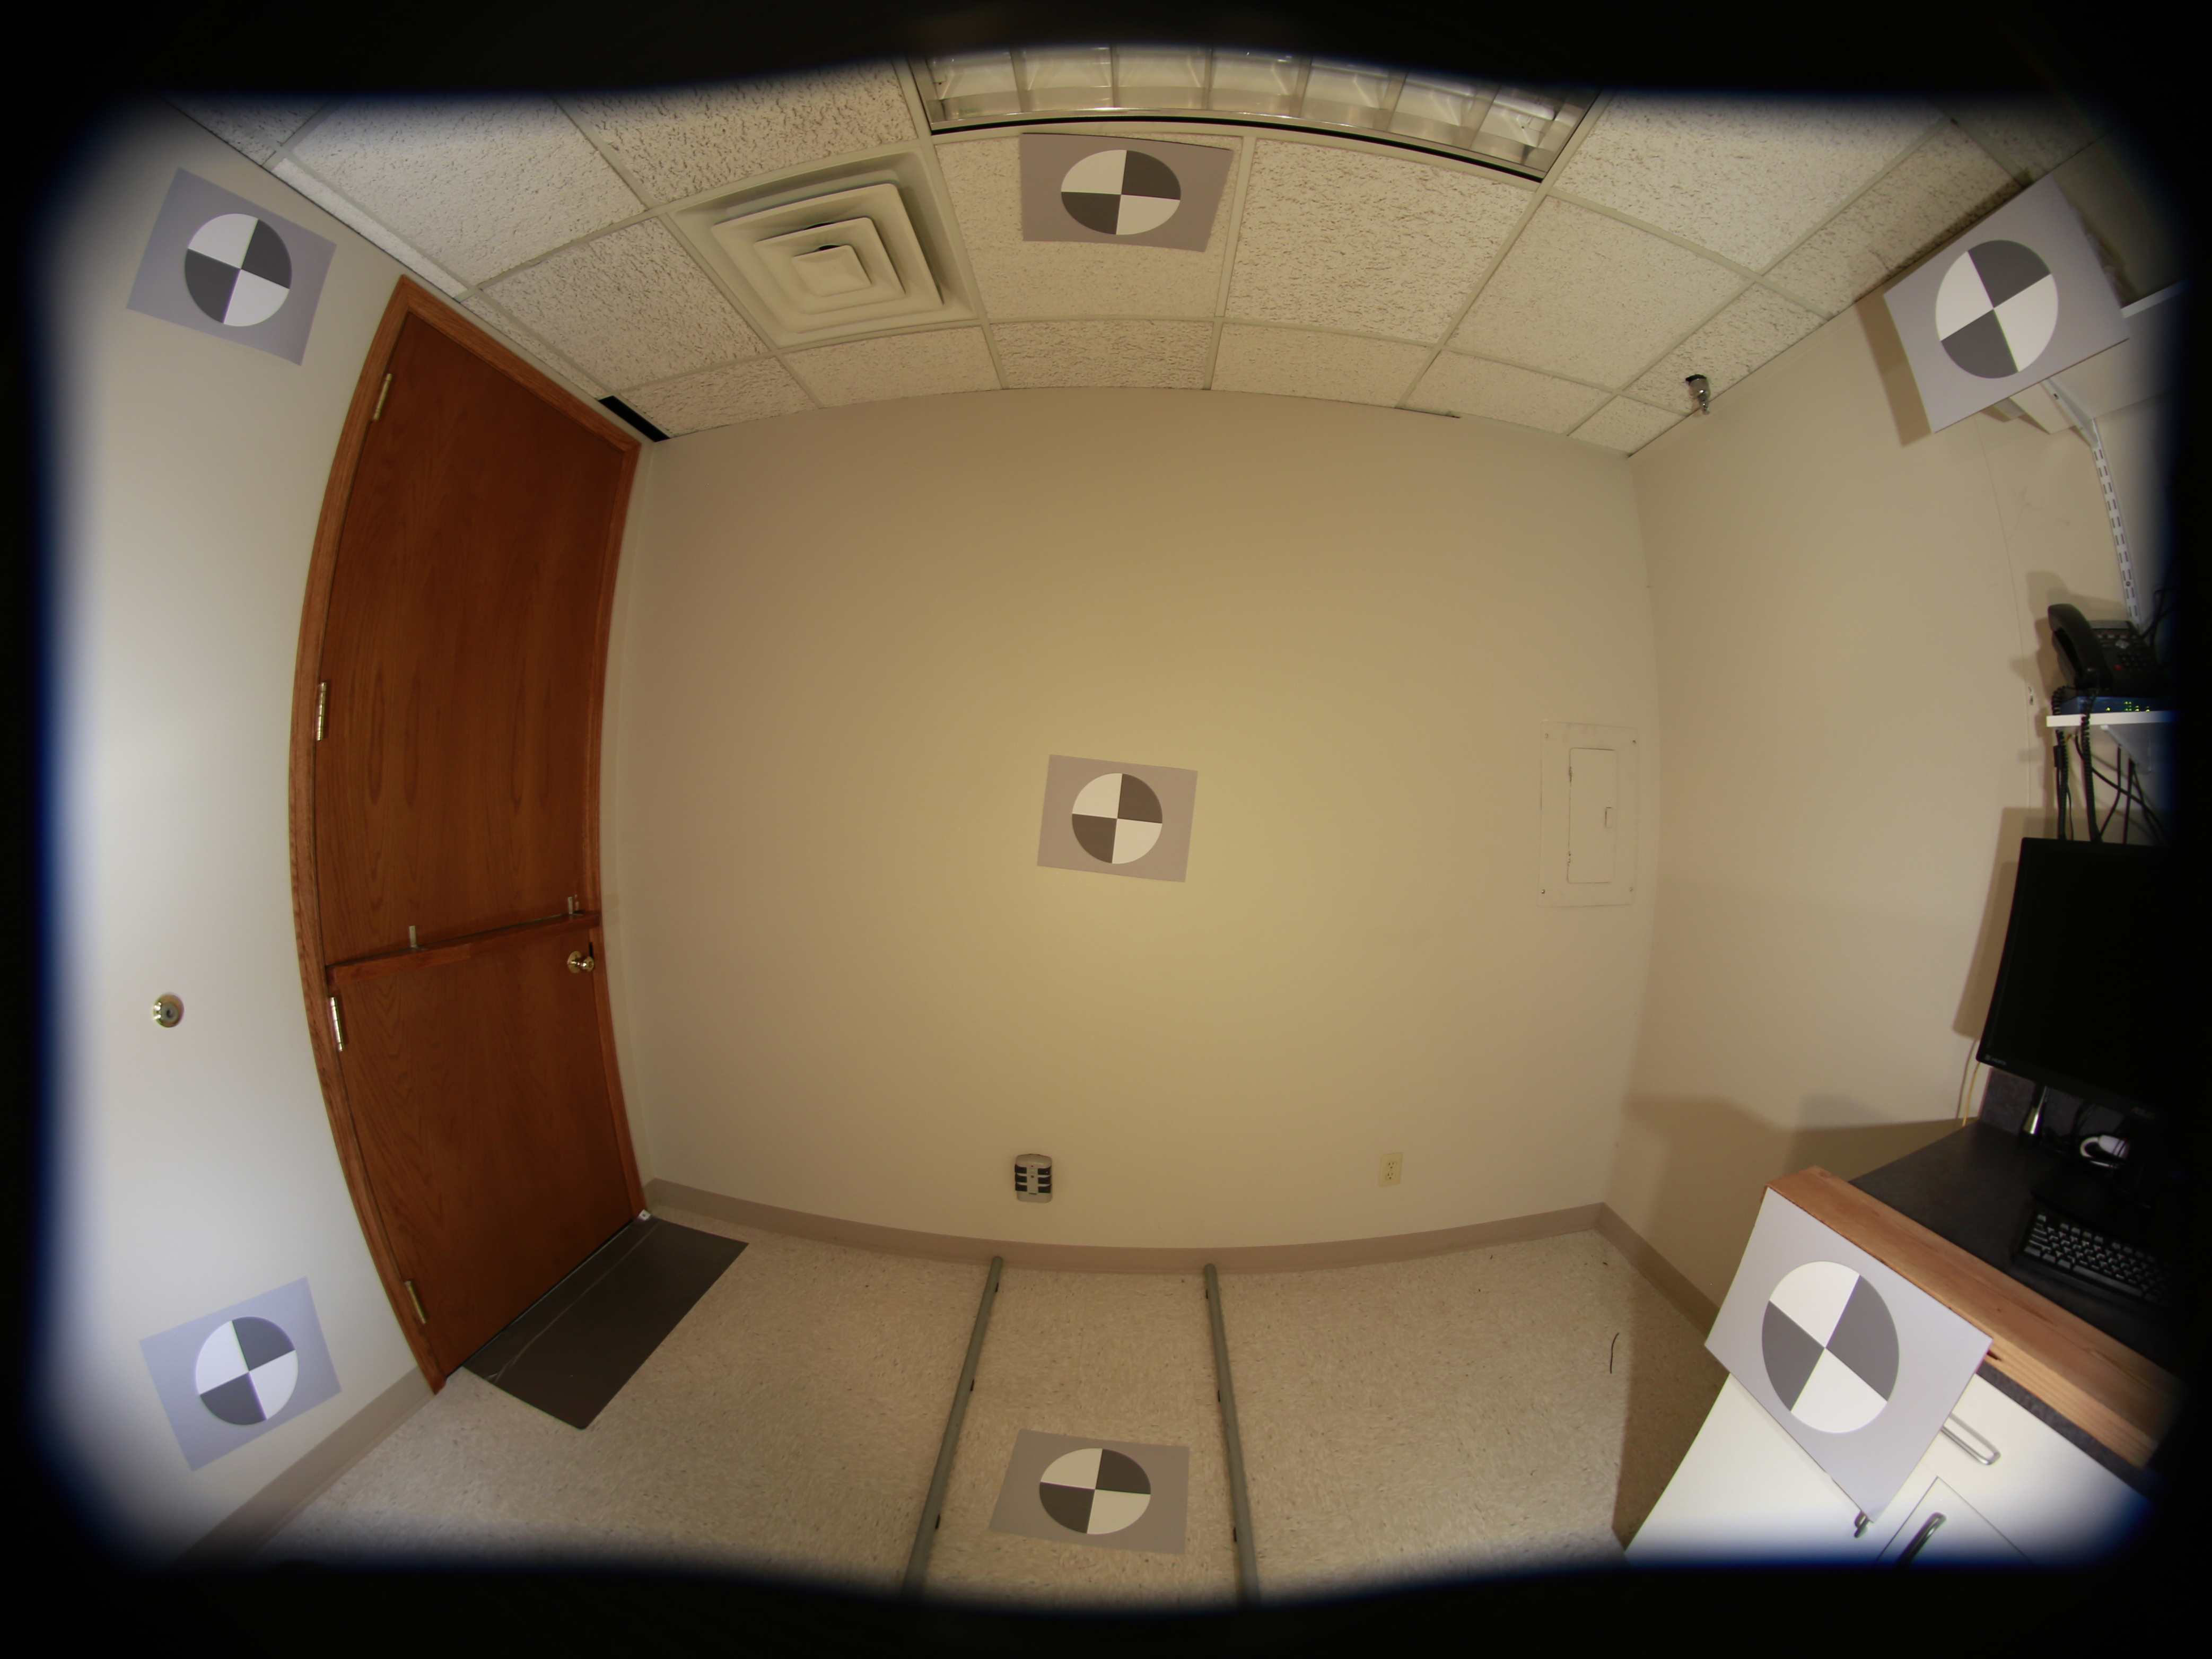
Fisheye lens image with registration mark charts oriented facing the camera
| Options | Notes | |
|---|---|---|
| Media | Inkjet (reflective), Inkjet (transmissive), LVT film (transmissive) |
Inkjet (reflective) is often the most practical choice, but lighting may be difficult for extreme fisheye lenses. Transmissive charts work well with low-cost light boxes. LVT charts are relatively expensive and may be finer than needed for most applications. |
| Contrast |
4:1, 10:1 |
4:1 contrast is specified in the new ISO 12233:2014 standard, 10:1 will work better in conditions where severe light falloff reduces signal level and degrades the repeatability of sharpness metrics. |
| Surface | Matte or semigloss | Semigloss is more susceptible to glare (specular reflections), especially with wide angle lenses. Matte is recommended for most applications, especially wide angle lenses or difficult lighting situations. |
| Shape | Circluar Elliptical (4:3 or 16:9) |
Circular charts are appropriate for most applications. Elliptical charts may work better near the outer borders of extreme fisheye lenses. |
The SFRreg Center chart
 Though the primary purpose of the SFRreg targets is to allow MTF measurements at arbitrary locations in the camera Field of View (FoV) (and at arbitrary distances, for maximum versatility), users may need a dense set of MTF measurements near the camera’s center of FoV as well as tonal response, noise, and color measurements. In order to to make this more convenient, we have developed the SFRreg Center chart (which is similar to the ISO 12233:2014 chart).
NOTE: This target does not automatically perform color. tone, noise, tilt, rotation, FoV or Distortion calculations in Imatest versions prior to 5.0. All but FoV and Distortion will be added in 5.0.
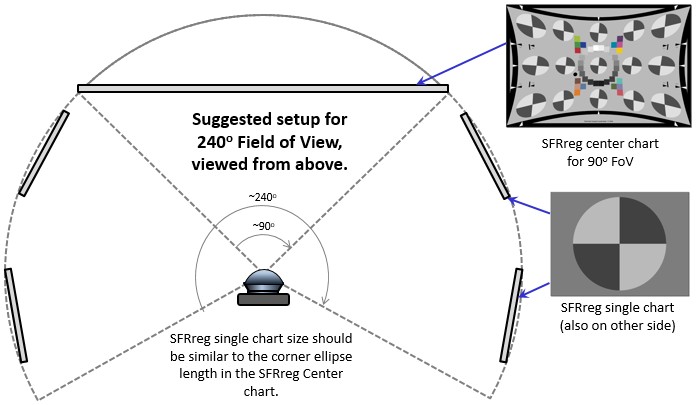
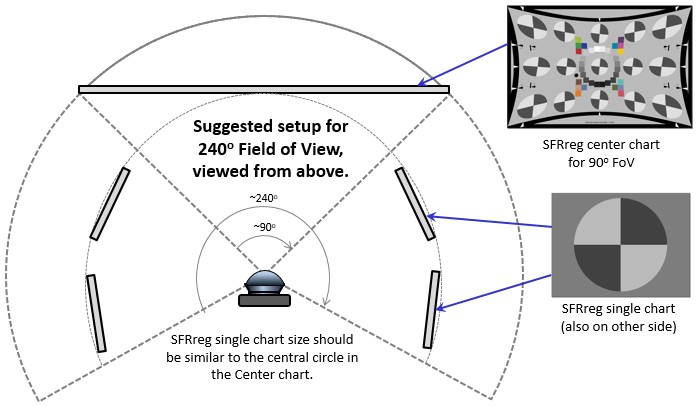
This chart can be placed in the central portion of the image, typically subtending 90 to 100 degrees horizontally (but other angles are available). The 90 degree chart is shown on the right. It is used along with single SFRreg charts located elsewhere in image, and typically facing the image (not in the center chart plane). Top views representing some potential arrangements (for a 240 degree camera FoV) are shown below. The charts on the sides typically represent two (or more) charts located in the corners (and possibly sides) of the camera’s field. These are merely suggestions: other arrangements may work better, depending on the angular field of view and camera’s pixel resolution. For example, for smaller angular FoVs, it might be sufficient to have only one set of added charts (at each of the 4 corners).
 |
 |
| The SFRreg single chart circles should have circle diameters approximately equal to the outer ellipses in the Center Chart. |
The SFRreg single chart circles should have circle diameters approximately equal to the inner circle in the Center Chart. |
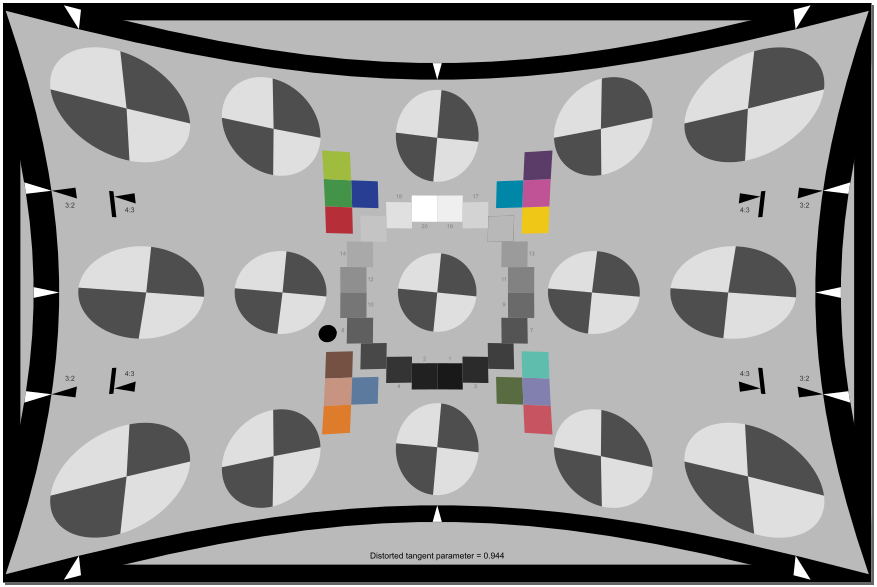
When either of these arrangements are photographed with a fisheye camera with the expected Field of View, the resulting image looks something like this.
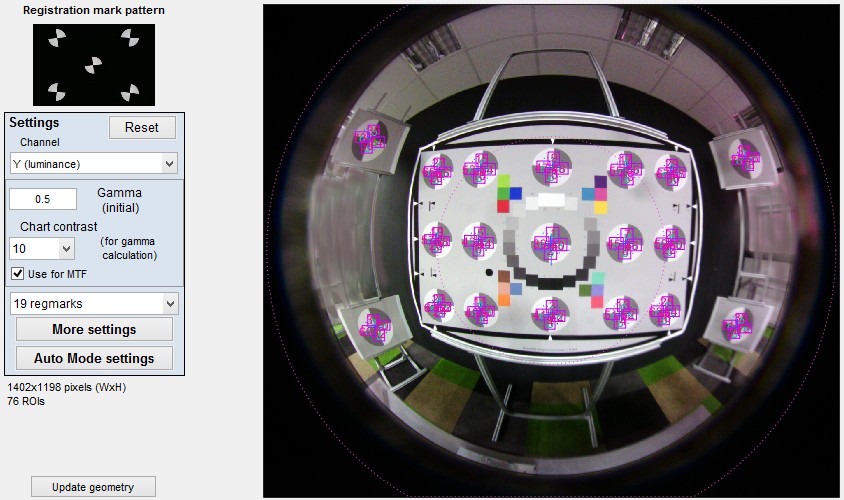 A portion of the SFRreg setup window for an image with an SFRreg center chart and four individual charts.
Field of View is approximately 180 degrees. 19 registration marks have been selected.
Tips for ensuring auto-detection and accurate measurements
When using the SFRreg Center Chart, take care to photograph it with the same recommendations as for other resolution-determining test charts. This involves lighting the chart evenly, choosing the correct size and distance, and ensuring reasonable exposure.
Similarly, any single SFRreg targets should be placed at least at a great enough distance away from the camera so that their printing resolution is not a factor. Due to the ability to place SFRreg targets anywhere in a scene, it is not possible to recommend a typical lighting set-up. While even lighting on a target is important to have for both slanted edge analysis and automatic detection of SFRreg targets, it may not always be possible to achieve.
The SFRreg marks should be positioned to avoid pure horizontal, vertical, or 45 degree edges. Typical edges are 2-7 degrees off of horizontal or vertical, though other orientations like sagittal/meridional edges are acceptable.
The following guidelines should be followed as closely as possible for the automatic detection routines to work correctly:
- Light each registration mark as evenly as possible.
- Avoid glare (shiny specular reflections). Matte printing helps in this regard.
- For fisheye (highly barrel-distorted) lenses, the targets should face the camera. (A pre-distorted elliptical SFRreg target may also be desired in such cases, in order to aid detection and maximize the area available for slanted-edge MTF analysis.)
- Care should be taken to avoid interfering patterns that could be mistaken for registration marks.
- The registration marks should have reasonable contrast in the image (regardless of what the printed contrast was) in order to be detected. This means having the difference of the light and dark areas of the marks be at least ~20% of the possible dynamic range of the image.
- The registration marks should be large enough in the image to detect, with diameter at least ~4% of the image height.
- The image can be cropped to remove interfering features near the edges, using the Crop borders button in the SFRreg setup window.
Obtaining the Charts
Registration Mark charts can be purchased from the Imatest store in a variety of inkjet media (reflective and transmissive) (Other media will be available on request.)
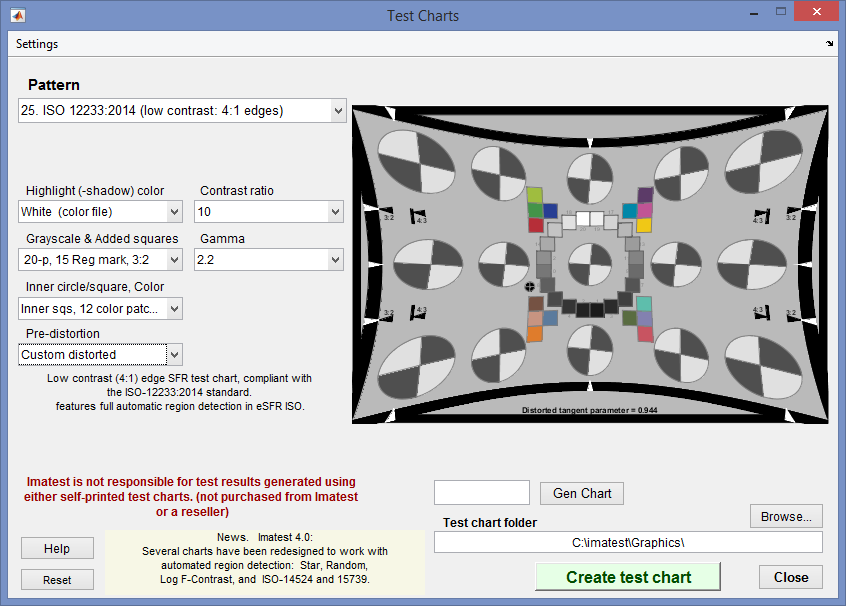
Although we recommend that you purchase the charts, they can be printed on photographic-quality inkjet printers, but you must have fine materials, skill, and a knowledge of color management. For more details, go to SVG Charts. Here are the recommended settings.
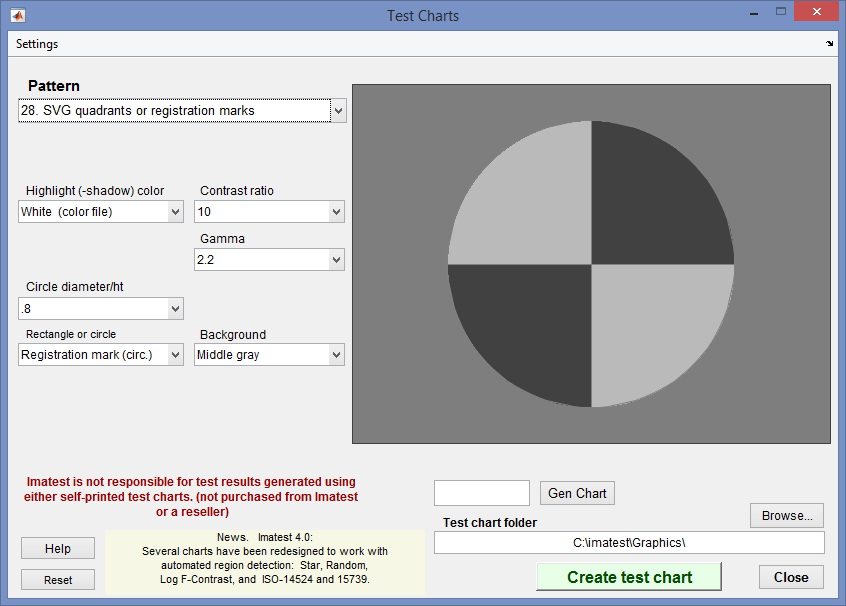 Typical settings for printing SFRreg registration mark patterns
- Circle diameter/height should be 0.9 or less. If it's set to 1 (causing the circle to go to the edge of the chart) detection may fail.
- We recommend a contrast ratio of 10 for typical (busy) environments. This is usually sufficient to avoid saturation (though a contrast ratio of 4 is recommended if the environment is relatively free from interfering features that affect detection).
- Elliptical versions are available for unusual cases that deviate from standard fisheye distortion. This often happens for Fields of View greater than 180 degrees.
 Typical settings for SFRreg Center chart (for 90 degree horizontal angle)
Charts can be mounted on sheets of 1/2 inch (12.5 mm) thick foam board with a spray adhesive (such as 3MTM 77 or Photo Mount) or double-sided tape (such as 3MTM #568 Positionable Mounting Adhesive). 1/2 inch foam board stays flatter than standard 1/4 or 3/8 inch foam board. PVC board is also very promising: it may be more durable and it comes in a variety of sizes.
Links
How to Read MTF Curves by H. H. Nasse of Carl Zeiss. Excellent, thorough introduction. 33 pages long; requires patience. Has a lot of detail on the MTF curves similar to the Lens-style MTF curve. Even more detail in Part II. Their (optical) MTF Tester K8 is of some interest.
Understanding MTF from Luminous Landscape.com has a much shorter introduction.
Understanding image sharpness and MTF A multi-part series by the author of Imatest, mostly written prior to Imatest's founding. Moderately technical.
Slanted-Edge MTF for Digital Camera and Scanner Analysis by Peter D. Burns (2000) (alternate source). An excellent introduction to the ISO 12233 slanted-edge measurement. Closely related: Diagnostics for Digital Capture using MTF by Don Williams and Peter D. Burns (2001), Applying and Extending ISO/TC42 Digital Camera Resolution Standards to Mobile Imaging Products by Don Williams and Peter D. Burns (2007) (Contains an image of an early version of the low-contrast slanted-edge test chart proposed for the revised ISO 12233 standard.)
Bob Atkins has an excellent introduction to MTF and SQF. SQF (subjective quality factor) is a measure of perceived print sharpness that incorporates the contrast sensitivity function (CSF) of the human eye. It will be added to Imatest Master in late October 2006.
How to Measure MTF and other Properties of Lenses by Optikos.