Imatest lets you use the measured test chart modulation transfer function (MTF) to
- Determine the suitability of a test chart, which is characterized by size (height), print media, and printing technology, for camera MTF measurements where the camera is characterized by the number of vertical pixels. This can help determine whether a test chart is appropriate for a specific application.
- Increase the accuracy of MTF measurements by dividing the measured camera MTF by the chart MTF projected on the image sensor. This is equivalent to deconvolution in spatial domain. This technique is described in Compensating camera MTF measurements for chart and sensor MTF. It improves the accuracy and consistency of camera MTF measurements made with a variety of test charts and also lets you view the precise effect of chart MTF on camera MTF measurements.
|
Related pages: Compensating camera MTF measurements for chart and sensor MTF – Introduction – Calculation – MTF compensation files – Applying the compensation – Lens MTF measurements Test chart suitability for MTF measurements – shows chart MTF suitability displays for several common media types. You can use these displays to predict test chart suitability without running Imatest. |
The Chart Quality Calculator, introduced on this page, lets you estimate the effect of chart MTF on camera MTF measurements for a wide range of:
- Chart media and printing technologies (inkjet on reflective and transmissive media, photographic film, and prints, etc.).
- Cameras, primarily characterized by pixel height (and hence total megapixel count).
- Vertical fields of view (often related to chart size).
You can determine how large a chart (for media characterized by Chart MTF in cycles/object mm) is needed for a camera with a given number of vertical pixels (or total megapixels), with or without chart MTF compensation. You don’t need chart images to use it.
Using the Chart Quality Calculator correctly requires a clear understanding of key concepts: measured chart MTF and chart MTF projected on the image sensor.
|
Quick summary of the Chart Quality Calculator
|
Chart MTF
Chart MTF is measured using printed slanted edges of reasonable contrast (typically 4:1 or 10:1) with the technique described in the appendix of the Compensating camera MTF measurements page. The spatial frequency unit for chart MTF is cycles/object mm; i.e., cycles per millimeter on the chart (not on the sensor, as is typical of most Imatest measurements). Here are a few details about the measurement:
- Magnification should be large enough (typically around 0.5x for inkjet charts and 1x for photographic charts) so the measurement is dominated by the chart quality, not by the lens, sensor, or signal processing. (Typical camera MTF measurements have magnifications of < 0.1 for high quality film charts and < 0.02 for inkjet charts.) Magnification should be carefully measured and recorded.
- The measured chart MTF is fit to a function that closely approximates actual response curves at frequencies where MTF > 0.3 (below MTF30). This function removes irregularities in the MTF curve caused by noise (typically at frequencies above MTF30) and facilitates further processing.
The function is
\(\displaystyle MTF_{chart}(f) = e^{-a_1 f – (a_2 f)^2}\)
where f is in units of Cycles/Object mm (C/Obj mm). This function matches a wide range of observed chart MTF measurements.
Projected Chart MTF
When the chart is projected (imaged) on the sensor, its spatial frequency units must be transformed to the native units of the sensor (Cycles/Pixel [C/P]) by substituting
\(f(\text{C/Obj mm}) = f(C/P) \times \text{magnification} \times \text{pixels/mm}\)–
\(MTF_{chart-projected} (f) = MTF_{chart}(f(C/P) \times \text{magnification} \times \text{pixels/mm}) = MTF_{div}(f)\)
In Imatest sharpness modules, pixels/mm is typically derived from the user-entered value of pixel pitch (in μm), where pixels/mm = 1000 / (pixel pitch (μm)). Magnification is either entered in the settings window or derived from geometrical factors like the bar-to-bar spacing in SFRplus or the vertical registration mark spacing in eSFR ISO.
If MTFdiv(fNyq) (MTFdiv at the Nyquist frequency (fNyq = 0.5 C/P)) is lower than 0.9 (90%), measurement accuracy can be improved by dividing the measured MTF by MTFdiv, as described in Compensating camera MTF measurements for chart and sensor MTF. If MTFdiv(fNyq) is greater than 0.9, MTF compensation offers little improvement.
Note that for rectilinear images (not strongly barrel distorted; i.e., not fisheye)
\(\text{magnification} = \text{sensor height} / \text{Vertical FoV}\)
and
\(\text{pixels/mm} = \text{Vertical pixels} / \text{sensor height}\)
Therefore we can say
\(f(\text{C/Obj mm}) = f(C/P) \times \text{Vertical pixels} / \text{Vertical FoV}\)
This formulation is used in the Chart Suitability display, described below.
Fisheye (strongly barrel-distorted) lenses present a problem because radial magnification decreases with distance from the image center. To use the Chart Suitability display, we have to create a sort of “virtual Vertical FoV” based on magnification at the center. Fortunately this isn’t too difficult because fisheye lenses are rarely used for extreme closeup images (except in medical endoscopes). In most cases the lens-to-chart distance dlens-chart >> lens focal length f, and hence we can use magnification = f / dlens-chart = Vertical FoV/sensor height. If necessary, magnification near the image center (which is the worst case) can be found by photographing a fine ruler.
\(\text{virtual Vertical Field of View} = VVFoV = \text{magnification} \times \text{sensor height}\)
VVFoV can be significantly larger than the actual physical FoV.
Chart Quality Calculator
The Chart Quality Calculator is opened from the Utilities drop-down menu in the Imatest main window. This window lets you read in a chart quality (MTF compensation) file, which contains the measured coefficients for a specific media and print technique, and then select parameters that determine:
- Megapixel suitability (the largest number of camera Megapixels) that can achieve a given quality level for a chart of a specified size
- How chart quality affects MTF measurements for a specific system, defined by parameters that include pixel pitch in microns (μm) per pixel, magnification, sensor height, and Vertical Field of View (which is closely related to chart height). When one of these parameters changes, one or more of the others is changed for consistency according to rules in the following table.
| Setting | Changes | Affects | Description |
| Vertical Field of View mm. | magnification | Megapixel suitability MTF div plot |
Vertical Field of View (FoV) is closely related to chart height, especially for charts designed to fill the FoV (SFRplus, eSFR ISO, etc.). This is the only one of the four input settings that affects the Megapixel suitability table. [magnification = sensor height/Vertical FoV] |
| um per pixel | none of the other input settings | MTF div plot and MTFnn | Pixel pitch, usually entered as microns (μm) per pixel. Converted to pixels/mm in the above equations. |
| magnification | sensor height mm | MTF div plot | Magnification must be measured carefully when an image is taken. For some modules (SFRplus, eSFR ISO, Checkerboard) magnification can be derived from geometrical chart features. [Sensor height = magnification * Vertical FoV] |
| Sensor height mm. | magnification | MTF div plot | Sensor height in mm. [magnification = sensor height/Vertical FoV] |
|
Notes: MTFnn is the spatial frequency in Cycles/Pixel (on the image sensor) where MTF drops to nn% of the low frequency value Typical values of interest are MTFnn = 90, 70, 50, and 30. Megapixel suitability is the maximum camera megapixels that the chart can reach at the specified quality level (MTF at the Nyquist frequency), typically for either a 4:3 or 3:2 aspect ratio. It is a function of the MTF chart compensation file (which can be downloaded from www.imatest.com/docs/mtf-compensation/#compfiles). and Vertical field in mm. (It’s not affected by the other inputs.) The two key parameters that determine chart suitability are:
|
|||
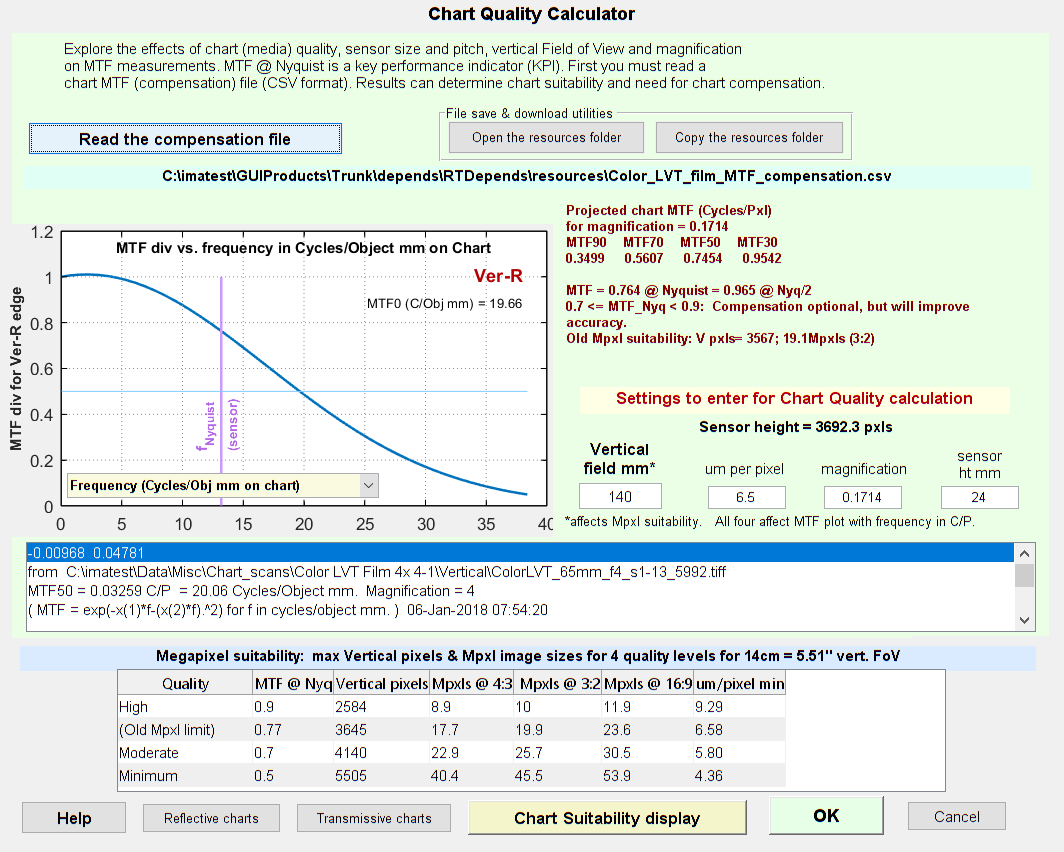 Chart Quality Calculator window
Settings for a 5 x 7 Multi-size Color LVT SFRplus chart where the largest chart image has
a bar-to-bar spacing of 128 mm, corresponding to a vertical FoV of 140mm = 5.51″.
Key Results
The following table is based on experience using chart compensation, where the key metric that determines chart quality is the projected chart MTF on the image sensor at the Nyquist frequency, fNyq.
| MTF @ fNyq | Quality | Description | CQI |
| MTFNyq ≥ 0.90 | Excellent | Chart compensation is not needed. | CQI90 |
| 0.70 ≤ MTFNyq < 0.90 | Good | Chart compensation is recommended but optional. It improves accuracy. | CQI70 |
| 0.50 ≤ MTFNyq < 0.70 | Comp. required | Chart compensation is required for accurate results. | CQI50 |
| 0.30 ≤ MTFNyq < 0.50 | Minimal | Will work with chart compensation, but this is stretching things. Not recommended. | |
| MTFNyq < 0.30 | Not usable | Don’t even think of it! MTF is too low for reliable results (it’s too sensitive to noise), even with compensation. |
Chart MTF Suitability Display
This display is recommended for determining the suitability of a chart for a given camera system. It is based on the concept that only three items (one file and two parameters) are needed to determine chart suitability:
- Chart compensation file, which contains a model of the chart MTF for a specific print technology (inkjet, photo paper, photo film, etc.).
- Vertical field of view (VFoV of the object, i.e., test chart).
- Vertical pixel count of the sensor (Vpix).
- If you have the chart compensation file and know VFoV and Vpix, you can easily determine chart suitability from the Chart Suitablity display. All other parameters, such as angular field of view, lens-to-chart distance, sensor height, and pixel pitch, are only used to calculate items 2 and 3.
Note that this approach only works for rectilinear (low-barrel distortion) images. It has to be modified for highly barrel-distorted (fisheye) lenses. Horizontal may be substituted for Vertical as long as consistency is maintained.
To use this display, read the chart compensation file, then press Chart MTF suitability display at the bottom of the Chart quality calculator window. The box near the top with descriptions of the media is for annotation only. The aspect ratio, used for the megapixel scale on the right y-axis, can be set to 4:3, 3:2, or 16:9 in the small drop-down menu on the right.
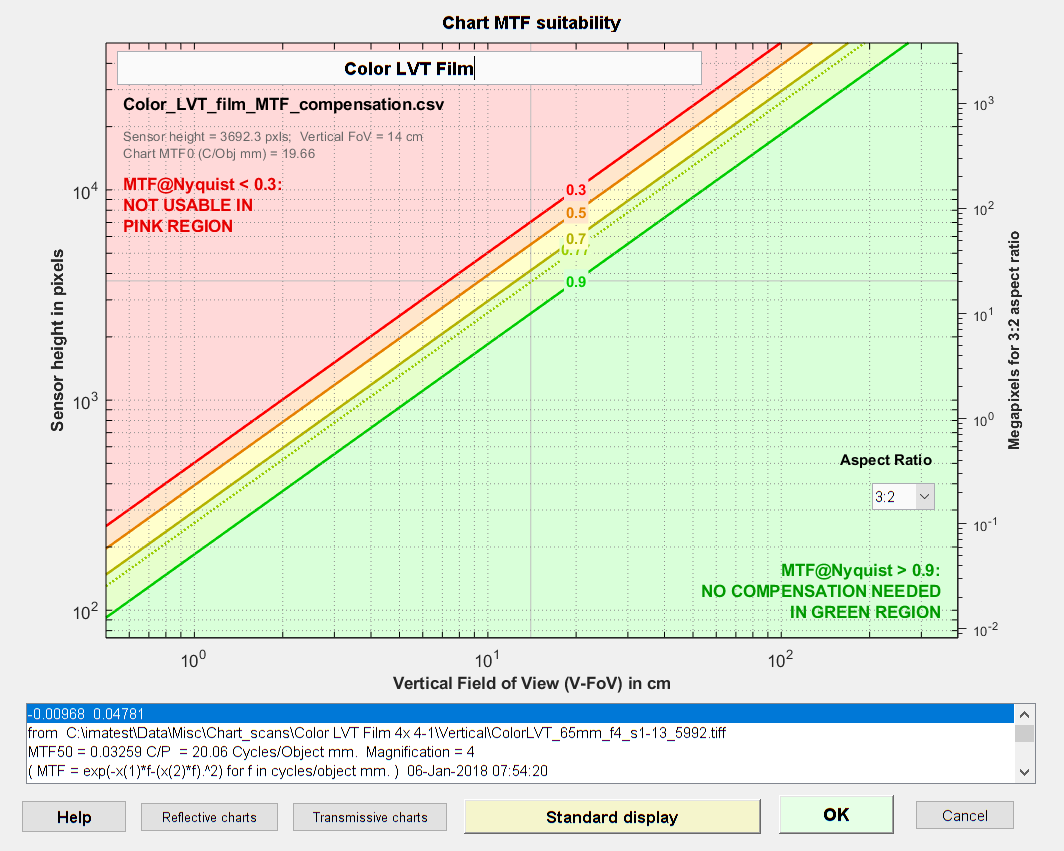 Chart MTF Suitability display. Diagonal lines represent MTF@fNyq
(The Matlab exponential notation is not my favorite: 100 = 1; 101 = 10; 102 = 100, etc.)
The Vertical Field of View (V-FoV) in centimeters is shown on the x-axis. It is typically slightly larger than the height of charts designed to fill the frame (SFRplus, Checkerboard, and eSFR ISO). Note that single-region resolution charts (Spilled Coins, Siemens Star, and Log F-Contrast) are not designed to fill the frame in high resolution cameras—they should occupy no more than about 2000 vertical pixels. V-FoV is usually larger than the chart height.
The Vertical pixel count, shown on the left y-axis, can be determined from the image itself.
Example—The standard 5 x 9 color LVT SFRplus chart, printed on 8- × 10-inch film, is designed to have a 13 cm vertical Field of View. 13 cm (on the x-axis) corresponds to MTF@Nyquist = 0.9 (the green diagonal line, below) for sensor height = 2400 pixels (left y-axis) or about 8 Megapixels at 3:2 aspect ratio (right y-axis). At this high quality level, MTF compensation is not required. If we push the chart to MTF@Nyquist = 0.7 (the olive diagonal line), which is still reasonably good, but requires MTF compensation, we reach sensor height = 4000 pixels (about 20 megapixels at 3:2 aspect ratio).
The colors on the display correspond to the colors on the Quality table (above); i.e., green (lower-right) is excellent; yellow requires MTF compensation, pink (upper-left) is unusable, etc.
| Chart MTF suitability displays for several common media types are shown in Test chart suitability for MTF measurements. You can use these displays to predict test chart suitability without running Imatest. |
General Megapixel Suitability (older approach)
The Chart Suitability display (above), introduced in Imatest 5.2, is now recommended for determining the suitability of a chart for a given camera system.
These results, which are in the table titled Megapixel suitability near the bottom of the initial window, indicate:
- The maximum number of vertical pixels and total Megapixels that can achieve a specific quality level (derived from MTF at the Nyquist frequency) for a chart with the selected medium and vertical field of view.
- How large a chart needs to be to achieve a specified quality level for a camera with a known number of vertical pixels.
Neither of these results are affected by entries for pixel size (μm per pixel), magnification, or sensor height.
![]() Megapixel suitability table for four quality levels at a specific vertical field height.
Megapixel suitability table for four quality levels at a specific vertical field height.
The table displays a number of results based on MTF at the Nqyuist frequency (MTF @ fNyq). Measurements (maximum vertical pixels and camera megapixel sizes for three aspect ratios (4:3, 3:2, and 16:9) and Quality levels (MTF @ fNyq = 90, 77, 70, and 50) are described in the two tables below. MTF @ Nyquist = 0.77 is a special case, approximating the MTF suitability calculation used prior to 2018. This number has proven to be a reasonably conservative estimate of MTF suitability without chart compensation.
MTF @ fNyq determines the effect of chat quality on MTF measurements and whether chart compensation is needed.
| Measurement | Description |
| Quality | High, (Old Mpxl limit), Moderate, Minimum. There correspond to a minimum MTF at the Nyquist frequency (fNyq) for image of the chart on the sensor. |
| MTF @ Nyq | The minimum value of MTF @ fNyq for the image of the chart on the sensor. corresponding to the indicated quality levels: 0.9, 0.77, 0.7, and 0.5. |
| Vertical pixels | The maximum number of vertical pixels that can achieve the indicated quality level (MTF @ fNyq). This is the same number as the older Chart Quality Index. |
| V-pxls/cm (deprecated) |
The maximum number of vertical pixels per centimeter of chart height that can achieve the indicated quality level. For a camera with n vertical pixels, the minimum chart size in cm is n/(V-pxls/cm) for the quality level indicated by the row. V-pixels/cm = 20*MTFnn(cycles/object mm) = 2*MTFnn(cycles/object cm) (for nn = 90, 70, 50, etc.). |
| Mpxls @ 4:3 | The number of megapixels corresponding to Vertical pixels (above) for a 4:3 aspect ratio. |
| Mpxls @ 3:2 | The number of megapixels corresponding to Vertical pixels (above) for a 3:2 aspect ratio. |
| Mpxls @ 16:9 | The number of megapixels corresponding to Vertical pixels (above) for a 16:9 aspect ratio. |
| um/pixel min | The minimum pixel size (in microns) that can achieve the indicated quality level (MTF @ fNyq). |
| Key results are shown with a yellow background. | |
Examples:
-
- Vertical pixels (2484 for High quality)—For this system, which uses an LVT color film chart with Vertical Field of View = 140mm (5.51 inches), the maximum number of vertical pixels where MTF @ fNyq ≥ 0.9 (so that no MTF compensation is needed) is 2584 (equivalent to 10 Megapixels for a 3:2 aspect ratio).
- Chart Quality Index (CQInn)—Used prior to Imatest 5.1; is the number of vertical pixels where MTF @ Nyquist = nn% (typical values are 90, 70, and 50%). It is the same number as the Vertical pixels column in the above table.
\( CQI_{nn} = 2 \times \text{test chart MTFnn (cycles/object mm)} \times \text{height in mm}\) where height is the typical vertical field of view for SFRplus (1.1 * the bar-to-bar distance) or the vertical crop height of the chart active area for most other test charts. Cycles/object mm is defined on the chart. CQI90 was the standard value for high quality images. We no longer use CQI because the description on the web page is difficult to follow and the name is not very descriptive.
-
- The old (pre-2018) Megapixel suitability number, which was defined as
\( \text{Megapixel suitability} = 2 \times (0.5(\text{MTF50}) + 0.35(\text{MTF70}) + 0.15(\text{MTF50}))\times \text{vertical chart height (mm)} \) where MTFnn has units of Cycles/Object mm. This number appears above the Settings boxes in the Chart Quality Calculator. In the above image, it is
Old Mpxl suitability: V pxls= 3567; 19.1Mpxls (3:2) (abbreviated because of limited space).
The old Megapixel suitability is 3567 vertical pixels = 19.1 Megapixels for a 3:2 aspect ratio. This is very close to the values for Quality level (old Mpxl limit) (MTF @ Nyquist frequency = 0.77) = 3645 vertical pixels = 17.7 Mpxls (at 3:2 aspect ratio). This is a fairly conservative estimate of the chart limit, where MTF compensation will only make a small improvement.
Results for a Specific Imaging System
When the Chart Quality Calculator is opened, chart MTF is displayed in frequency units of cycles per object mm on the chart (shown above). This is for the chart itself (independent of the imaging system), except for the vertical Nyquist frequency line, which is calculated relative to the sensor.
The Chart Quality Calculator can also display results for an imaging system characterized by pixel size (μm per pixel), magnification, and sensor height in mm.
By clicking on the frequency toggle button at the bottom-left of the plot (which originally displays Frequency (Cycles/Obj mm on the chart) , the display can be changed to Cycles/Pixel on the sensor, shown on the right. This plot directly indicates the effect of the chart on MTF at spatial frequencies on the sensor. As we indicated above, MTF at the Nyquist frequency (fNyq = 0.5 C/P) and also the half Nyquist frequency (0.25 C/P, which is in the neighborhood of MTF50 for typical sharp imaging systems) are good indicators for the chart quality for this system.
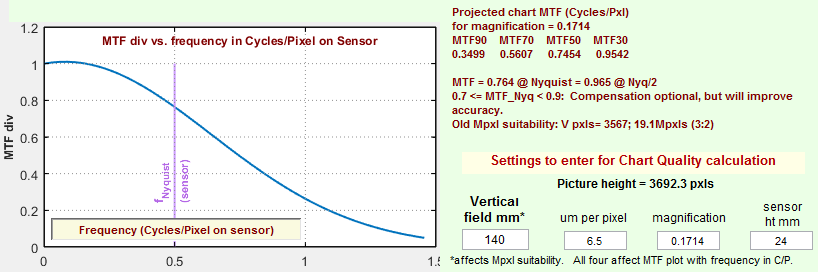 Results for a specific system with frequency in C/P on the image sensor
Results for the system, which is defined by the pixel size (μm per pixel), magnification, and sensor height in mm (entered on the lower-right), are displayed in maroon to the right of the MTF plot. MTF = 0.746 @ Nyquist = 0.965 @ Nyq/2 indicate that the chart is good enough to be used without MTF compensation in this system, though MTF compensation is recommended for more accurate results.
Limitations
Measurements are not reliable where the projected chart MTF is lower than 0.3. The frequency where this happens (MTF30) should always be above the Nyquist frequency fNyq, and If possible it should be above 2× fNyq.
Measurement accuracy near the boundaries of strongly barrel-distorted (fisheye) lenses is affected by reduced magnification in the radial direction, which affects the sharpness of tangential edges. We described ways of dealing with this in the Fisheye section, above. This is not an issue with moderately distorted rectilinear (normal) lenses.