Deprecated in Current Release
|
The Chart Quality Index measurement has been deprecated because Imatest’s improved capabilities for measuring and correcting MTF degradation caused by test charts are far easier to understand and apply. Compensating camera MTF measurements for chart and sensor MTF The Chart Finder is an interactive web page that can help you select the appropriate chart size and media. It contains results from this page, but without the math. |
Summary
In order to determine the suitability of a test chart is for measuring the performance of a given camera, i.e., to answer the question of how much a chart’s (imperfect) sharpness degrades camera and lens sharpness measurements, Imatest has developed an objective measurement (now deprecated; no longer recommended) called the Chart Quality Index (CQI).
CQI is based on the idea that a reliable measurement is best made when the image of the test chart (on the image sensor) has an MTF that is much better than the system under test.
The CQI measurement is based on the MTF of the chart image at the image sensor’s Nyquist frequency (\(F_{Nyq} = \frac{1}{2 times text{pixel pitch}}\)), which is above the frequency range of greatest interest for most digital cameras. When the chart MTF at FNyq is greater than 90% (for high quality* cameras; lower (70% or 50%) for lower quality cameras or measurements), the impact of the chart on measured camera/lens sharpness will be within acceptable limits.
| Chart Quality Index (CQInn) is the maximum number of vertical pixels (for the entire image sensor for charts designed to fill the frame (SFRplus, ISO-12233, etc.) or the image height for charts designed to fill only a part of the frame (Spilled Coins, Log Frequency-Contrast, Siemens Star, etc.)) that results in a chart image MTF ≥ nn% at the Nyquist frequency (fNyq = 0.5 C/P). For an appropriate choice on MTF level, typically 90% for high quality cameras, the chart will produce acceptable measurements when the number of vertical pixels is less than or equal to CQInn. |
The defining equation is
| \( CQI_{nn} = 2 times text{test chart MTFnn (cycles/object mm)} times text{height in mm}\)
where height is the typical vertical field of view for SFRplus (1.1 * the bar-to-bar distance) or the vertical crop height of the chart active area for most other test charts. Cycles/object mm is defined on the chart. nn is the MTF (percentage) used to define CQI. If omitted, 90% is assumed. CQInn is equivalent to Vertical pixels in the Chart Quality Calculator Megapixel suitability table. |
*We define “high quality” here to mean cameras that have good enough lenses to make effective use of the sensor pixels, i.e., MTF50 ≥ 0.2 Cycles/Pixel without excessive sharpening. This doesn’t necessarily mean expensive DSLRs. Some of the better camera phones do quite well in this respect.
Introduction
The Imatest Chart Quality Index (CQI) was developed to answer questions like, “How large a chart do I need to reliably test my camera’s sharpness?” and “How much does the chart degrade the measured MTF?” Or for a specific case, “Will a 24×40 inch matte (inkjet) chart be adequate for measuring the quality of my 16-megapixel (4592×3448 pixels) Panasonic Lumix DMC-G3?”
The key concept behind the CQI is that when camera test results should reflect the performance of the camera, with minimal degradation from test chart.
To introduce the concept, let’s look at a camera measurement made from a 5×7 (grid of squares) SFRplus chart on 8×10 inch color photographic film. The bar-to-bar distance is 153 mm, for a vertical image field (about 1.1 times the bar-to-bar distance) of 169 mm. Note that MTF is displayed in units of cycles/mm, which is not usually recommended for measuring camera MTF, but is necessary for measuring chart MTF. Maximum plot frequency in the figure below is twice the Nyquist frequency.
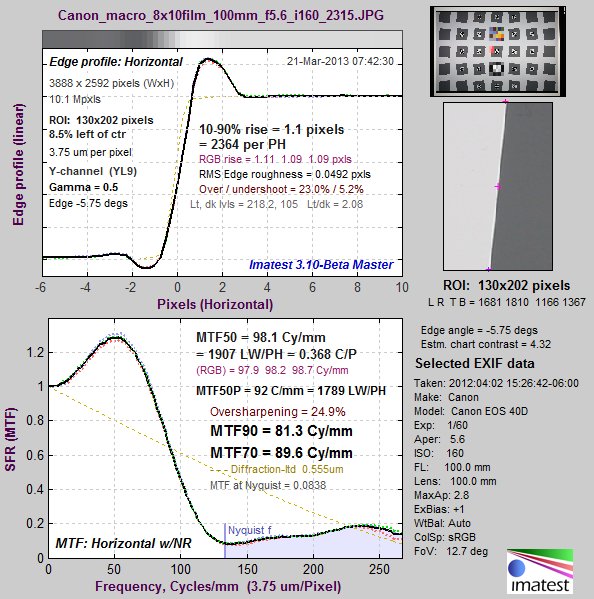 MTF of Panasonic DMC-G3/Leica 45mm f/2.8 macro lens, camera-JPEG taken with
the 8×10 SFRplus film chart.
This is a typical result for a strongly-sharpened high quality camera. We would like to answer the question, “Given the relatively small chart size, is this measurement truly representative of the camera + lens performance?
Now let’s look at a measurement of the chart, taken with the same camera and lens at 1:1 magnification. (This setting is intended to minimize the effects of camera and lens MTF— the exact opposite of the usual goal.) Note that the maximum plot frequency is only half the Nyquist frequency (1/4 that of the above plot).
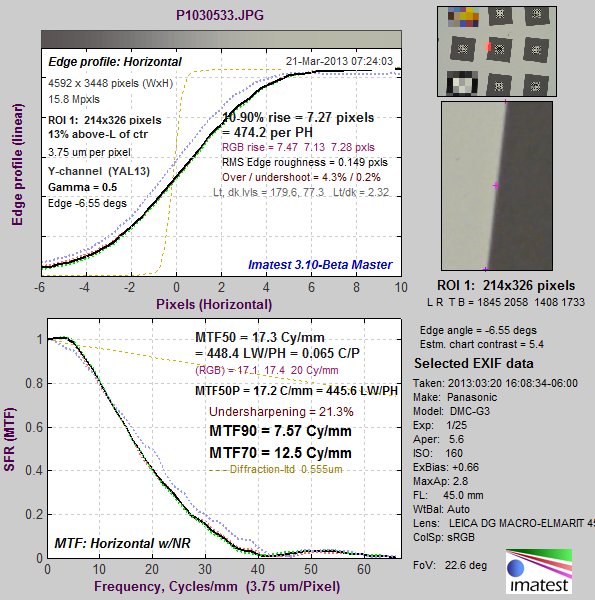 MTF of the 8×10 film test chart, measured with the Panasonic DMC-G3/Leica
45mm f/2.8 macro lens at 1:1 magnification.
The key chart summary metrics are MTF90, MTF70, and MTF50 (the spatial frequencies where MTF drops to 90, 70, and 50% of the low frequency values).
Here are the steps we followed in developing the Chart Quality index.
- The MTF of a system is the product of the MTF of its components. In this case we consider the system (which is what we are able to measure) to be the imaged test chart plus the camera (which consists of the lens, sensor, and signal-processing). We are interested in comparing the measured (system) MTF to the camera MTF, i.e., in finding out how much the chart degrades the camera measurement.
- From observing thousands of MTF curves we note that MTF is usually quite low around the Nyquist frequency (0.5 Cycles/Pixel), though there are exceptions for sensors without anti-aliasing (optical lowpass) filters (particularly for Foveon sensors). MTF50 for sharpened images with high quality lenses is typically around 0.25 to 0.40 Cycles/Pixel (0.5-0.8 Nyquist) (0.20-0.25 C/P for unsharpened images). This is the frequency range of greatest interest.
- The total vertical MTFnn of a chart image (in units of cycles) is equal to the MTFnn of the chart in cycles/mm times the vertical field of view (FoV) H of the chart in mm. From the above example: Total chart MTF90 = 7.57 cycles/mm * 169 mm = 1279 cycles. Similarly, Total chart MTF70 = 12.5*169 = 2112 cycles.
- Here’s where it gets tricky.
- Recalling that Nyquist frequency = one cycle per two pixels = 0.5 cycles/pixel, i.e., one cycle at the Nyquist frequency corresponds to two pixels, the imaged chart MTF will equal nn% at the Nyquist frequency when the number of vertical pixels NV = 2 * (Total chart MTFnn in cycles).
- To clarify with a more concrete example: If the total vertical chart MTF90 is 1279 cycles, the imaged chart MTF will be 90% (0.9) at the Nyquist frequency (0.5 Cycles/Pixel) when the number of vertical pixels for the chart image is 2*1279 = 2558 pixels. It will be lower when the number of vertical pixels is higher.
- From these observations we conclude that
- If the imaged chart MTF90 is at or above at the Nyquist frequency the chart will have relatively little effect on MTF measurements in the frequency range of interest (2.5% or less on MTF50— see the approximate calculation below).
- If the imaged chart MTF70 is around the Nyquist frequency, it will have a significant effect on MTF measurements (around 8%), but it will still be good enough for pass/fail decisions in manufacturing testing, provided you make allowances for the reduced MTF due to the chart.
- If the imaged chart MTF50 is around the Nyquist frequency, the chart may still be usable for pass/fail decisions in manufacturing testing, but this should only be done if a higher quality solution is unavailable (does not fit in the available space, etc.) Results will be sensitive to chart magnification and the difference in MTF between good and bad systems will be compressed.
- This leads to the definition of Chart Quality Index for MTFnn = CQInn.
|
Chart Quality Index for MTFnn \( = CQI_{nn} = 2 times MTF_{nn}text{(chart cycles/mm)} times text{Vertical field of view (mm)}\) The quality level specified above for MTFnn will be achieved if the number of vertical pixels is less than or equal to CQInn. For the chart MTF to have very little effect— under about 2.5% for a typical high quality cameras, The number of vertical pixels should be less than CQI90. |
From the above example,
CQI90 = 2 pixels/cycle * 1279 cycles = 2558 pixels.
The Panasonic DMC-G3 has 3448 vertical pixels, so we can expect the measured MTF to be lower than its correct value. Similarly,
CQI70 = 2 *12.5 * 169 = 2 * 2112.5 = 4225 cycles
So the DMC-G3 is quite a bit better than the CQI70 quality level.
Chart MTF losses: First order approximations
A reasonable approximation to actual chart losses can be calculated by making the first order assumption that MTF declines linearly for both the camera and test chart. For spatial frequency f in Cycles/Pixel (where Nyquist frequency = 0.5 C/P),
Camera MTF (without sharpening) \(displaystyle = 1-\frac{f}{2times MTF50}\) for f < 2*MTF50; 0 otherwise
Chart MTF (in camera image) \( =1 – f / A\) where A = 0.1 for MTF90; A = 0.3 for MTF70; A = 0.5 for MTF50.
Measured MTF = Camera MTF * Chart MTF \(displaystyle = bigl( 1 – \frac{1}{2 times MTF50}bigr) times ( 1 – 1/A) \) for f < min(2*MTF50, A); 0 otherwise
For a typical DSLR with a high quality lens and an anti-aliasing (optical lowpass) filter, unsharpened MTF50 is in the neighborhood of 0.25 C/P. The following images are for raw (unsharpened) and JPEG (strongly sharpened) files from the same capture: The Panasonic DMC-GF1 (12 megapixel), 14-45mm lens at 29mm, f/5.6. This lens performs well at f/5.6. Unsharpened camera MTF is a fairly good approximation to 1 – f / (2*MTF50).
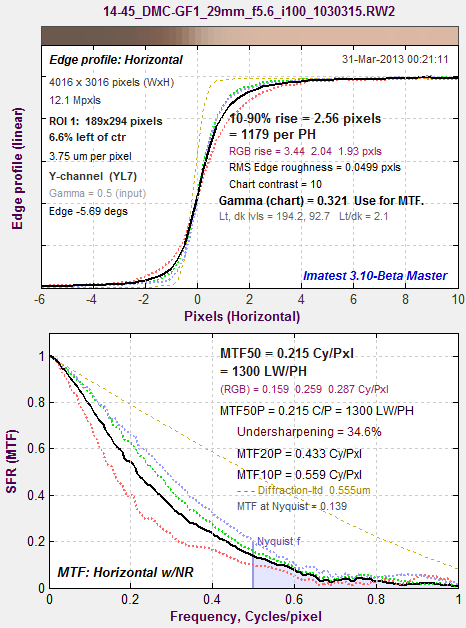 From a raw image (unsharpened) |
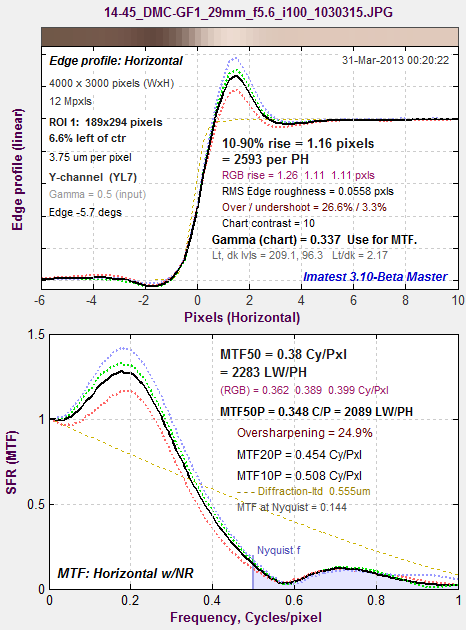 From a JPEG file (strongly sharpened) |
|
Measured MTF for Camera MTF (without sharpening) |
 Measured vs. Actual MTF50 for Camera MTF (without sharpening) \( = 1-\frac{f}{2 times MTF50}\) |
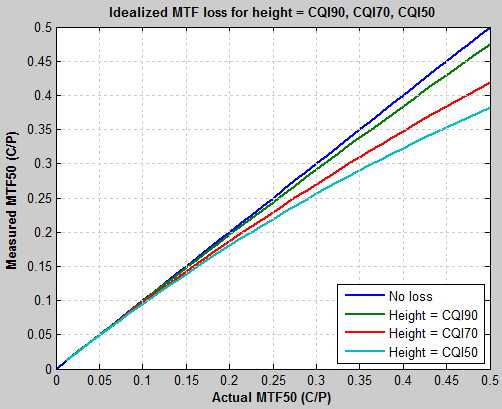
| Assuming a good camera with unsharpened MTF50 = 0.25 C/P (Nyquist frequency/2), here is the measured MTF (including chart loss) as a function of the original MTF. There is very little loss when the height of the image (or crop, if appropriate) equals CQI90. This plot is simple, but a little difficult to read. | If we assume that MTF falls off linearly, here is a plot of measured system MTF50 (for a perfect chart and with image or crop height = CPI90, CPI70, and CPI50) as a function of camera MTF50. This is what you’d expect, but still a little hard to read. |
| This plot shows the percentage MTF loss for image or crop height = CPI90, CPI70, and CPI50. It’s consistent with the above plots, but easier to read. We can see that the MTF measurement loss for the “good” camera with MTF50 = 0.25 C/P is 2.5% for image or crop height = CQI90. Unsharpened MTF50 as high as 0.5 C/P is displayed, but is rare, though it’s sometimes seen in certain cameras with excellent lenses and no anti-aliasing filters— especially cameras with Foveon sensors (mostly Sigma), which omit AA filters because they don’t have Bayer filters, hence they don’t have issues with (very annoying) color aliasing. | 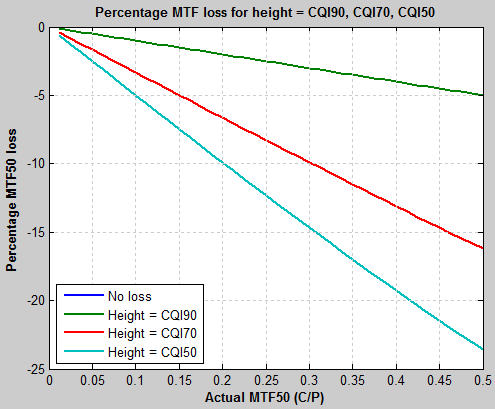 Percentage (measured) MTF loss vs. camera MTF50 (C/P) for Camera MTF (without sharpening) \( = 1 – \frac{f}{2 x MTF50}\) |
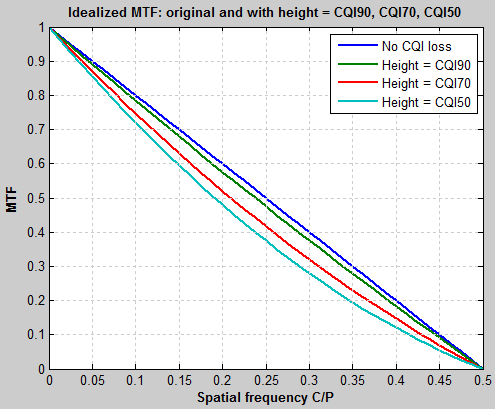
Chart tables
The following table lists MTFnn for various media.
| Media | MTF90 (C/mm) | MTF70 (C/mm) | MTF50 (C/mm) |
| Enhanced Matte (inkjet) | |||
| Premium Luster (or Semigloss) (inkjet) | |||
| Photographic paper | |||
| Color film printed with LVT (transmissive) |
8.1 |
13.4 | 19.5 |
| B&W film printed with LVT (transmissive) |
7.25/5.86 (H/V) 6.4 |
14.5/12.3 (H/V) 13 |
20.1/18.5 (H/V) 19 |
| Displaytrans (inkjet transmissive) | 1.76/1.7 (H/V) 1.7 |
4.85/3.25 (H/V) 4 |
6.94/4.45 (H/V) 5 |
These measurements were made under the following conditions
- Panasonic Lumix DMC-G3 16-megapixel camera (4592×3448 pixels; pixel pitch = 3.75 microns). Mirrorless compact cameras (Panasonic, Sony, Olympus, etc.) are particularly well-suited because high quality macro lenses are available, pixel sizes are relatively small, and there is no problem with DSLR mirror slap.
- Leica DG Macro-Elmarit 45mm f/2.8 ASPH OIS macro lens (much higher quality for close-up work than general-purpose zooms).
- f/8 aperture, a bit beyond the optimum aperture, but selected because of the extra depth of field
- manual focus, selected because autofocus does not appear to be highly reliable for this camera/lens combination
- 1:1 magnification, selected because chart and image sensor distances are equal (which makes measurements easy to interpret), and also because lens MTF is generally much better than imaged chart MTF at this magnification
- extremely sturdy camera support, required because the image is highly sensitive to tiny vibrations at this magnification
- self-timer set to (at least) 2 seconds to give vibration time to damp out
- Several exposures (at least 3) are taken, with the sharpest is found using Find Sharpest Files, which is an extremely rapid way of ranking files by sharpness.
Horizontal and Vertical MTF may differ by as much as 15% for charts produced by printers or LVT film scanners. We report both, but use a number closer to the lowest of the two to calculate CQI. MTF90 needs to be checked carefully (by observing graphic results) because it is measured close to the peak MTF value, making it subject to statistical variations from chart noise (inkjet dots and film grain). (MTF50 is a much more stable measurement, but less useful for chart measurements.) Horizontal and Vertical MTF comparisons are not consistent because different charts are printed in different orientations, depending on their size.
We didn’t use a flatbed scanner because most of them don’t have adequate optical systems. Specs of 4800+ dpi are always suspect and generally bogus (though we haven’t tested the latest Epson models). Most flatbed scanners don’t dome close to the definition (above) of “high quality” imaging systems that make full use of available pixels.
The following table lists CQInn for several charts available from the Imatest Store (for typical use cases). Some key assumptions:
- The typical framing of SFRplus charts has a vertical field of view (FoV) of 1.1 times the bar-to-bar distance. (This allows a reasonable amount of white space above and below the bars. Of course each case is different. CQInn corresponds to the total image height in pixels.
- Most other charts (Spilled Coins, Log Frequency-Contrast, Siemens Star, etc.) are assumed to occupy a portion of the image (typically 1/2 to 1/4 of the image height). None are intended to occupy the entire image. CQInn corresponds to the pixel height of the image of active area of the chart (e.g., the actual Spilled Coins region of the Spilled Coins chart, which includes a number of other features).
|
A reminder: Chart Quality Index has been deprecated and replaced by new capabilities for measuring and correcting MTF degradation caused by test charts. These capabilities are found in Compensating camera MTF measurements for chart and sensor MTF These new capabilities are far easier to understand and apply than CQI. |