Chart suitability display | Inkjet matte | B&W photo paper | Color LVT | B&W LVT | MTF suitability calculations
Whenever a test chart is used to measure camera MTF (sharpness)— and that includes a large portion of Imatest measurements— we need to know if the chart is good enough to reliably measure MTF. In practice, “good enough” means that chart MTF projected on the image sensor will have little effect on the MTF measurement (which, by definition, includes the chart and the camera). This is generally the case for charts large enough to conform to traditional Imatest recommendations. But there are situations where the charts are pushed beyond their recommended limits, especially where space is limited, and we need to know how well the chart performs in these conditions.
This page contains Chart MTF suitability displays for several standard test chart media– inkjet, photographic paper (reflective), and photographic film (transmissive).
The following table is based on experience using chart compensation, where the key metric that determines chart quality is the projected chart MTF on the image sensor at the Nyquist frequency, fNyq = 0.5 cycles/pixel.
| MTF @ fNyq | Quality | Description |
| MTFNyq ≥ 0.90 | Excellent | Chart compensation is not needed. |
| 0.70 ≤ MTFNyq < 0.90 | Good | Chart compensation is recommended but optional. It improves accuracy. |
| 0.50 ≤ MTFNyq < 0.70 | Comp. required | Chart compensation is required for accurate results. |
| 0.30 ≤ MTFNyq < 0.50 | Minimal | Will work with chart compensation, but this is stretching things. Not recommended. |
| MTFNyq < 0.30 | Not usable | Don’t even think of it! MTF is too low for reliable results (it’s too sensitive to noise), even with compensation. |
Chart MTF Suitability display
This display, calculated by the Imatest Chart Quality Calculator, is recommended for determining the suitability of a chart for MTF measurements for a given camera system.
You don’t need to have Imatest installed to use the Chart MTF Suitability display results on this page.
It is based on the concept that only three items (one file and two parameters) are needed to determine chart suitability.
- the chart compensation file, which has a model of the chart MTF for a specific print technology (inkjet, photo paper, photo film, etc.)
- the vertical field of view (VFoV), typically measured in centimeters (cm)
- the vertical pixel count of the sensor (Vpix)
If you have the chart compensation file and know VFoV and Vpix, you can easily determine chart suitability from the Chart Suitability display. All other parameters, such as angular field of view, lens-to-chart distance, sensor height, and pixel pitch, are only used to calculate items 2 and 3.
Note that this approach only works for rectilinear (low barrel distortion) images. It has to be modified for highly barrel-distorted (fisheye) lenses. Horizontal may be substituted for Vertical dimensions as long as consistency is maintained.
To use this display in Imatest, read the chart compensation file, then press Chart MTF suitability display at the bottom of the Chart quality calculator window. The box near the top with descriptions of the media is for annotation-only. The aspect ratio, used for the megapixel scale on the right y-axis, can be set to 4:3, 3:2, or 16:9 in the small dropdown menu on the right.
This page has results for typical samples of a number of printing technologies.
|
How to read the Chart suitability display
Background colors correspond to the colors on the Quality table (above), i.e., green (lower-right) is excellent; yellow requires MTF compensation, pink (upper-left) is unusable, etc. (The Matlab exponential notation on the x and y-axes is not my favorite: 100 = 1; 101 = 10; 102 = 100, etc.) |
Reflective charts
Inkjet charts
The table below is based on measurements of matte surfaces. Luster/Semigloss surfaces have similar performance.
 Matte inkjet film Chart Suitability display. Click on the image to display full-sized.
Download an MTF Compensation file typical of recent high-quality inkjet prints,
Good_Inkjet_2019_DSC00074_JPG.txt
B&W photographic paper charts
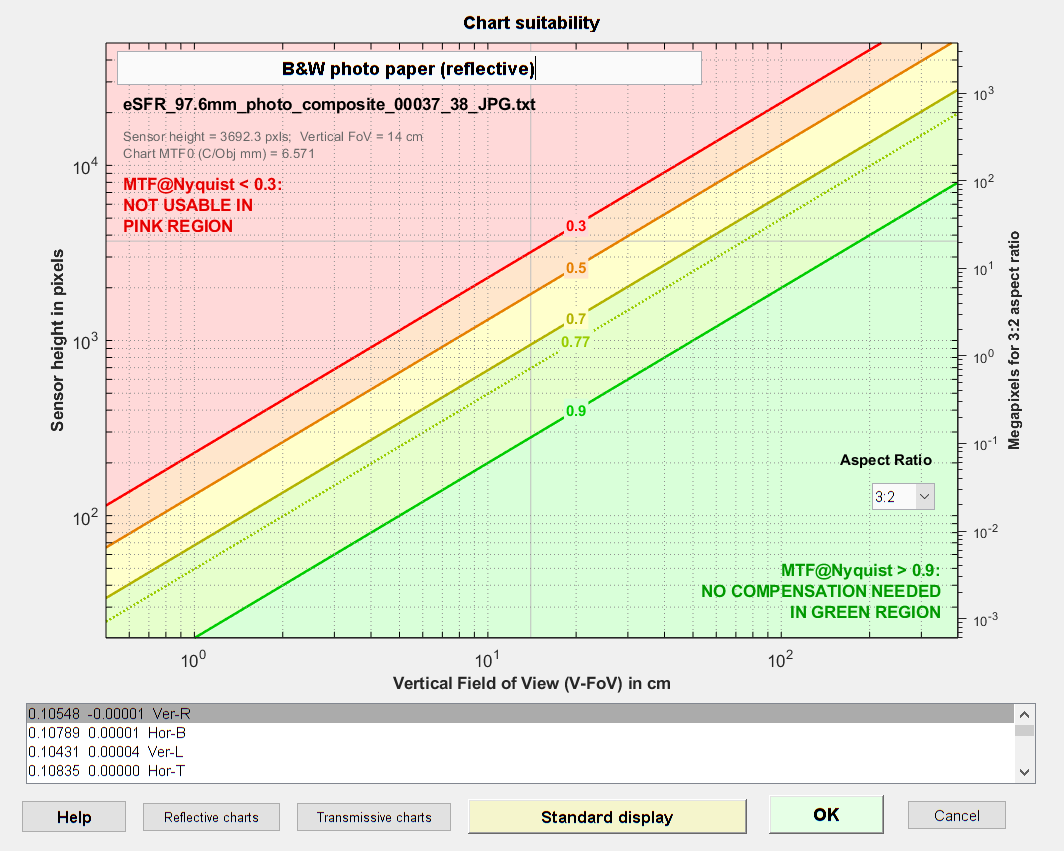 Black & White LVT film Chart Suitability display. Click on the image to display full-sized.
Download the MTF Compensation file, eSFR_97.6mm_photo_composite_00037_38_JPG.txt
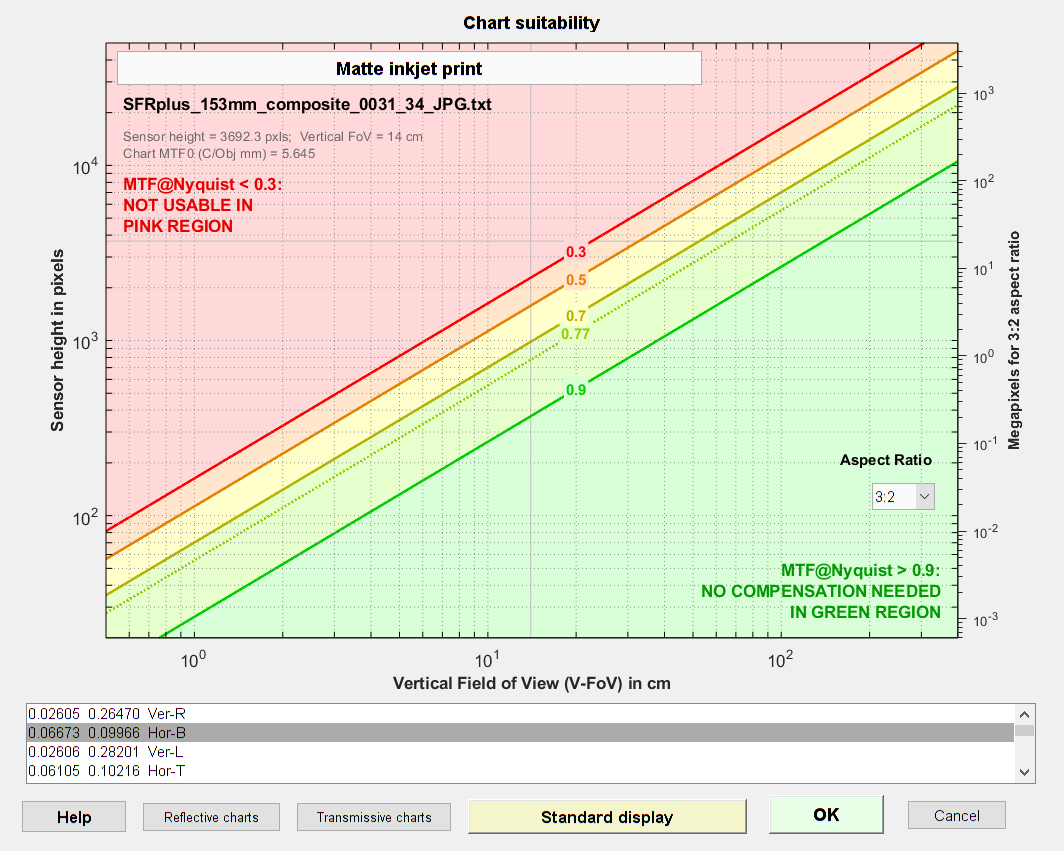
Transmissive (backlit) charts
Color LVT film
 Color LVT film Chart Suitability display. Click on the image to display full-sized.
Download the MTF Compensation file, SFRplus_LVT_157mm_00019_JPG.txt
B&W LVT film
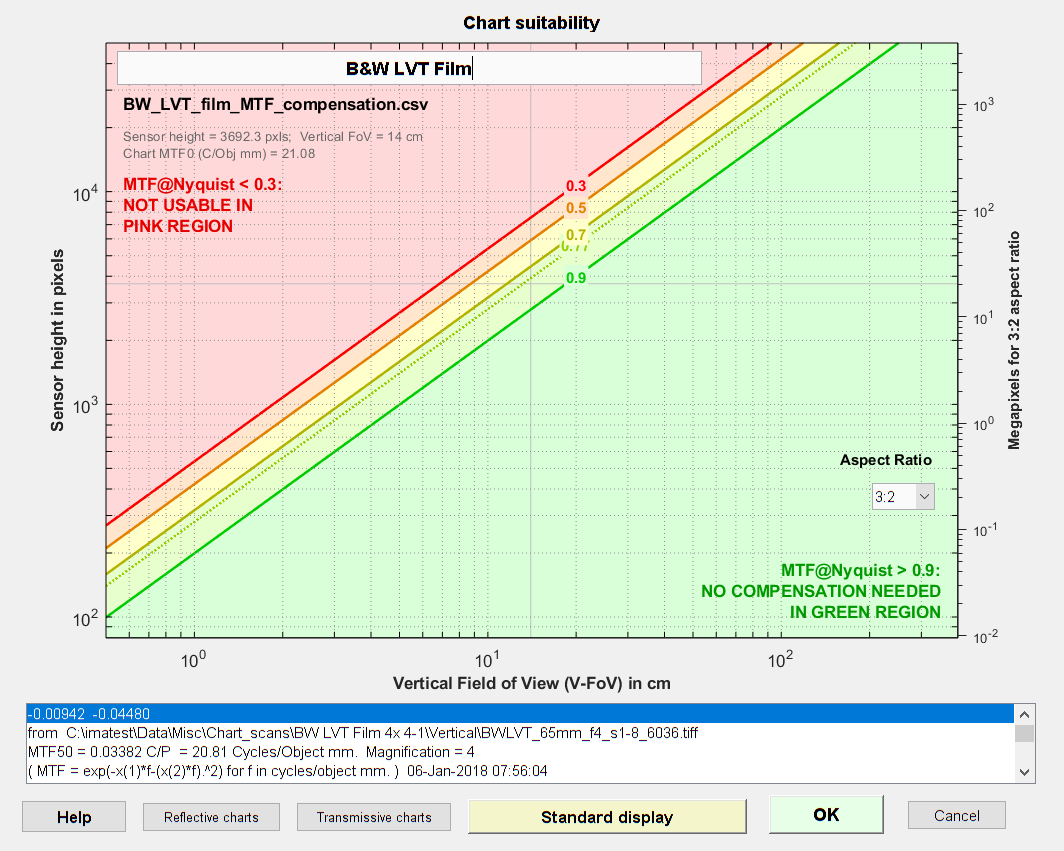
Black & White LVT film Chart Suitability display. Click on the image to display full-sized.
Download the MTF Compensation file, BW_LVT_film_MTF_compensation_old.csv
Example using B&W LVT film: The standard Black & White LVT chart, printed on 12×20 inch film, is designed to have a 27 cm vertical Field of View. 27 cm (on the x-axis) corresponds to MTF@Nyquist = 0.9 (the green diagonal line, below) for sensor height = 5500 pixels (left y-axis) or 45 megapixels at 3:2 aspect ratio (right y-axis). At this high quality level, MTF compensation is not required. If we push the chart to MTF@Nyquist = 0.7 (the olive diagonal line), which is still reasonably good, but requires MTF compensation, we reach sensor height = 8500 pixels (about 100 Megapixels at 3:2 aspect ratio).
Appendix: Chart MTF and suitability calculations
Chart MTF is measured using printed slanted-edges of reasonable contrast (between 4:1 and 10:1) with the technique described in the Appendix of Compensating Camera MTF Measurements. The spatial frequency unit for the chart MTF measurement is cycles/object mm, i.e., cycles per millimeter on the chart (not on the sensor, as is typical of most Imatest measurements). Here are a few details about the measurement (more in the Appendix).
- Magnification should be large enough (typically around 0.5x for inkjet charts and 1x for photographic charts) so that the measurement is dominated by the chart quality, not by the lens, sensor, or signal processing. (Typical camera MTF measurements have magnifications of < 0.1 for high quality film charts and < 0.02 for inkjet charts.) Magnification should be carefully measured and recorded.
- The measured chart MTF is fit to a function that closely approximates actual response curves at frequencies where MTF > 0.3 (below MTF30). This function removes irregularities in the MTF curve caused by noise (typically at frequencies above MTF30) and facilitates further processing. The function is
\(\displaystyle MTF_{chart}(f) = e^{-a_1 f – (a_2 f)^2}\) ; f in units of Cycles/Object mm (C/Obj mm).
This function matches a wide range of observed chart MTF measurements.
Projected Chart MTF
When the chart is projected (imaged) on the sensor its spatial frequency units must be transformed to the native units of the sensor, Cycles/Pixel (C/P), by substituting,
\(f(\text{C/Obj mm}) = f(C/P) \times \text{magnification} \times \text{pixels/mm}\)
\(MTF_{chart-projected} (f) = MTF_{chart}(f(C/P) \times \text{magnification} \times \text{pixels/mm}) = MTF_{div}(f)\)
In Imatest sharpness modules, pixels/mm is typically derived from the user-entered value of pixel pitch (in μm), where pixels/mm = 1000 / (pixel pitch (μm)). Magnification is either entered in the settings window or derived from geometrical factors (like the bar-to-bar spacing in SFRplus or the vertical registration mark spacing in eSFR ISO).
If MTFdiv(fNyq) (MTFdiv at the Nyquist frequency (fNyq = 0.5 C/P)) is lower than 0.9 (90%), measurement accuracy can be improved by dividing the measured MTF by MTFdiv, as described in Compensating camera MTF measurements for chart and sensor MTF. If MTFdiv(fNyq) is greater than 0.9, MTF compensation offers little improvement.
Note that for rectilinear images (not strongly barrel distorted, i.e., not fisheye),
\(\text{magnification} = \text{sensor height} / \text{Vertical FoV}\) and
\(\text{pixels/mm} = \text{Vertical pixels} / \text{sensor height}\)
Therefore we can say
\(f(\text{C/Obj mm}) = f(C/P) \times \text{Vertical pixels} / \text{Vertical FoV}\)
This formulation is used in the Chart Suitability display.
Fisheye (strongly barrel-distorted) lenses present a problem because their magnification decreases with distance from the image center. To use the Chart Suitability display, we have to create a sort of “virtual Vertical FoV” based on magnification at the center. Fortunately this isn’t too difficult because fisheye lenses are rarely used for extreme closeup images (except in medical endoscopes). In most cases the lens-to-chart distance dlens-chart >> lens focal length f, and hence we can use magnification = f / dlens-chart = Vertical FoV/sensor height.
\(\text{virtual Vertical Field of View} = VVFoV = \text{magnification} \times \text{sensor height}\)
VVFoV can be significantly larger than the actual physical FoV.