The highest quality images are created by optimizing many key image quality factors. Sharpness determines the amount of detail an imaging system can reproduce. Learn how to optimize sharpness in your camera system using Imatest.
The highest quality images are created by optimizing many key image quality factors. Noise is an undesirable random spatial variation, visible as grain in film, or pixel level fluctuation in digital images. Learn how Noise effects your camera system using Imatest.
Lateral chromatic aberration (LCA), AKA lateral chromatic displacement (LCD) and “color fringing”, is a lens aberration that causes colors to focus at different distances from the image center. It is most visible near the corners of images. In this video, we will explain the techniques used to measure for LCA.
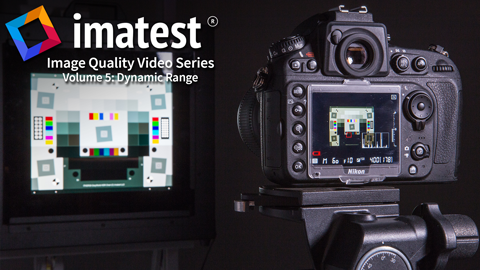
The highest quality images are produced by optimizing many key factors. Dynamic Range is characterized by the ratio between the highest light intensity that a camera system can capture and the darkest tones that become indistinguishable from noise. Dynamic range measurements are useful for optimizing system performance and for verifying camera design specifications. Informed consumers seek camera systems with superior dynamic range, which can capture information in dark shadows while maintaining detail in brighter areas.
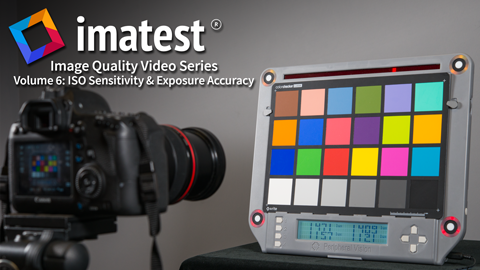
Image Quality Video Series: ISO Sensitivity & Exposure Accuracy
ISO Sensitivity (or ISO speed) is a measure of how strongly an image sensor and/or camera responds to light. The higher the sensitivity, the less light (smaller aperture and/or shorter exposure time) required to capture a good quality image.
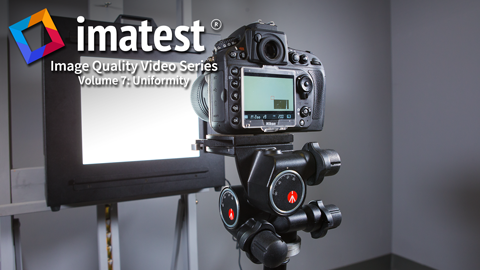
Lens shading, Light falloff & Vignetting:
Where your image becomes darker the further you get from the center. This is due to the radial nature of the lens which collects more light in the center. It can be particularly strong with wide angle lenses. Non-uniformity is also caused by the chief ray angle of light incident to the sensor which has reduced quantum efficiency as the angle increases.
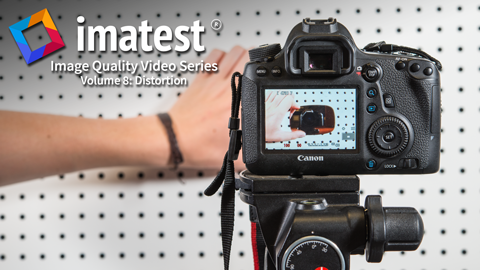
Lens (optical) distortion is an aberration that causes straight lines to curve near the edges of images. It can be troublesome for architectural photography and photogrammetry (measurements derived from images).
Overview of image quality and Imatest measurements
Image quality is one of those concepts that’s greater than the sum of its parts. But you can’t ignore the parts if your goal is to produce images of the highest quality. Every image quality factor counts.
This page introduces the key image quality factors and briefly describes how Imatest™ measures them— with links to detailed pages. It is a guide to Imatest organized by image quality factors. Other guides include the Tour (organized by module) and Imatest documentation (the Table of Contents).
To illustrate the quality factors, we use this early morning image of Monument Valley from Hunt’s Mesa, near the Arizona-Utah border.
Image quality measurements are affected by the
Lens — Imatest cannot measure lenses by themselves, but lenses can be effectively compared to one another using a single camera body with consistent image processing settings.
Sensor — Imatest can measure the performance of the Lens+sensor from minimally-processed RAW images if they are available. Sharpness, distortion, vignetting, Lateral Chromatic Aberration, noise, and dynamic range are the principal factors that can be measured at this stage. Most of these measurements can be clearly classified as good/bad.
Image processing pipeline— typically includes demosaicing, color correction, white balance, application of gamma and tonal response curves, sharpening, and noise reduction. Measured from the image delivered to the user (such as in-camera JPEG images). Additional image quality factors include tonal response (contrast, etc.), color response, and many others. The output of the pipeline may be compared to the minimally-processed lens+sensor measurements.The effect of the pipeline on subjective image quality can be highly scene- and application-dependent, making it difficult to assign “good” or “bad” rankings. Imatest results for these factors need to be interpreted carefully. Examples:
Higher contrast images often score higher in visual quality assessment tests, but high contrast can cause clipping (visible as burnt-out highlights) in contrasty (often sunlit) scenes. Tonal response curves with “shoulders” can help. See Stepchart and Multicharts.
Most consumers find accurate color to be boring, so camera manufacturers “enhance” colors in a number of ways, such as boosting chroma. See Colorcheck and Multicharts.
Most consumers dislike noisy images, but software noise reduction (typically lowpass filtering in areas that lack contrasty features) can remove fine texture, resulting in a cartoon-like “plastic” skin appearance. See Log F-Contrast and Random/Dead Leaves.
Summary table
This table summarizes the image quality factors and links to pages where they are described in detail. Most of the charts are available from Imatest Store.
Notes: [1] Not available in Imatest Studio. Available in Master, Image Sensor, etc. [2] can be printed from Test charts, but we recommend purchasing it from the Imatest Store.
Details of several Imatest algorithms are included in Appendix C, Video Acquisition Measurement Methods (pp. 91-125), of the Public Safety SoR (Statement of Requirements) volume II v 1.0, released by SAFECOM, prepared by ITS (a division of NTIA, U.S. Department of Commerce). No credit is given, but the style and illustrations will be recognizable.