Postprocessor to Color/Tone:
Calculates Dynamic Range from several grayscale images
| Imatest 4.0.28 ISO 15739 SNR and Dynamic Range can now be calculated from semigloss reflective as well as transmissive grayscale stepchart targets in Color/Tone Interactive, Color/Tone Setup, and eSFR ISO. |
|
The Dynamic Range postprocessor is not recommended for high dynamic range (HDR) measurements It is OK for normal dynamic range measurements (<80 dB expected). |
Introduction to the Dynamic Range postprocessor
Thanks for Jonathan Sachs for suggesting this module.
Imatest has several types of Dynamic Range calculation, which are cross-referenced here.
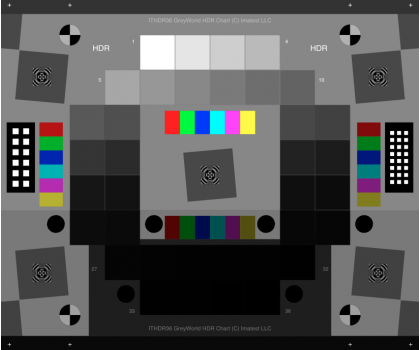
| Dynamic range from a single transmissive chart image. | Stepchart, Color/Tone Interactive, Color/Tone | A transmissive chart is such as the Imatest 36-patch Dynamic Range or HDR chart (both shown below) is required because reflective charts do not have sufficient tonal range. | ||
|
||||
| Contrast Resolution Dynamic Range | Color/Tone Interactive, Color/Tone | A transmissive chart designed to show the visibility of low contrast features over a wide tonal range (95dB). | ||
| Dynamic Range from multiple (differently exposed) images | Dynamic Range postprocessor module (Described on this page) |
Uses CSV output of Stepchart of Color/Tone for several differently exposed images. Usually used with reflective charts, but transmissive charts may also be used. May overestimate DR because it does underestimates how much veiling glare degrades DR. | ||
| ISO 15739 Dynamic Range from patch with density ≈ 2 | Color/Tone Interactive, Color/Tone, eSFR ISO | Extrapolates Dynamic Range from a single patch with density ≈ 2. | ||
| Raw sensor Dynamic Range | Color/Tone Interactive, Color/Tone | Fits raw data to an equation from the EMVA 1288 standard, then extrapolates to find DR. The test chart does not have to have as large a tonal range as the DR, but transmissive charts with tonal range ≥ 3 are recommended. Sensor Dynamic Range is often much larger than DR measured in real imaging systems (which are limited by flare light). | ||

Dynamic Range is a postprocessor for Stepchart and Color/Tone that calculates a camera’s dynamic range— the range of exposure it can capture at a specified quality level— from up to four exposures of
- reflective step charts such as the Kodak Q-13 or Q-14, ISO 14524 or ISO 14579 charts, or from
- transmissive charts such as the Imatest 36-patch Dynamic Range chart, whose density range (~3.0) is not sufficient for the best DSLRs and HDR cameras.
The Dynamic Range postprocessor is appropriate when
- a transmissive chart is not available (reflective charts have limited density ranges, rarely over 2 Optical Density units (6.6 f-stops) and never over 2.3, or
- an available transmissive chart has an inadequate density range. As with all Imatest modules, a great many display options are available.
- Image processing is consistent for all images, which means no tone mapping can be applied.
| Tip: Imatest transmissive HDR (High Dynamic Range) charts have a tonal range of over 100dB (>100,000:1 transmittance ratio). Sensors are available with claimed dynamic ranges greater than 120dB, but real-world cameras we are aware of cannot achieve Dynamic Ranges over 100dB because of flare light— stray light that bounces between lens elements and off the lens barrel. Some sensor manufacturers have misled customers into expecting greater than 120dB system dynamic range. Sorry, it’s not achievable with present-day (2022) technology! :-( Imatest can measure sensor dynamic range from totally raw images using the technique described here. |
Limitations: When several images are combined, the effects of veiling glare on dynamic range,
which can be very significant for HDR images, are not properly accounted for.
Dynamic Range
|
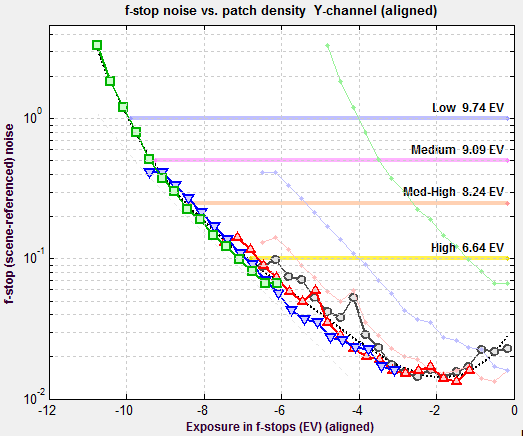 Example of Dynamic Range output showing Example of Dynamic Range output showingf-stop noise and corresponding dynamic ranges |
Operation
- Capture several images of a test chart, with each image differing in exposure by at least 2 f-stops (EV). For reflective charts, the total range from the most to least exposed image should be at least 6 f-stops for good results (7 or 8 doesn’t hurt). The least exposed images will appear nearly black, but they should contain some detail. The lightest patch in the most exposed image should be saturated (R, G, and B = 255 in 24-bit color images or 65535 in 48-bit color images. Be sure the light is glare-free. The Imatest Test Lab page has several lighting recommendations.
| Tip: Once the brightest patch is saturated (level 255 in 8-bit depth images; 65535 in 16-bit depth images) there is no benefit to increasing the exposure. The extra saturated patches contain no useful information. On the other hand, dark (underexposed) images may contain significant information that isn’t clearly visible. |
- To determine a camera’s ultimate potential, store the image files in RAW format for later conversion or use one of Imatest’s RAW conversion options. You may also with to capture and store JPEG files for comparison— to see how dynamic range is affected by in-camera JPEG conversion (which usually includes software noise reduction).
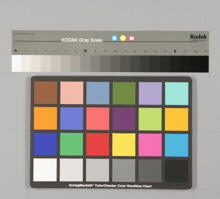 +1 f-stop exposure (first patch saturated) |
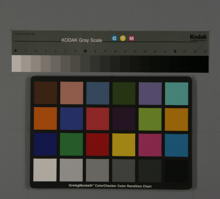 -2 f-stop exposure |
 -5 f-stop exposure (some detail is present, but barely visible) |
|
Images of Stepchart and X-Rite Colorchecker at +1, -2, and -5 f-stop exposure.
(Images were taken at 1 f-stop increments from +1 to -6.) |
||
- If RAW images are to be analyzed, convert the to 16-bit TIFF format for best results. Be sure to record the RAW conversion settings, which affect the tonal response curve. Noise reduction (one of the functions of RAW converters) strongly affects the measured dynamic range.
- Analyze the images with Stepchart or Color/Tone. Be sure to save the CSV output files.
| Tip: If images are tone-mapped (a technique for increasing perceptual dynamic range by locally shifting tonal levels) the Dynamic Range module will not be able to properly combine separate images. The tonal response of each image will be different, making accurate alignment difficult to impossible. Where possible, raw images should be used to characterize a camera’s intrinsic Dynamic Range. |
- Open Dynamic Range by clicking on the button on the left of the Imatest main window. The following welcome screen appears. It may contain instructions that are more up-to-date than the image below. Previously-entered CSV files are read and stored.
Dynamic Range opening screen
- Enter 2-4 CSV results files generated by Stepchart or Color/Tone into windows A, B, C, and/or D. (One or two of the windows can be empty. None can be selected if needed.) The files should be for exposures separated by 2-4 f-stops (EV). The number of detected patches for each file is shown to the right of the window ( N 20 20 17 10 ).
- If results have not already appeared, click on .
Results
Several displays and display options are available. They are selected in the lower-right region of the Dynamic Range window.
| Display |
| Pixel levels vs. exposure, where exposure = -log10(patch density). |
| Log Pixel levels vs. exposure, where Log denotes log10. |
| Local gamma: d(Log pixel level) / d(Log exposure), i.e., the slope of the Log pixel level plot. Gamma is contrast. |
| f-stop noise: Noise referenced to the image. |
| S/N (1/f-stop noise) |
| SNR (1/f-stop noise) dB = 20 log10(1/f-stop noise). |
| Pixel S/N (Pixel level/noise). Displayed optionally by Stepchart. Referenced to the file. |
| Pixel SNR dB = 20 log10(Pixel level/noise) |
| Exif data |
| Channel |
| (Imatest Master only) Selects color channel: Y (luminance), R, G, or B. |
| X-axis scale |
| f-stops (EV). The most popular units for expressing dyamic range. |
| Density units: Based on a log10 scale. 1 density unit = 3.32 f-stops (EV). |
| X-axis alignment |
| Unshifted |
| Shifted (aligned) Of greatest interest: shows total exposure range |
The image below shows log pixel level vs. (log) exposure (in f-stops). The x-axis has been shifted (aligned). Unaligned log pixel levels are shown as faint lines on the right of the plot. The camera has a strong “shoulder,” which reduces the likelihood of highlight burnout.
![]() Log pixel level as a function of (log) exposure. Canon EOS-20D, ISO 100, Standard picture mode.
Log pixel level as a function of (log) exposure. Canon EOS-20D, ISO 100, Standard picture mode.
Dynamic range results are shown on the upper right. Dynamic range numbers based on f-stop noise are shown boldface. These are identical to the numbers in the Stepchart analysis. An alternative dynamic range measurement based on pixel Signal-to-Noise Ratio (SNR) is shown in normal (not bold) typeface. Two additional plots are shown below. The number of detected patches for each file is shown to the right of the file name ( N 20 20 17 10 ).
f-stop noise, showing dynamic ranges
![]() Pixel SNR in dB (20 log10(Pixel level/noise)), showing dynamic ranges
Pixel SNR in dB (20 log10(Pixel level/noise)), showing dynamic ranges
Dynamic range — background
Dynamic range (DR) is the range of tones over which a camera responds. It is usually measured in f-stops, or equivalently, zones or EV (Exposure Value), all of which represent factors of two in exposure. (It can also be measured in density units, where one density unit = 3.322 f-stops.)
DR is typically specified as the range of tones over which the RMS noise, measured in f-stops (the inverse of the signal-to-noise ratio, SNR), remains under a specified maximum value. The lower the maximum noise (the higher the minimum SNR), the better the image quality, but the smaller the corresponding dynamic range. SNR tends to be worst in the darkest regions. Imatest calculates the dynamic range for several minimum SNR levels from 10 (20dB) (high image quality) to 1 (0dB) (low quality; corresponding to manufacturer’s data sheets or the ISO 15739 definition).
Image sensor dynamic range, corresponding to manufacturer’s data sheets, can be calculated in Color/Tone and eSFR ISO from minimally-processed (undemosaiced) raw images using an entirely different method: see Image sensor (raw) noise.
A dynamic range corresponding SNR = 1 (1 f-stop of noise) corresponds to the intent of the definition of ISO Dynamic range in section 6.3 of the ISO noise measurement standard: ISO 15739: Photography — Electronic still-picture imaging — Noise measurements. The Imatest measurement differs in several details from ISO 15739; hence the results cannot be expected to be identical. (We will be adding the standard ISO calculation.) Imatest produces more accurate results because it measures DR directly from a sequence of chart images, rather than extrapolating results from a single reflective chart image.
F-stop noise and scene-referenced SNR
where ΔL is the smallest luminance difference the eye can distinguish. This equation is approximate; effective ΔL tends to be larger in dark areas of scenes and prints due to visual interference (flare light) from bright areas. Expressing noise in relative luminance units, such as f-stops, corresponds more closely to the eye’s response than standard pixel or voltage units. Noise in f-stops = Nf-stop is obtained by dividing the noise in pixels by the number of pixels per f-stop. (We use “f-stop” rather than “zone” or “EV” out of habit; any of them are OK.) Note that 1 f-stop = 0.301 Optical density units = 6.02dB (decibels) = log2(luminance). Also note that Nf-stop is scene-referenced noise in (logarithmic) units of f-stops, and must be distinguished from linear scene-referenced noise, Nscene-ref, which has the same linear units as luminance (the scene signal).
The above-right image illustrates how the pixel spacing between f-stops (and hence d(pixel)/d(f-stop)) decreases with decreasing brightness. This causes f-stop noise to increase with decreasing brightness, visible in the figures above. Since f-stop noise and scene-referenced SNR are functions of scene luminance, largely independent of image signal processing and fogging from flare light, they are an excellent indicators of real-world camera performance. They are the basis of Imatest Dynamic Range measurements.
|

