eSFR ISO: Analyze the ISO 12233:2017 Edge SFR chart* and ISO 12233:2023 Edge SFR chart
| Standard: | |
| Technical Committee: | ISO/TC 42 Photography |
| Published: | 2017-01, 2023-02 |
The Imatest ISO 12233:2023 Edge SFR charts
Imatest eSFR ISO 2023 test charts comes in a two variants: Standard and Extended. All variations are compliant with the ISO 12233:2023 standard. See related 2017 documentation below for further information about the Imatest eSFR ISO charts. 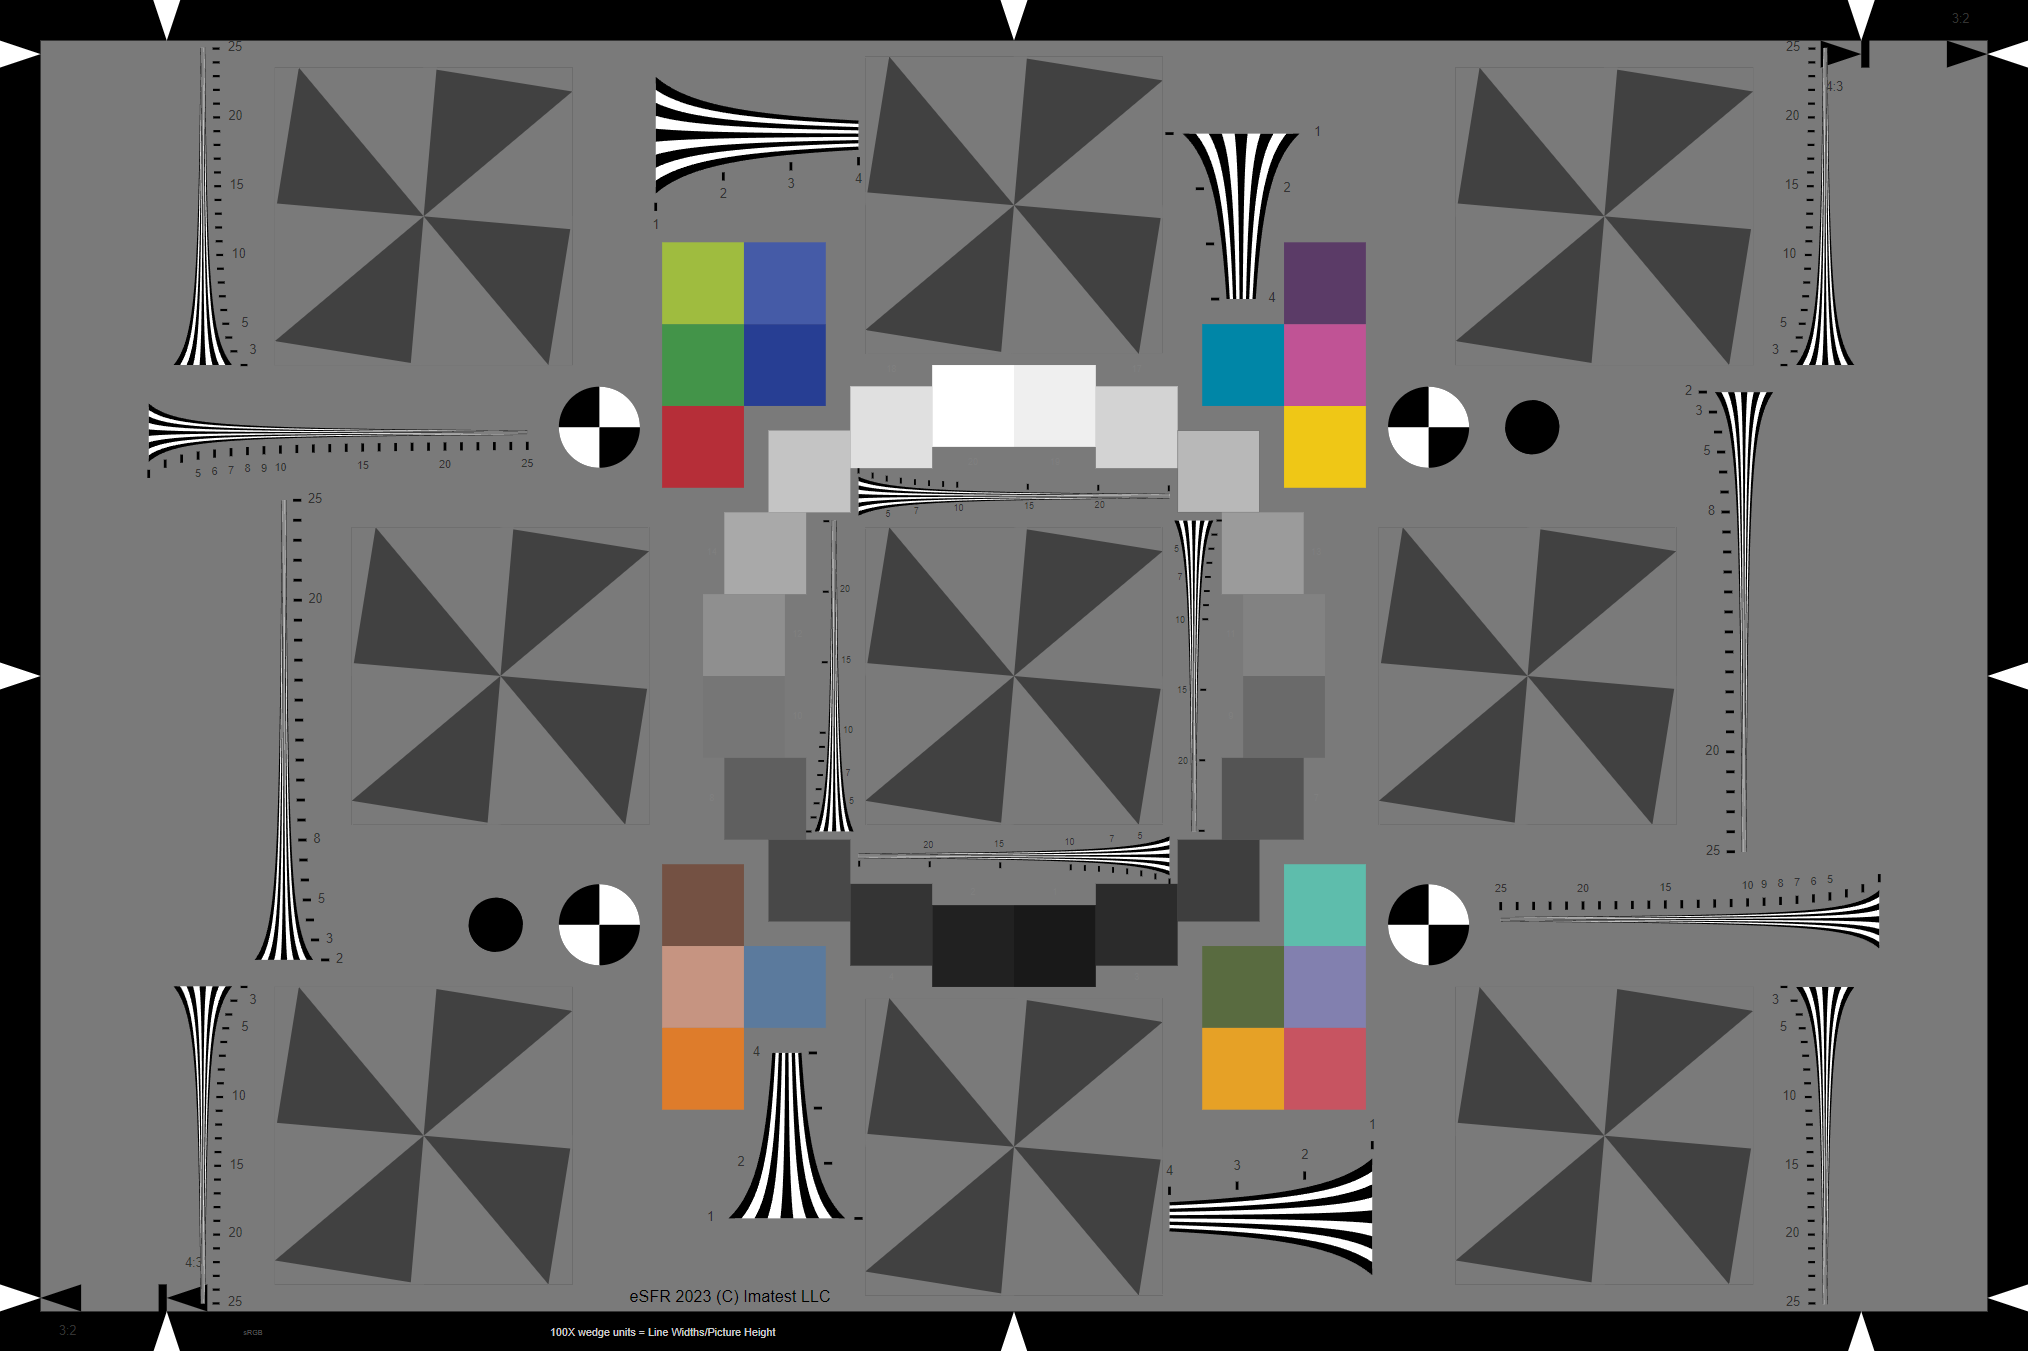 Standard E-SFR ISO 2023 test chart: 4:3 aspect ratio,
18 added color patches, 12 pairs of added wedge patterns.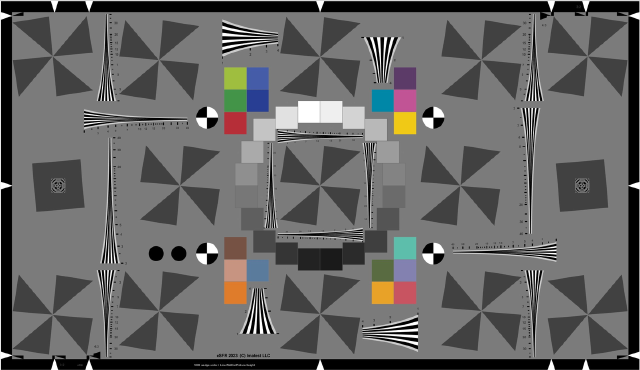 Extended E-SFR ISO 2023 test chart: 16:9 aspect ratio,
4 added stars in the corners and 2 added squares on sides,
18 added color patches, 12 pairs of added wedge patterns.
The Imatest ISO 12233:2017 Edge SFR charts
Imatest eSFR ISO 2017 test charts come in three variants: Standard, Enhanced and Extended. All have enhancements over the chart illustrated in the ISO 12233:2017 document, but all conform to the standard. Enhanced versions are available from the Imatest store in inkjet, photographic paper, and photographic film media. Note: The standard design is not sold as an Imatest Chart because it is functionally a subset of the enhanced version.
 Standard eSFR ISO chart: 3:2 aspect ratio, no added features
Click on any of these charts for larger versions.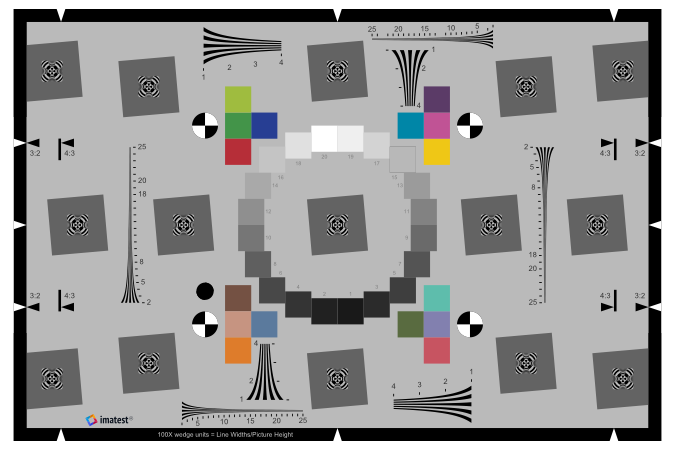 Enhanced eSFR ISO test chart: 3:2 aspect ratio, 6 added squares on sides,
16 added color patches, several added wedge patterns.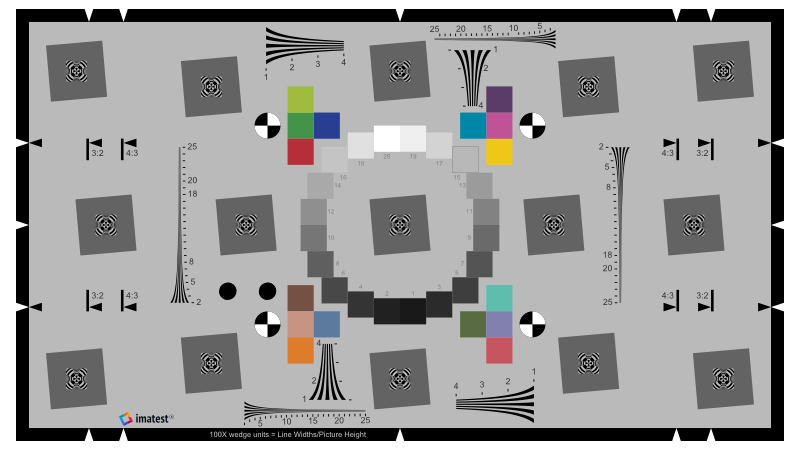 Extended eSFR ISO test chart: 16:9 aspect ratio for HDTV and cinema (and good for DSLRs),
6 added squares on sides, 16 added color patches, several added wedge patterns.
Other ISO Test Charts
This ISO 12233 2014 standard defined three test charts. The new Imatest eSFR ISO module performs a highly automated analysis of the new low contrast (4:1) Edge SFR chart and is available in Imatest Master and Image Sensor 4.0. * Note: ISO 12233:2014 has the same chart requirement.
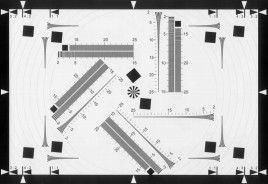
| 2014 CIPA resolution (wedge) test chart |
Hyperbolic wedges: 4 vertical, 4 horizontal, and 2 diagonal (45 degrees). Vertical and horizontal (but not diagonal) wedges supported by the Imatest Wedge module, which has manual region detection. |
 |
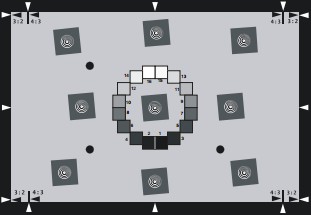
| 2014 Low contrast Edge SFR (E-SFR) test chart | Contains 9 slanted squares for slanted edge measurements. 4:1 contrast: much lower than the old ISO 12233:2000 chart (>40:1), which was found to cause problems with clipping and nonlinearities. This chart does not work with the highly automated Imatest eSFR ISO module, described below. For highly automated measurements (including squares near the corners, color patches, and wedges) we recommend one of the Imatest eSFR ISO charts shown below. These charts are fully compliant with ISO 12233:2017 and ISO 12233:2023, respectively. Note: ISO 12233:2014 has the same chart requirement. |
 |
| 2014 Sine-based SFR test chart |
Siemens star chart Supported by the Imatest Star Chart module. Optional automatic region detection is available when used with a star pattern that has registration marks on the sides of the image. |
 |
| 2000 Legacy ISO-12233 chart |
2000 Version The old high-contrast ISO 12233 chart, shown on the right, is referenced in the ISO 12233:2000 standard but is no longer a part of the standard. It should only be used when results need to be compared with older work. |
 |
ISO 12233 Sharpness Analysis
Sharpness is derived from edges at the boundaries of the slanted squares, as described in Sharpness: What is it and how is it measured? eSFR ISO can handle a wide range of camera aspect ratios; the left and right sides of the chart may extend beyond the frame or be well inside it.
The Imatest Standard eSFR chart is very close to the chart illustrated in the ISO 12233:2017 standard document, with a few minor differences that maintain compliance with the standard.
- There are four registration (fiduciary) marks instead of three. An additional black circle, just above the lower-left registration mark, is used to detect orientation. This change was made because the projective transformation used for automated region detection requires four points. Annex C, Table C.1, row I of the standard states, "Asymmetric features for automatic target detection. These features should be placed within the 4:3 active area aspect ratio, but may be placed for convenience as dictated by use cases."
- The focus-aid patterns in the center of the squares are different from the patterns illustrated in the ISO standard document (which are not described in the standard): they are square (which allows more room for the slanted-edge regions used for measuring sharpness), and they have been designed to minimize interference with automatic region detection. They have no effect on measurement results.
- A 20-patch OECF gray scale pattern is used. Annex C states, "The test chart also includes grey scale patches which are used to determine the OECF. While the example chart in Figure C1 uses 16 OECF test patches; a 20 patch version as described in ISO 14524 may also be substituted."
The enhanced and extended charts add features to regions of the chart that are not specified by the ISO standard (but don't violate it), and which will be valuable to most users.
| Chart type | Features | Notes |
| Standard | Closest to chart illustrated in the standard document. No added features. | Cannot measure sharpness near the sides or edges of the image. Use only if required. The Enhanced or Extended charts are recommended for most purposes. |
| Enhanced | 3:2 aspect ratio. 6 added squares on sides; several added hyperbolic wedges; 16 added color patches in Imatest-produced inkjet and 8x10 inch LVT charts. | Best for 4:3 or 3:2 aspect ratios (camera phones, compact cameras, DSLRs) Includes several hyperbolic wedges with properties similar to the ISO (CIPA) visual resolution test chart, which is supported (with manual ROI detection) by the Imatest Wedge module. |
| Extended | 16:9 aspect ratio. Same added features as enhanced chart. | Best for cameras with 3:2 or 16:9 aspect ratios (DSLRs, HDTV and cinema formats) |
| Options | Notes | |
|---|---|---|
| Chart aspect ratio | 3:2 (Standard & Enhanced) or 16:9 (Extended) |
3:2 charts (Standard and Enhanced) are well-suited for DSLRs (3:2 aspect ratio) and compact digital cameras and camera phones (4:3 aspect ratio). The 16:9 (Extended) chart is well-suited for HDTV (16:9 aspect ratio) and for DSLRs (3:2 aspect ratio). |
| Contrast |
4:1 only | 4:1 contrast is specified in the new ISO 12233:2014 (and 2017) standard. |
| Grayscale stepchart |
Included (below center) | A 20-patch ISO 14524 circular grayscale pattern is included. |
| Color chart | 16 patches | Included in all inkjet-printed Enhanced and Extended inkjet charts (all sizes) and in LVT film charts (up to 8x10 inches) produced by Imatest. (Will not be available on reflective photographic charts, which are not yet available.) |
| Pre-distorted |
Undistorted (standard), two standard levels of pre-distortion, custom pre-distortion |
Pincushion pre-distortion is available for use with fisheye (strongly barrel-distorted) lenses. Available in matte surface only. See Pre-distorted SFRplus and eSFR ISO charts for Fisheye Lenses. |
| Extra wedges | Standard (4 wedge pairs), Extra wedges |
Standard Enhanced and Extended charts have 4 pairs of low and high frequency wedges. The version with extra wedges has at least 12 additional high frequency wedges: 4 near the center, 8 near the corners. |
| Media (Surface) |
Matte inkjet |
Semigloss inkjet is slightly sharper and has a more accurate grayscale in the deep tones (print densities > 1.5) than matte inkjet, but is more susceptible to glare (specular reflections), especially with wide angle lenses. Matte surface is recommended for wide angle lenses. Photographic charts (reflective and LVT film transmissive) are much finer than inkjet: the same size chart is capable of analyzing much higher resolution cameras. |
The Imatest eSFR ISO module
The new Imatest eSFR ISO module performs highly automated measurements of several key image quality factors using versions of the new ISO 12233:2017 E-SFR (Edge SFR) test chart that may be purchased from the Imatest store (recommended) or printed on a high-quality inkjet printer. Unlike most other Imatest modules (except for SFRplus, which it closely resembles), the user does not need to manually select Regions of Interest (ROIs). Image quality factors include:
- Sharpness: expressed as Spatial Frequency Response (SFR) and also known as Modulation Transfer Function (MTF).
- Noise: measured from the grayscale patches surrounding the center of the chart, includes all types of noise calculated by Multicharts and Multitest (standard pixel noise, chroma noise, scene-referenced noise, sensor (raw) noise, and ISO-15739 visual noise). SNR (Signal-to-Noise Ratio) can also be displayed as a ratio or in dB.
- Lateral Chromatic Aberration
- Distortion (with less detail than the Distortion module). Details in SFRplus Distortion and Field of View measurements.
- Tonal response (with less detail than Stepchart; no noise statistics yet).
- Color accuracy, when used with an eSFR ISO chart that contains the optional color pattern, located above the central square.
- ISO sensitivity (Saturation-based and Standard Output Sensitivity), when incident lux is entered.
- Onset of aliasing and Moiré, measured from the four pairs of wedges in the Enhanced and Extended charts, whose spatial frequency range is the same as the separate ISO 12233:2017 wedge chart. Figures and results are identical to the Wedge module.
All chart features— slanted-edges, grayscale patches, color patches, and wedges— are located automatically.
eSFR ISO operates in two modes:
- Interactive/setup mode (run by pressing Rescharts or in the Imatest main window), which allows you to select settings and interactively examine results in detail.
- Auto mode (run by pressing in the Imatest main window), which runs automatically with no additional user input. ROIs are located automatically based on settings saved from the interactive/setup mode. This allows images of different sizes and framing to be analyzed with no change of settings. Auto mode works with large batches of files, and is especially useful for automated testing, where framing may vary from image to image.
Click on any of the thumbnails below (or on the image itself, repeatedly) to explore some of the many capabilities of eSFR ISO. Note the description below the image. Results are described in more detail in eSFR ISO Part 3.
[portfolio_slideshow id=8277 pagerpos=top width=720 height=600 centered=true navpos=disabled thumbnailsize=92 thumbnailmargin=6]
Imatest and ISO Standard 12233 calculation options
New in Version 22.1 – an Imatest/ISO Standard SFR dropdown menu is located on the lower left of slanted-edge More Settings window. (This option was formerly a checkbox for “ISO compatible” calculations),
This new dropdown allows you to choose between Imatest and ISO-compliant calculations. There are now four options that can be used for SFR Settings to control the Edge SFR Algorithm.
- Imatest pre-22.1 – this option maintains the pre-22.1 Imatest SFR calculations, which are based on ISO 12233:2017, with 3rd order polynomial curved edge fitting, LSF Correction Factor and a correction factor for the angle of the edge.
- ISO 12233:2017 & earlier – implements the 12233:2017 algorithm with Hamming window and linear edge fitting.
- Imatest 22.1 (recommended) – Our recommended calculation, based on the ISO 12233:2024 standard, but with a lowpass filter use to locate the edge which makes it function in noisier images. Uses the Tukey window (alpha=1), 5th order polynomial edge fitting, LSF Correction Factor and a correction factor for the angle of the edge
- ISO 12233:2024 – implements the current 12233:2024 algorithm, uses a centroid to detect the edge which is sensitive to noise. Uses the Tukey window (alpha=1), 5th order polynomial edge fitting, LSF Correction Factor and a correction factor for the angle of the edge
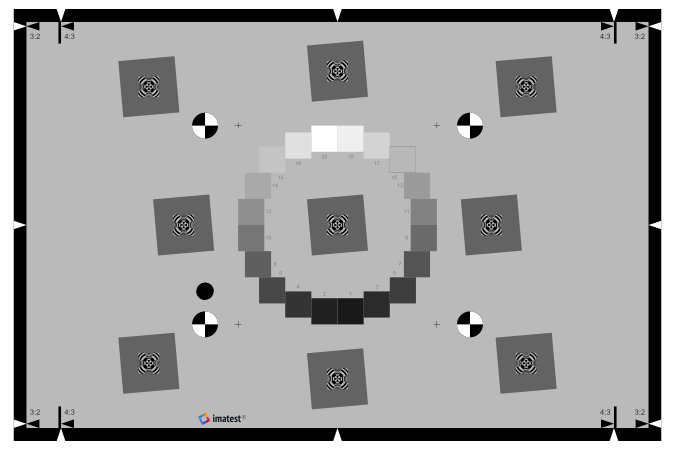
Advantages of the ISO 12233:2023 Edge SFR chart
over the old ISO 12233:2017 chart
-
The 2014/2017 "slanted square" test pattern has been replaced with the "four-cycle slanted star" test pattern to provide supplementary sagittal and tangential SFR measurements, in addition to vertical and horizontal measurements.
- 2 additional color patches have been added to the 2023 chart, which correspond to patches 8 and 12 of row 2 in a 24 patch Colorchecker.
- Logarithmic wedges that work across a a wide range of resolutions are now standard, rather than hyperbolic or linear.
Advantages of the ISO 12233:2017 Edge SFR chart
over the old ISO 12233:2000 chart
Note: the old ISO 12233:2000 standard and chart, shown on the right, is referenced in the new ISO 122433:2017 standard, but is no longer an official part of the standard. The new standard specifies three charts, one of which is a slanted-edge (Edge SFR or E-SFR) chart with much lower contrast (4:1; shown on the right, below).
Compared to the old ISO 12233 chart:
- The new eSFR ISO chart has much less wasted area, especially in the Enhanced and Extended versions. About 90% of the old ISO chart is covered with patterns that have little value for computer analysis.
- You can produce a detailed map of sharpness (MTF) over the image surface with the Enhanced and Extended charts. This cannot be done with the old ISO chart because there are not enough suitable edges— and they are not well-located.
-
 ISO 12233:2017 Edge SFR chart
Automated region detection, based on location criteria you enter. This makes the eSFR ISO chart and module well-suited for automated testing: with the old ISO chart, regions of interest (ROIs) had to be selected carefully whenever the image framing changed, even slightly.
- The 4:1 contrast edges are less likely to clip than the edges in the old ISO chart, whose contrast is specified at ≥ 40:1. The camera operates in a more linear region, and hence results are more consistent and accurate— less affected by overexposure, underexposure, incorrect gamma estimate, or excessive software sharpening. 4:1 contrast edges are also more representative of real edges that affect perceived image sharpness.
- eSFR ISO can measure additional image quality factors, including lateral chromatic aberration, distortion, gamma (contrast), tonal response and color accuracy (in charts that have the color pattern).
- The old ISO 12233:2000 chart contains no information that can be used to measure gamma (the average slope of the Log pixel vs. log exposure curve. i.e., the contrast), which is needed to linearize the image for the MTF calculation. Accurate gamma measurement is particularly important with high contrast targets. In the eSFR ISO chart, gamma can be derived either from the individual squares (which have a known 4:1 contrast) or from the grayscale step chart.
Compared to the SFRplus chart:
- The map of MTF over the image surface has less detail.
- Distortion measurements are slightly less accurate (especially for the Standard chart) because there are no distortion bars and there are fewer features for measuring distortion.
- A detailed noise analysis (including all the types of noise measured in Multicharts and Multitest) is available.
- A Wedge analysis (including onset of aliasing and Moiré) is available. The standard chart has 4 pairs of added wedges. A version of the chart with at least 12 extra wedges (4 near center, 8 near corners) is available.