We introduce the logarithmic wedge pattern, which has several advantages over the widely-used hyperbolic wedges found in ISO 12233 (current and older) and eSFR ISO charts.
The key advantage of logarithmic wedges is that charts with large fmax/fmin ratios work well for systems with a wide range of resolutions, unlike hyperbolic wedges, where large ratios cause high frequencies occupy excessive real estate and low frequencies to become highly compressed. The fmax/fmin ratio of the hyperbolic wedges in the ISO 12233/2017 chart is only 12.5:1 — insufficient for modern high resolution cameras.
With logarithmic wedges, ratios of 50:1 or greater are practical because frequency bands characterized by an fmax/fmin ratio (for example, 10:1 for decades or 2:1 for octaves) occupy the same amount of space, as they do in most frequency response curves and Bode plots. Frequency bands occupy neither too much nor too little space.
| Wedge type | Key feature | Comments |
| Hyperbolic | Frequency is linear with distance along the wedge. For large frequency ratios (fmax/fmin), high frequencies can occupy excessive real estate and low frequencies can become highly compressed. | Widely-used. Problematic when large fmax/fmin ratios are required. |
| Linear | Spacing is linear with distance. Since frequency is inversely related to distance, high frequencies occupy little area. | Only found in a few obsolete charts. Insufficient high frequency detail. |
| Logarithmic (new) |
Frequency decades or octaves occupy the same distance. Distance is proportional to log(frequency)— as it is in standard frequency response plots. | New in 2022. Very well suited for charts with large fmax/fmin ratios. Works well with a large range of camera resolutions. |
We begin by illustrating the hyperbolic wedge, using a portion of the eSFR ISO chart.
Hyperbolic wedges
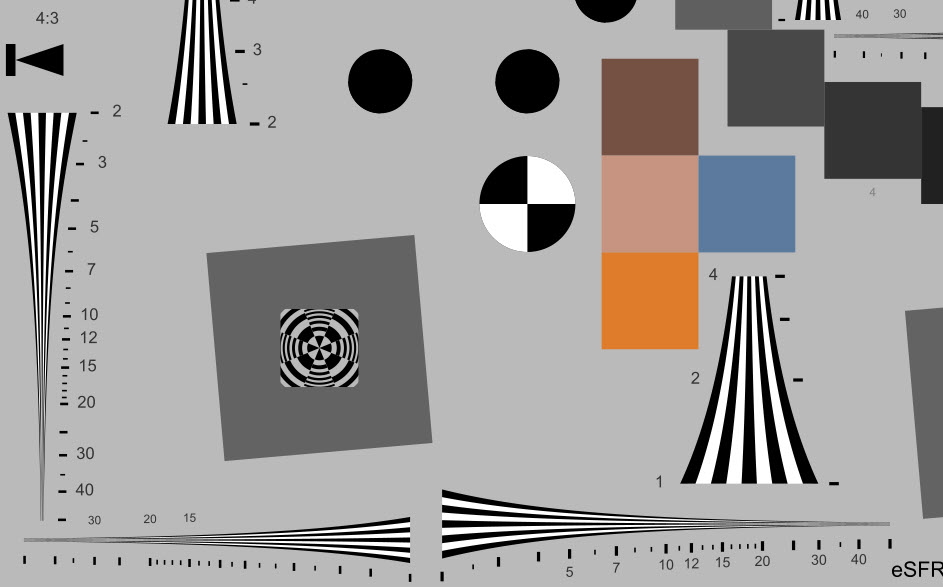
The first image shows several wedges in the standard eSFR ISO chart, which have a maximum frequency of 2500 Line Widths/Picture Height (LW/PH) when the chart is framed so the inside black borders are located at the top and bottom of the image. This scaling, indicated by the label “25”, has been used since ISO 12233:2000. Because 2500 LW/PH is inadequate for modern high resolution cameras, Imatest also offers a 4000 LW/PH chart. The frequency ratio for the high frequency wedges is 12.5:1. In practice it’s not necessary to frame the eSFR ISO chart in this way because Imatest derives wedge frequencies directly from the image.
 Crop of eSFR ISO chart with hyperbolic wedge maximum frequency 2500 LW/PH
|
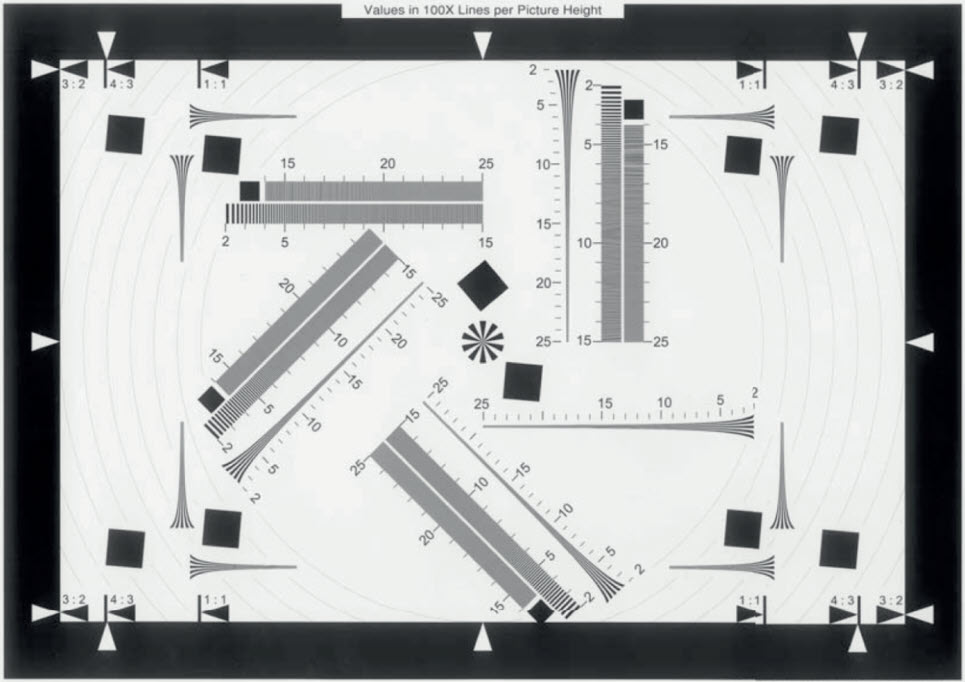
The CIPA Visual Resolution test chart from ISO 12233:2017 §5 and Annexes A and B is shown on the right, along with a slice of an eSFR ISO chart containing similar wedges. Both these charts have frequency labels in the larger wedges from 2 to 25 (a 12.5:1 ratio), representing 200 to 2500 LW/PH when the chart is framed so the inside black borders are located at the top and bottom of the image, as indicated above. For this framing, the wedge will not reach the Nyquist frequency (fNyq = 0.5 C/P) for image sensor heights larger than 2500 pixels (about 9.4MP for cameras with a 3:2 aspect ratio). Note that the height, not the width, of the wedge is significant. The ISO wedges were designed during digital photography’s distant past, when 10MP consumer cameras were a distant dream. They’re inadequate for recent high resolution cameras. |
 |
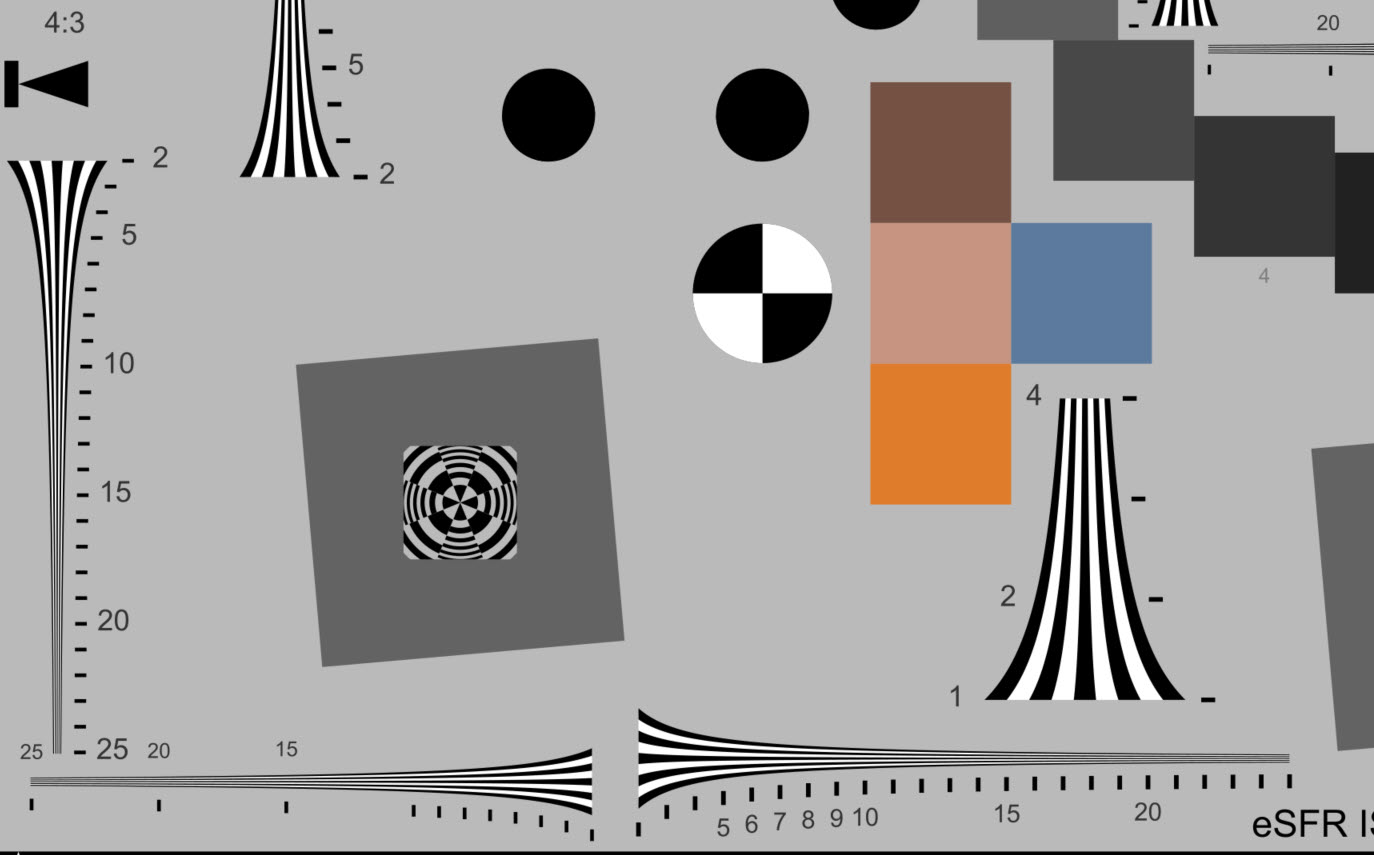
Because 2500 LW/PH wedges are inadequate for modern high-resolution cameras, we designed a version of the eSFR ISO chart, shown below, with a maximum frequency of 4000 LW/PH.
 Crop of eSFR ISO chart with hyperbolic wedge maximum frequency 4000 LW/PH
This chart had a problem with a relatively low resolution (720P) camera. Because the low frequencies are highly compressed and the image was blurry, there were not enough rows of distinct bars to reliably calculate the frequencies. Spatial frequencies between 2000 and 4000 LW/PH take up over half the wedge; much more than needed.
With hyperbolic wedges we need more than one pattern to accommodate the wide range of camera resolutions we typically see. A “one size fits all” pattern would be highly desirable. To get it we developed an eSFR ISO chart with…
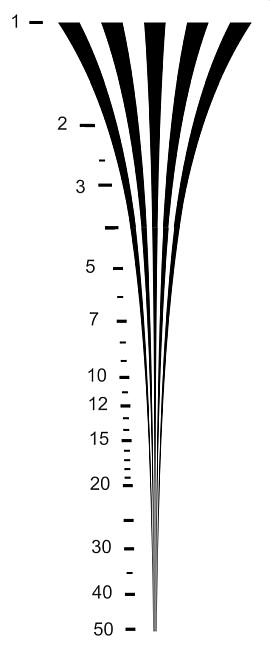
Logarithmic wedges
For logarithmic wedges, \(f = f_0 10^{k(x-x_0)}\), where f is spatial frequency, and \(f = f_0 \text{ at } x = x_0\) (the lowest spatial frequency).
For frequency f, \(x = x_0 + \log_{10}(f / f_0) / k\). A ratio of any two frequencies f2/f1 will occupy a constant distance \(10^{k(x_2-x_1)}\).
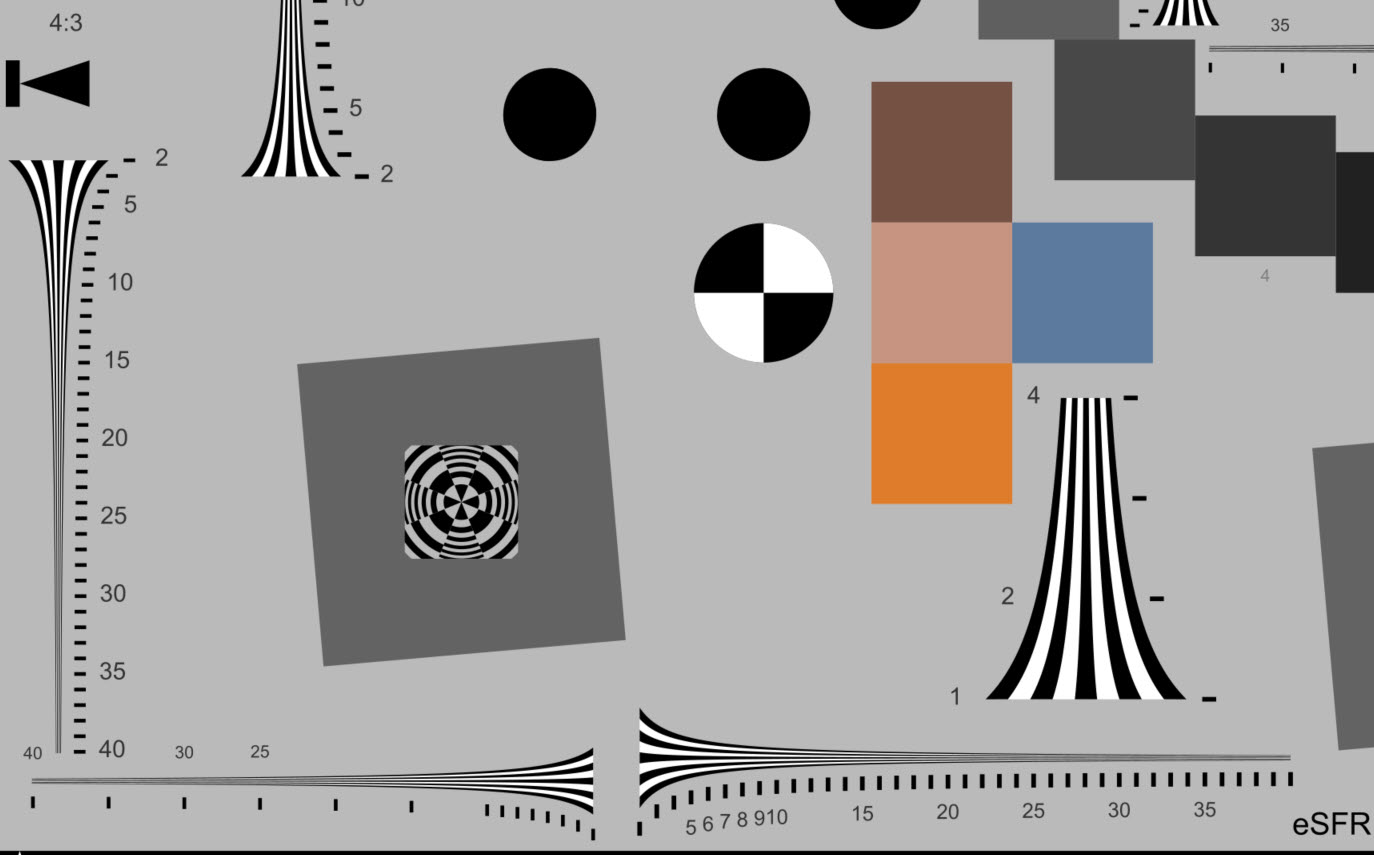
 Crop of eSFR ISO chart with logarithmic wedge maximum frequency 5000 LW/PH
Because this chart has an improved distribution of frequencies over the available space, with octaves (fmax/fmin ratios of 2:1) or decades (fmax/fmin ratios of 10:1) occupying the same amount of space, it avoids the two problems we experienced with hyperbolic wedges.
- The maximum frequency can be made very high without hogging excessive real estate. This makes it easy to design wedges for ultra-high resolution systems.
- Low frequencies increase slowly enough to comfortably accommodate low resolution images.
| Tick marks have increments of 1 between 3 and 20 (100× for LW/PH). This is intended to facilitate visual analysis of patterns that don’t have labels by making it easy to locate 20 (2000 LW/PH) — where the tick mark spacing abruptly changes. |
Trapezoidal edges, which consist of converging straight lines, are rarely used in modern charts because they have relatively little real estate for the important high frequencies. If you’re old enough, you might remember seeing them in TV test patterns. Since they’re rarely used in modern test charts, we won’t discuss them further.
Results
Starting with 2021.2, Imatest automatically detects the wedge type— hyperbolic or logarithmic. We present results for synthesized images of the 4000 LW/PH hyperbolic wedge and the 5000 LW/PH logarithmic wedge. 3200×1800 pixel Extended eSFR ISO charts with hyperbolic and logarithmic wedges were created with Imatest Test Charts, converted to bitmaps in Inkscape, then blurred (Gaussian filter 1 = 0.7 sigma) with a little noise added (0.0005 sigma, 0.5 luma fraction) in Imatest Image Processing.
Note that for the 1800 pixel high image, Nyquist frequency (always 0.5 Cycles/Pixel) = 1800 Line Widths per Picture Height. The difference in appearance for the two wedge types is more prominent in high frequency the wedges on the right, below. (The difference is less obvious for the low frequency wedges, which have a frequency ratio of only 4:1).
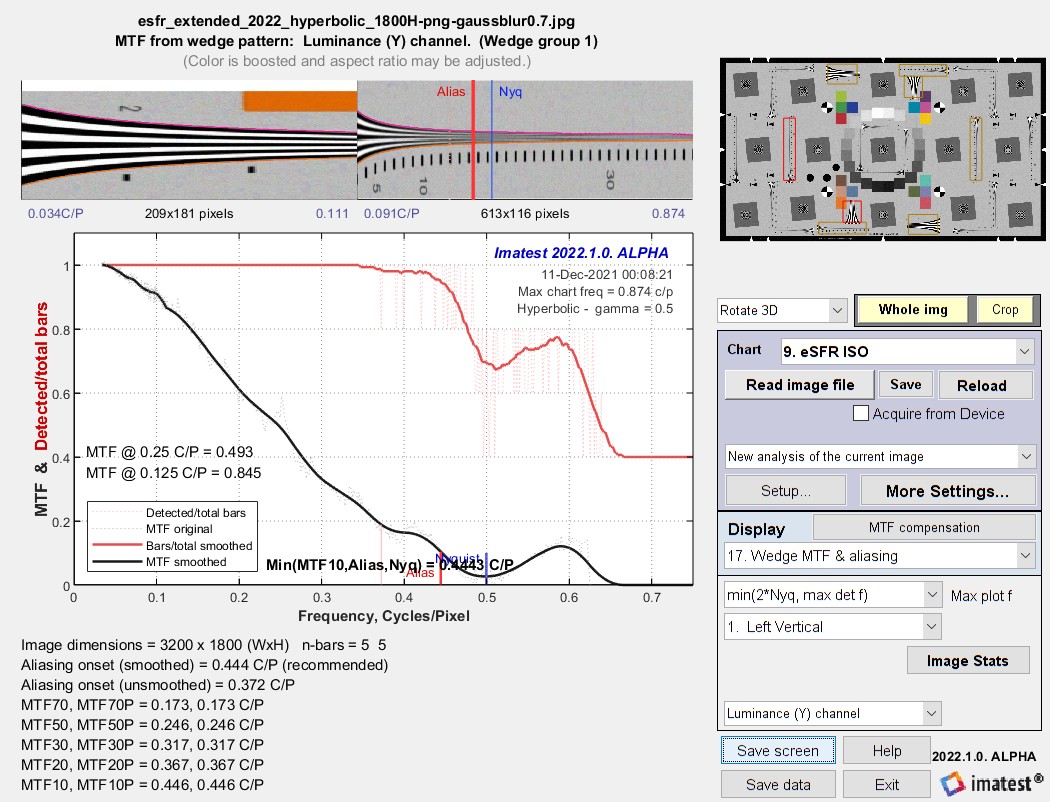 Results for the hyperbolic wedge
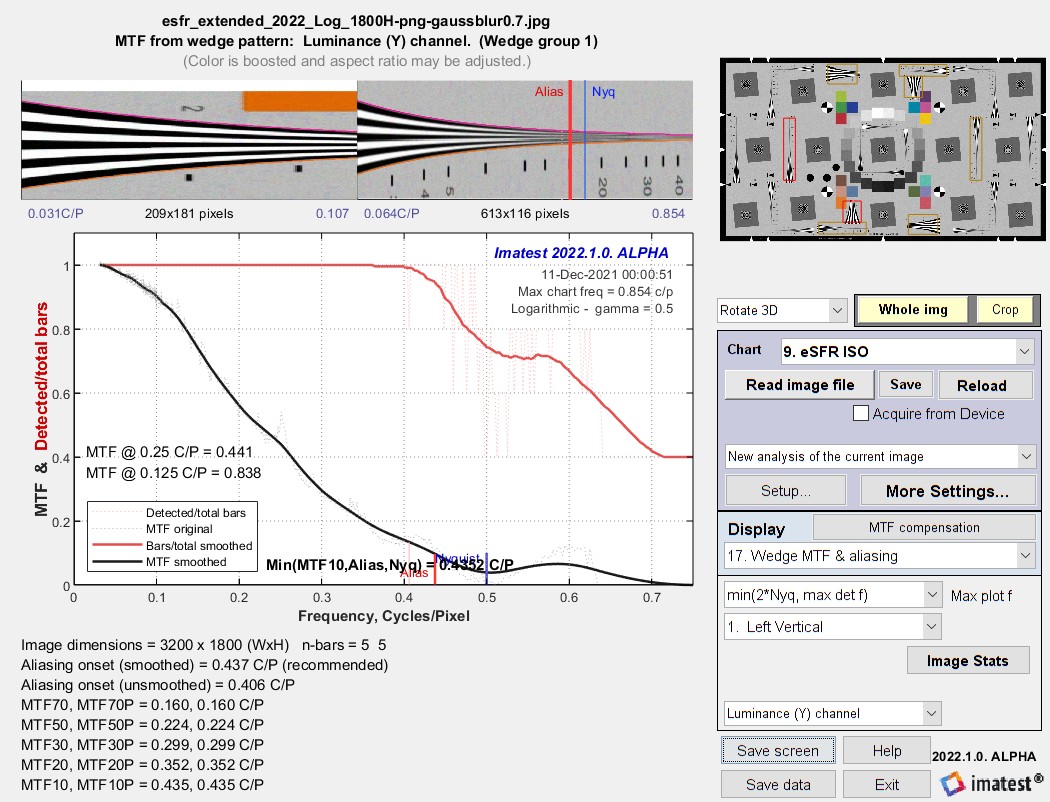
Results for the logarithmic wedge
The results are very close: nearly identical except for some details (like a strange boost around 0.55 to 0.6 C/P), which is outside the range of important measurements. The main causes of the differences are noise and phase of the bars. Wedges tend to produce less consistent MTF measurements than slanted-edges.
Summary
Logarithmic wedges have two closely-related advantages: (1) they allow the design of high ratio fmax/fmin charts where low frequencies aren’t overly compressed and high frequencies don’t occupy excessive area, and (2) they accommodate a wide range of image resolutions from very low to very high. This is the result of their improved distribution of frequencies— similar to standard frequency response plots.
Here is an example from the original version of the 12233:2000 chart (designed back in the day when 2MP was “high” resolution). It has two wedges covering frequencies from 100-2000 LW/PH — inadequate for modern high resolution cameras. The two wedges could be replaced by a single wedge with frequencies from 100-5000 (or greater) LW/PH, shown on the right.
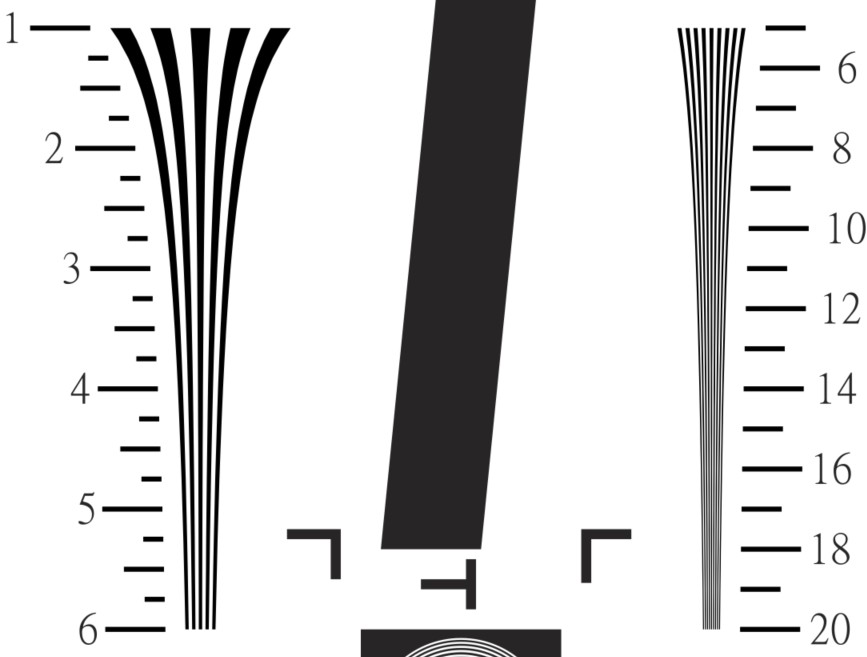 Segment of ISO 12233:2000 chart showing two hyperbolic wedges, 100-600 and 500-2000 LW/PH |
 Logarithmic wedge, 100-5000 LW/PH |