| Standard: | ISO 15739:2017 — Photography — Electronic still-picture imaging— Noise measurements |
| Technical Committee: | ISO/TC 42 Photography |
| Published: | 2017-05 |
The Simplified ISO-15739 digital camera noise test chart is available from the Imatest Store. This chart can be analyzed by the Imatest Stepchart, Multicharts, and Multitest modules.
Imatest 4.0+ includes a calculation of ISO 15739 visual noise as specified in Appendix B of the ISO 15739:2017 standard. And Imatest 4.4+ includes a calculation of visual noise from the IEEE CPIQ P1858 (Camera Phone Image Quality) 2016 specification, which is based on ISO 15739 with some added details. These are relatively complex calculations that include the effects of the human visual system. It is performed for all grayscale patches for up to three viewing conditions (viewpoints), each of which is specified by viewing distance and display (picture) height. The vertical display angle (in degrees) is
Viewing angle = 360/pi*atan(.5*picture height/viewing distance)
We summarize the calculation in the table below. Details can be found in the ISO 15739:2017 standard, Appendix B and in the IEEE CPIQ P1858 (Camera Phone Image Quality) 2016 specification.
| ISO | CPIQ | Step | Description |
| B.2.1 | D.1 D.2 |
RGB to XYZ(E) | Convert RGB to XYZ values for illuminant E, typically by converting RGB to XYZ(D65), then converting from XYZ(D65) to XYZ(E). Though the standard specified sRGB color space (the Windows/internet standard), Imatest can work with any color space. See en.wikipedia.org/wiki/CIE_1931_color_space. |
| B.2.2 | D.4 | XYZ(E) into opponent space AC1C2 | A relatively straightforward matrix operation. |
| B.2.3 | Discrete Fourier Transform | Transform A, C1, C2 into Fourier space (cycles/pixel). | |
| B.2.4 | D.6 | Apply the contrast sensitivity function (CSF) | There are three functions: for A (identical to luminance Y), C1, and C2. Viewing conditions are used here (f in cycles/degree is calculated from the vertical pixel count and angle). |
| D.7 | Apply Display/Printer MTF. | ||
| D.8 | High Pass FIlter (HPF) | Cutoff < 1 cycle/degree. DC (calculated prior to the filter) is restored after the filter. | |
| B.2.5 | Inverse Fourier Transform | Back to A, C1, C2. | |
| B.2.6 | D.10 | Opponent space AC1C2 into XYZ(E) |
A relatively straightforward matrix operation. |
| B.2.7 | XYZ(E) to XYZ(D65) | Another relatively straightforward matrix operation. | |
| B.2.8 | XYZ(D65) to L*u*v* | CIELUV (L*u*v*) is a relatively perceptually uniform color representation that remains relatively unfamiliar. L* is nonlinear: proportional to brightness to the 1/3 power. Note that this is a filteredspace (not plain L*u*v*). | |
| D.12 | XYZ(D65) to L*a*b* (CIE Lab) |
Numbers seem to be similar to the L*u*v* numbers from ISO 15739. | |
| B.2.9 | Standard deviation for each grey patch | The noise for each (L*, u*, v*) channel is the standard deviation of the levels for the patch. | |
| B.2.10 | Weighted sum representing the visual noise | V = σL* + 0.852 σu* + 0.323 σv* | |
| D.13 | Objective noise (CPIQ) | Ω = log10[1 + 23.0 σ2(L*) + 4.24 σ2(a*) – 5.47 σ2(b*) + 4.77 σ2(L* a*) |
Rube Goldberg would have been impressed. His spirit is with us.
Noise settings window
To adjust visual noise settings
- In Color/Tone Interactive, click Settings… (on the right). This opens the Color/Tone Settings window, which has a Noise & Dyn Rng section in the middle that contains several settings. Click on Visual noise settings.
- In Color/Tone Auto, open the image, then press Continue (not express), or from the Imatest main window, click Settings (just below the Color/Tone Auto chart selection), then click Noise & Visual noise settings.
- In eSFR ISO (run from Rescharts or eSFR ISO Setup), click the More settings button, then the eSFR ISO Noise settings button, or click on the Settings dropdown menu, Noise & Visual noise settings…
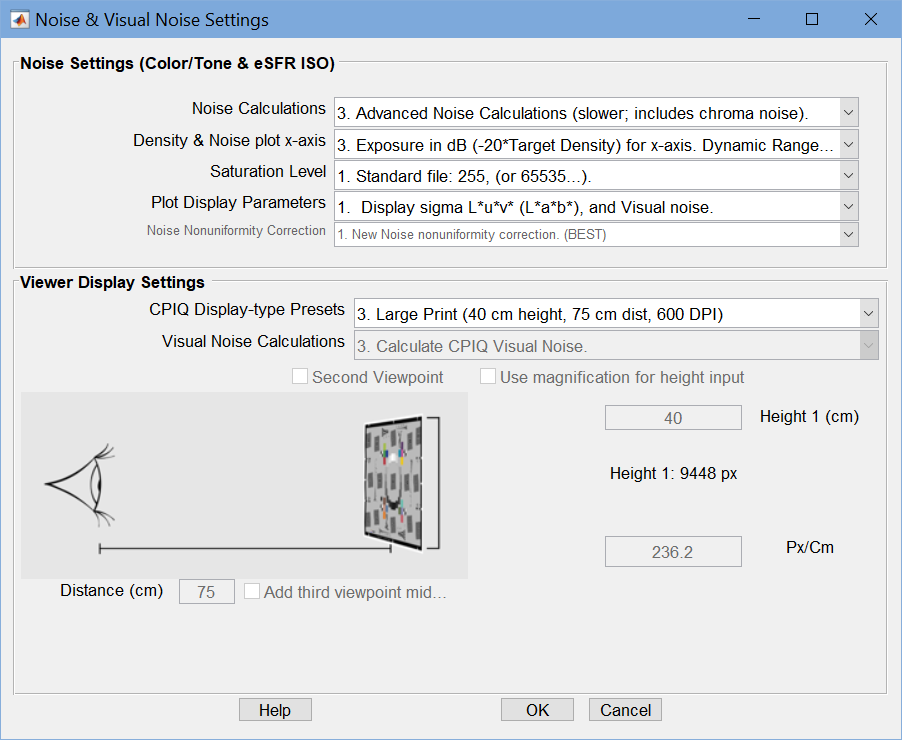
These selections open the Noise and Visual Noise Settings window, shown on the right.
Noise Settings (Color/Tone…) near the top are for noise in general.
Except for Plot Display Parameters, settings are repeated from the Settings window.
- Noise Calculations – refers to non-visual noise: 1. None (fastest), 2. Elementary, and 3. Advanced (slowest). 2. Elementary is a good choice for most applications.
- Density & Noise plot x-axis – is relatively self-explanatory
- Saturation level – is significant when the saturation differs from the maximum for the bit depth (65535 for bit depth = 16, etc.), for example, when 12-bit data is stored in a 16-bit file.
- Plot Display Parameters – lets you choose which of the results (combinations of L*, u*, v*, and Visual noise) to display. When all are chosen, the plot is cluttered.
- Noise nonuniformity correction – Setting 1 is recommended because it compensates for nonuniform illumination, so it isn’t mistaken for noise.
Viewer Display Settings are for Visual noise.
Visual noise requires a viewpoint, which consists of display height, viewing distance, and device resolution in pixels/cm. The viewing angle is calculated from the distance and height.
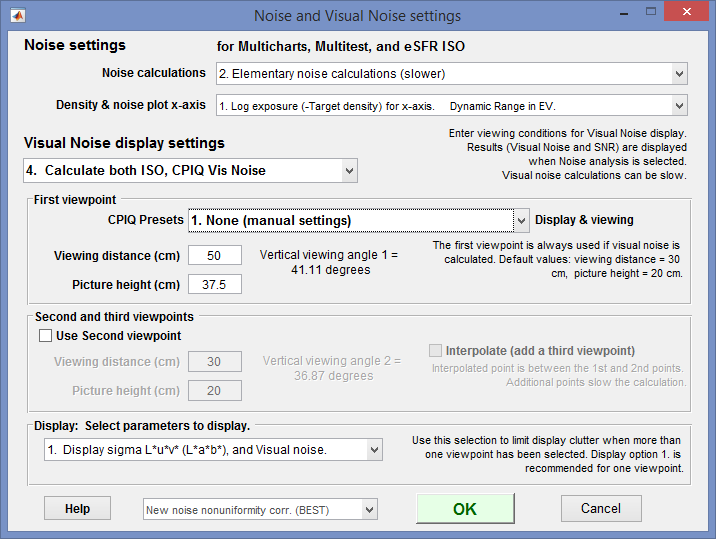
Older noise settings (no longer active)
CPIQ Display-type Presents contains 6 settings:
1 is for None (manual settings; no preset). You need to enter the viewpoint (Height, Px/CM, Distance Cm), and you can add one or two additional viewpoints. If a second viewpoint has been entered, you can select a third, which will be halfway between the first two viewpoints. You can also select Visual Noise Calculations, which is disabled (always set to 3. CPIQ) for presets 2-6.
2-6 are presets for a for several displays: 2. Small print, 3. Large print, 4. Computer monitor, 5. Small cell phone, and 6. UHD TV. Details are in the dropdowns. Height, Px/Cm, and Distance are disabled and contain the preset settings. Visual Noise Calculations is set to 3. Calculate CPIQ Visual Noise, even if the input setting is different. Use 1. None (…) to select a different setting or keep the input setting.
Because visual noise is expressed as the standard deviations of the L*, u*, and v* channels, whose scaling is unfamiliar to most engineers and scientists, Imatest offers three displays of visual noise: one of the noise itself and two of signal-to-noise ratios (expressed as a fraction and as decibels (dB)).
16. ISO 15739 Visual Noise (L*u*v*)
17. ISO 15739 Visual S/N (L*u*v*) S/N (Signal-to-Noise Ratio, as a fraction)
18. ISO 15739 Visual SNR dB (L*u*v*) SNR dB (Signal-to-Noise Ratio in decibels (dB) = 20*log10(fraction))
We present two examples. The first is for an X-Rite Colorchecker for three viewpoints. All results are presented. (The plot is somewhat cluttered, but still readable).
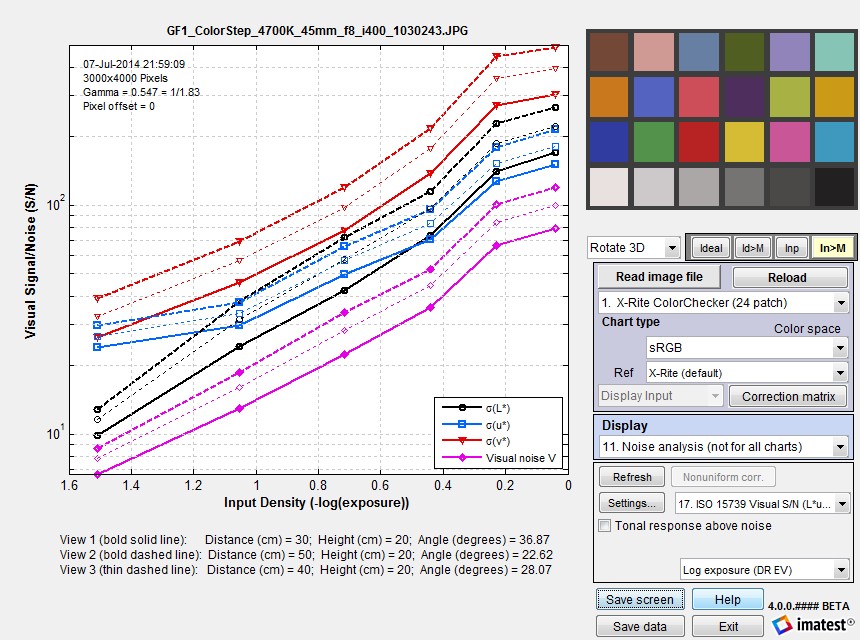
Visual SNR (Signal / Noise) for three viewpoints for an X-Rite Colorchecker.
On the y-axis, 101 corresponds to 20 dB; 102 corresponds to 40 dB.
The second example shows L* noise (σL*) and total visual noise (V) for the same three viewpoints for the Imatest 36-patch Dynamic Range chart. The absolute numbers are somewhat difficult to interpret due to their unfamiliarity: that’s why Imatest also displays Signal-to-Noise Ratios (as fractions and in dB). Noise levels for input densities above (to the left of) 2.0 or 2.5 have little meaning because the image is nearly black (though these levels may be increased by tone-mapping or digital “dodging”).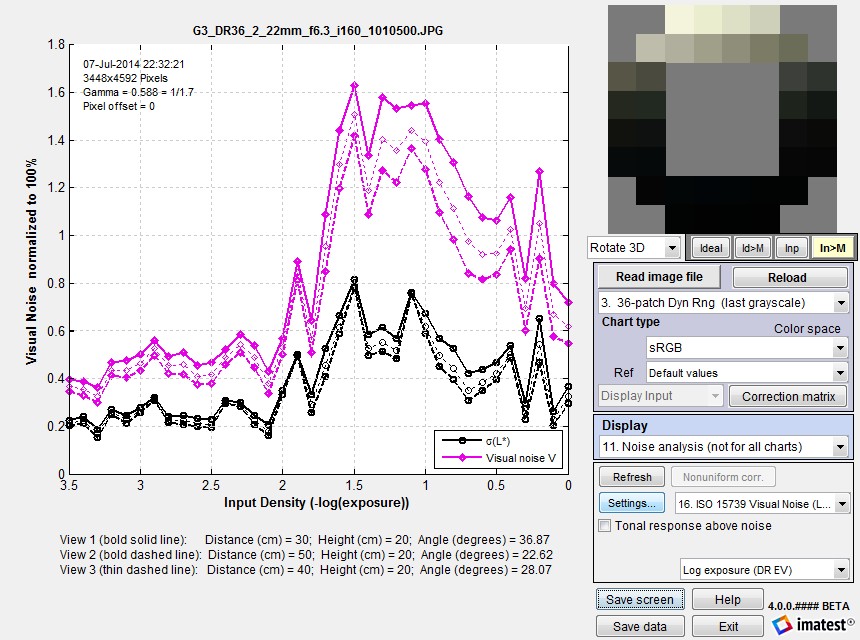
Visual noise for three viewpoints for the Imatest 36-patch Dynamic Range chart.
ISO 15739 SNR and Dynamic Range
The ISO 15739 Dynamic Range (DR) calculation allows DR to be estimated from a patch with density = 2.0, which is available on many semigloss reflective test charts (though density = 2— where 1/100 of the incident light is reflected— cannot be achieved with matte media.
Notes on ISO 15739 SNR and Dynamic Range calculations
- These calculations, which are described in sections 6.2 and 6.3 and Annex D of the ISO 15739:2017 Standard, are completely independent of the ISO 15739 Visual Noise measurements, described in Annex B.
- Imatest’s ISO 15739 SNR calculation is primarily for total SNR (§6.2.3). We may add temporal SNR in the future, but if we do, temporal noise will be calculated from the difference of two images (divided by √2), which is a simpler approach than the one recommended (and nearly as accurate). Fixed pattern noise can be measured by averaging at least 8 identical images (by reading multiple images and specifying signal averaging).
|
The definition of Signal-to-Noise Ratio (from §6.2.3-6.2.5 and Annex D of the ISO 15739 Standard) is SNR = Q = g L / σ where σ = noise in pixels, L = luminance (linear), and g is the first derivative of the OECF (the pixel level I vs. luminance curve). g = dI/dL Luminance L is derived from test chart patch density d (which is equal to (-)log exposure): L = 10–d. The numeric formula for calculating g is given in Annex D. (Pixel level I and Luminance L are smoothed prior to calculating g, with a kernel of 3 or 5 points for <7 or ≥7 patches, respectively.) Though it isn’t obvious from the standard, L must be scaled (multiplied) by reference luminance Lref, as defined in §6.2.2. The definition of Lref is not entirely self-consistent, but it appears that Lref is the luminance that corresponds to a linear pixel level of 91% of the clipping level. For gamma-encoded images with bit depth N, where gamma (γ) is measured from the grayscale patches in the image, this corresponds to a pixel level of Iref = (2N-1)*0.91γ . For standard color space (sRGB) images where γ ≅ 1/2.2 = 0.4545 and N = 8, Iref = 255*0.91(1/2.2) = 244.3 This is close enough to the pixel value of 245 cited in the standard. If the maximum grayscale pixel level is greater than Iref, Lref can be found by interpolation. If the maximum grayscale pixel level is lower than Iref, the pixel curve is extended using the measured value of gamma, to find Lref. SNR (Q) is reported at a luminance of 0.13*Lref. This SNR value and the corresponding input density are reported in the lower plot as ISO SNR = Q = … @ Inp Density = … Dynamic range is defined as DR = Lsat/Lmin where Lsat is the saturation luminance (we take the luminance where pixel level = 0.995 of saturation), and Lmin is the luminance where SNR = 1. Since this low SNR level may not be reached (especially with reflective charts) the standard allows Lmin to be estimated (by extrapolation) as Lmin =σ(d=2)/g(d=2). Though we trust this calculation less than a direct measurement, we have found that is it very close in practice. In the plot below (for a JPEG image from the Panasonic G3 at ISO 160), DR(d=2.04) = 3.31 density units; DR(SNR=1) is not measured because the minimum SNR > 1. The Imatest (1/f-stop) scene-referenced DR, shown above (plot 14), is approximately 3.5 (SNR comes very close to 1). |
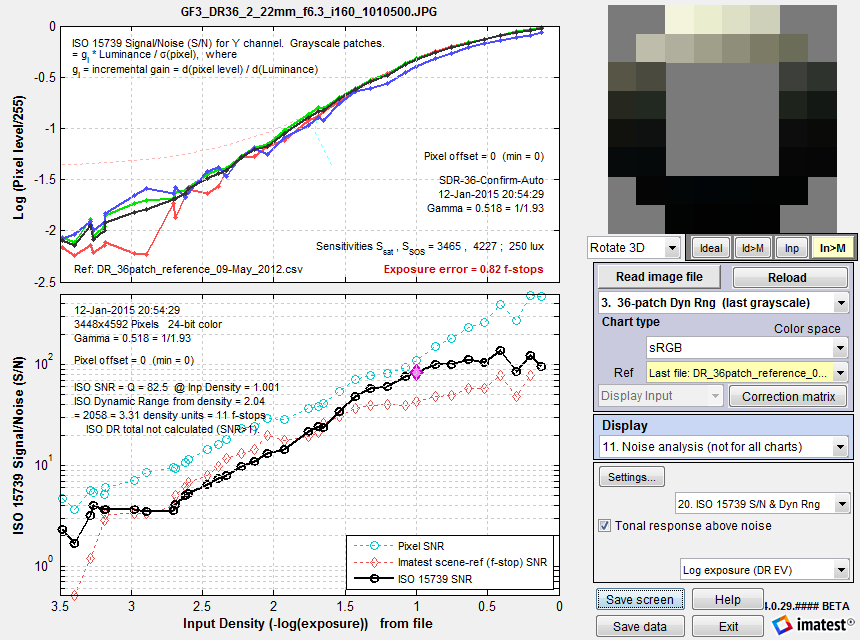
ISO 15739 SNR (S/N) for the Imatest 36-patch Dynamic Range chart.
Plain pixel S/N (plot 2) in Cyan; Imatest (f-stop) scene-referenced S/N (plot 14) in Red.
When ISO 15739 SNR is displayed in Multicharts, Multitest, or eSFR ISO, it is compared with the older Imatest f-stop-based calculation. Dynamic Range results tend to be fairly similar. The ISO calculation has two advantages. 1. It conforms to a standard and 2. it allows Dynamic Range to be calculated from SNR for a patch with density near 2— which is achievable with (semigloss) reflective media. This calculation uses extrapolation, which is less direct than finding the density where SNR = 1 (which generally requires transmissive media or several exposures). But in our experience it produces useful results that are close enough to the direct measurement for practical work, i.e., for comparing different cameras in a standardized way.
