Introduction – Incident light measurement – Modules – Equations – RAW files
Saturation-Based – Standard Output – Related documents
Introduction
ISO Sensitivity (or ISO speed) is a measure of how strongly an image sensor and/or camera responds to light. The higher the sensitivity, the less light (smaller aperture and/or shorter exposure time) required to capture a good quality image. Unfortunately there are several measures of Sensitivity, and they are not consistent. Imatest calculates two of them: Saturation-based ISO sensitivity and Standard Output Sensitivity.
Exposure Index (EI) is a camera setting derived from one or more of the Sensitivity measurements. It is used to determine the camera’s exposure in response to a light level measurement. Exposure Index and Sensitivity are closely related and sometimes used interchangeably, but should be kept distinct. For example, one might say, “The camera’s Saturation-based ISO sensitivity is 80 when the Exposure Index is set to 100.”
Increasing the Exposure Index
- increases the (analog) gain at the image sensor output, prior to digitization (A-to-D conversion), allowing the camera to operate with less light,
- increases noise, degrading overall image quality,
- causes the system to saturate at lower light levels (though the light level that saturates the sensor is unchanged), increasing both sensitivity measurements. Measurements are most representative of the sensor when the camera is set to its minimum EI (though it may not be perfectly representative if the system saturates— reaches maximum pixel level— before the sensor itself saturates).
The following table summarizes the two sensitivity measurements supported by Imatest.
|
Saturation-based and Standard Output Sensitivity
|
||
| Saturation-based Sensitivity Ssat | Standard Output Sensitivity SSOS | |
| Measures | Sensitivity relative to the luminance level that saturates the sensor or system.When the image is exposed for a region with 18% reflectance with EI derived from Ssat, a luminance equivalent to 141% reflectance will saturate the system (41% headroom). | Sensitivity that results in a standard output level for the region used to determine the exposure.Exposure is typically based on a gray region with 18% (0.18) reflectance. The Standard Output level is a normalized pixel level = 0.18encoding gamma, i.e., pixel level = 116 (out of 255 maximum) for encoding gamma = 1/2.2. |
| Affected by | Sensor saturation level and analog gain prior to A-to-D conversion (set by the camera’s EI setting). Not affected by the tonal response curve (TRC). | All signal processing factors, especially the “shoulder” of the TRC applied during RAW conversion to reduce likelihood of sensor saturation. A TRC shoulder tends to increase SSOS. |
| Measurement accuracy | About ±10%. Best with straight gamma encoding (no shoulder), which can be obtained by decoding the RAW image with dcraw). May be decreased by a “shoulder” in the TRC. Degraded by underexposure. Improved by slight to moderate overexposure (lightest patch at or near saturation). | About ±10%. Since SSOS includes the effects of signal processing (the TRC, etc.) measurement accuracy is not affected by the TRC. But it may be degraded by “adaptive” processing, where different parts of the image are processed differently. |
| Origin | Original ISO-12232 standard (1997) | CIPA DC-004 (2004) |
|
INCIDENT LIGHT (ILLUMINANCE) MEASUREMENT (Corrected Dec. 2, 2025) Reflective charts: Incident light (illuminance) measurement (I in units of Lux) is relatively straightforward. Place an incident illumination meter, preferably with a flat diffuser, just in front of the chart, pointed towards the camera (parallel to the chart), making sure not to block any of the illumination. Use the Lux measurement directly. Transmissive charts: These are not so straightforward: incident Lux measurements are not appropriate. For this application, you need to measure the luminance of either
To measure the equivalent illuminance (I) on a patch of density ρ on a (nearly) Lambertian lightbox, use the equation, L = ρI/π, or I = πL/ρ, where L is the luminance measured on the patch. To obtain I directly from the lightbox luminance (i.e., without the chart), remove ρ from the equation (ρ = 1). For measuring the luminance of transmissive charts that have density reference files (for calculations other than Exposure Index), note that the measured reference file densities include the base density. If you measure the Luminance of the lightbox without the chart, apply the equation, Patch Luminance = Lightbox Luminance * 10(–patch density). Useful equation: If your meter reads in EV (Exposure Value): \( L \text{ (Lux)} = 2.5 (2^{EV})\) @ ISO 100 |
Sensitivity in Imatest modules
Sensitivity is calculated in five Imatest Master modules: eSFR ISO, SFRplus, Color/Tone Interactive, Stepchart and Colorcheck, when
- the incident light level in lux is entered (a lux meter is described on the Test Lab page), and
- EXIF data is available in the image file or Aperture (F-stop number) and Exposure (time in seconds) are entered manually. Fred Harvey’s EXIFtool is strongly recommended. Without it, EXIF data is only decoded for JPEG files.
Typically the incident lux level is entered in the input dialog box, and the sensitivity is displayed in one of the output plots and in the CSV output file, if it is written. Details vary slightly with the module.
Stepchart
 The incident light level in lux is entered in a box near the lower-left of the Stepchart input dialog box. If it is blank or zero, sensitivity will not be calculated.
If EXIF data is available Aperture (F-stop number) and Exposure (time in seconds) are displayed below Incident Lux. If these boxes are empty they must be entered manually for the sensitivity analysis to run.
 |
Results ( Ssat , SSOS , and the incident lux level) are displayed in the upper-right of the Stepchart noise detail figure (the second figure when all are checked). |
Colorcheck
| The incident light level in lux is entered in a box near the lower-center of the Colorcheck input dialog box. If it is blank or zero, sensitivity will not be calculated. |  |
 |
Results ( Ssat , SSOS , and the incident lux level) are displayed in the Density response plot in the upper-left of the Colorcheck noise detail figure (the second figure when all are checked). |
SFRplus
The incident light level in lux is entered in the Settings area of the SFRplus settings & options window, which is opened by clicking on in the Rescharts SFRplus setup window. If it is blank or zero, sensitivity will not be calculated.
If EXIF data is available, Aperture (F-stop number) and Exposure (time in seconds) are displayed in the Optional parameters area near the bottom of the Settings window. If these boxes are empty they must be entered manually for the sensitivity analysis to run.
Results ( Ssat , SSOS , and the incident lux level) are displayed in the lower right of the Density response plot in the Tonal response & gamma display.
Color/Tone Interactive and Color/Tone Auto
 The incident light level in lux is entered in the Display area on the right of the Color/Tone Interactive window when Display is set to 7. Black & White density. If it is blank or zero, sensitivity will not be calculated.
To check the EXIF data (or to enter the Aperture and Exposure settings if EXIF data is absent), click the button. This opens the Color matrix and additional settings menu. The portion for displaying and/or entering Aperture and Exposure is shown below.
 |
Results ( Ssat , SSOS , and the incident lux level) are displayed in the lower-right of the Black & White density plot. When is pressed, results appear in CSV file [root name]_multicharts.csv only if Black & White density has been displayed. |
Equations
General background
The two key sensitivity measurements calculated by Imatest are both derived from the same equation.
\(\displaystyle \text{Sensitivity} = \frac{10}{H} = \frac{10}{I_{sensor}t}\) (1)
H is the exposure at the image sensor in lux-seconds for the object (test chart patch) used to determine exposure, typically a region of 18% reflectance. Isensor is the illuminance in Lux at the sensor. t is exposure time in seconds. The key issues are
- how to specify the illuminance at the object plane (i.e., Lux at the test chart) and output signal (i.e., pixel level) corresponding to H, and,
- the criteria for selecting H.
The relationship between test chart luminance and sensor illuminance can be derived from an equation in The manual of photography by Jacobson, Ward, Ray, Attridge, and Axford, Focal Press, Chapter 5, eqn. (5), p. 65,
\(\displaystyle I = \pi \frac{T L_{obj}}{4N^2} \) (2)
where
I is the illuminance at the Image (sensor) plane in lux,
T is the lens transmittance fraction, generally assumed to be 0.9,
Lobj is the luminance at the Object plane (test chart) in candelas per square meter,
N is the f-stop (aperture).
The sensitivity standards contain two factors in addition to T that reduce the light passing through the lens. There are vignetting factor v, assumed to be 0.98 and cos4(T), where T is assumed to be 10 degrees. cos4(10 degrees ) = cos4(p/18 radians) = 0.9406. This number is somewhat high for typical Imatest test conditions. Using T = 6 degrees, cos4(T) = 0.9783. With these additional factors,
\(\displaystyle I = \pi T v L_{obj} \frac{\cos^4(T)}{4N^2} = \pi (0.9)(0.98)(0.9783)\frac{L_{obj}}{4N^2} = 0.6777 \frac{L_{obj}}{N^2}\) (3)
Plugging I back into equation (1) gives
\(\displaystyle \text{Sensitivity} = \frac{10}{H} = \frac{10}{It} = 10 \frac{N^2}{0.6777 L_{obj} t} = 14.76 \frac{N^2}{L_{obj} t} \) (4)
Note that for T = 10 degrees, Sensitivity = \(15.4\frac{N^2}{L_{obj}t}\) , in agreement with the OnSemi ISO Measurement document. Sensitivity has units of 1/(Light level * exposure). This can be visualized by recalling that exposure is inversely proportional to light level and sensitivity, i.e., as light or sensitivity increases, exposure decreases.
Imatest modules that measure sensitivity analyze images of grayscale step charts, which consist of patches of known density d or reflectivity ρ, where \( d= -\log_{10}(r); \; \rho= 10^{-d}\). The X-Rite Colorchecker and the major charts supported by Color/Tone Interactive contain such patterns. For reference, pure white surfaces have ρ of about 90% (0.9), equivalent to d of about 0.05. The luminance of a chart patch is
\( L_{obj} = I\rho / \pi \) where I is the illuminance of the test chart in Lux. (5)
Reference: Basic Photographic Materials and Processes, Second Edition, by Stroebel, Current, Compton, and Zakia, Chapter 1, p. 27 (footnote), “Metric: A perfectly diffusely reflecting surface (100%) illuminated by 1 metercandle (… 1 lux) will reflect … 1 / π candela per square meter.”
Illuminance in Lux is easily measurable by an incident light meter such as the inexpensive BK Precision 615.
Saturation-based ISO sensitivity Ssat
This measurement assumes the image is exposed using a standard gray card with 18% reflectivity (r = 0.18) and that the the sensor saturates (reaches its maximum output) at 141% reflectance (well above the 90% reflectance for pure white) in order to provide some “headroom”. The patch (and corresponding luminance Lsat and saturation reflectance rsat) where the sensor saturates is calculated by extrapolating the brightest unsaturated patches. (If any patches are saturated they cannot used directly because they contain no real information. In such cases the extrapolated saturation luminance cannot be larger than the first saturated patch.)
The equation is derived by assuming that Lobj is 18/141 of the value that saturates the sensor, \( L_{sat} = \frac{Ir_{sat}}{p}\), where rsat and hence Lsat are determined by extrapolating patch pixel levels to locate the saturation point, i.e., at the test chart we must use
\(L_{obj} = \frac{0.18}{1.414} L_{sat} = 0.1273 L_{sat}\)
\(\displaystyle \text{ISO Sensitivity} = S_{sat} = 14.76 \frac{N^2}{L_{obj} t} = 116 \frac{N^2}{L_{sat}t} = 116\frac{pN^2}{I r_{sat} t} = 364.6 \frac{ N^2}{r_{sat}t}\). (6)
Saturation-based ISO sensitivity is not affected by signal processing, though measurement accuracy can be strongly affected. For best accuracy RAW files are recommended.
Standard Output Sensitivity SSOS (from CIPA DC-004)
This measurement assumes the image is exposed using a standard gray card with 18% reflectance (r = 0.18), and that the normalized pixel level for this region is 0.18^(1 / gamma), where gamma is the display gamma corresponding to the color space.
Many standard color spaces such as sRGB and Adobe RGB are designed for display with gamma = 2.2, so the normalized pixel level is 0.4586 (pixel level = 116 for 8-bit pixels where the maximum is 255). (0.461 or pixel level 118 is used in DC-004 because sRGB gamma is not exactly 2.2.) The patch density d46 = -log10(r46 ) and luminance \( L_{obj} = L_{46}\) where \( L_{obj} = I r_{46} / p\), corresponding to this pixel level is found using a second order polynomial fit to the log pixel levels as a function of patch density. If Lobj is the patch luminance,
\(\displaystyle \text{Standard Output Sensitivity} = S_{SOS} = 1476 \frac{N^2}{L_{obj}t} = 46.37 \frac{N^2}{I r_{46}t}\) . (7)
SOS is strongly dependent on signal processing. It is increased when a “shoulder” is present in the tonal response curve (TRC). Shoulders are widely used to reduce the likelihood of highlight “burnout” (saturation). For files encoded with a straight gamma = 1/2.2 curve (what you get when you decode a RAW file with dcraw), \( S_{SOS} = 0.71 S_{sat}\), i.e., the image is assumed to saturate at 100% reflectance (no headroom). When a shoulder is present, SSOS is generally larger than Ssat.
Headroom Hdr
Headroom is the amount of exposure available between the exposure for a 100% reflective patch and system saturation. When Exposure Index (EI) is set to the Saturation-based ISO Sensitivity, Ssat, headroom is always Hdrsat = 41.4% or 1/2 f-stop (or EV or Zone).
Standard Output Sensitivity SSOS and its corresponding headroom HdrSOS are both strong functions of the response curve. Increasing the response “shoulder” (curvature near saturation) increases both SSOS and HdrSOS. The formulas are fairly simple:
\(Hdr_{SOS}(\text{f-stops}) = \log_2(S_{SOS} / S_{sat}) + 0.5\) (f-stops or EV or zones) (8)
Using RAW files
Saturation-based ISO sensitivity measurements are more accurate and reliable when a RAW file is converted using dcraw wth the following settings.
dcraw input dialog box (appears when RAW files are opened)
showing recommended settings for ISO sensitivity measurement
- Auto white level must be unchecked.
- Demosaicing should be set to Normal RAW conversion. (We haven’t found the right combination of settings that produces reliable results with Bayer RAW files.)
- Output color space is normally set to sRGB.
- Output gamma should be set to sRGB or 2.2.
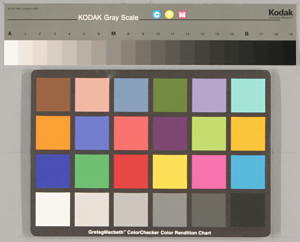
Q-14 and Colorcheck image,
cropped and reduced
The determination of the saturation point is made by extrapolation or interpolation, depending on whether any of the brightest patches are saturated. Because RAW files converted with dcraw have a straight gamma curve (a straight line on a logarithmic scale, i.e., no “shoulder”), the saturation point can be determined with good accuracy.
The outputs below are for Stepchart runs
on the the full-sized version of the image
shown cropped and reduced on the right.
These are the results for a RAW (CR2) file converted with dcraw. Note the straight line tonal response (slope = gamma) on the upper left. As prediced, SSOS is approximately 0.71 * Ssat, though there is some experimental error.
Stepchart Density response and sensitivity from RAW (CR2) file
converted with dcraw.
The results below show the tonal response curve for the same exposure, but using the JPEG image instead of the RAW image. The “shoulder” (curvature) in the bright areas on the right of the curve makes it difficult to accurately estimate the saturation point, although it’s not a bad thing pictorially. The shoulder reduces the likelihood of highlight saturation, resulting in generally more pleasing images. The value of Ssat derived from the RAW image (above) is more reliable. Note that the Standard Output Sensitivity SSOS = 110.8 has more than doubled. Headroom is \( \log_2 \bigl(\frac{110.8}{75}\bigr) + 0.5 = 1.06\) f-stops.
Stepchart Density response and sensitivity from JPEG. Same horiz. scale.
Related documents
Wikipedia – Film Speed The place to start, as usual.
OnSemi Image Sensor – ISO Measurement Describes the saturation-based ISO sensitivity measurement, but uses a different saturation level (106% reflectance, relative to 18% used for determining exposure) than the other documents (141%, which gives greater “headroom”). Mentions a noise-based measurement, which is used infrequently.
CIPA DC-004: Sensitivity of digital cameras (July 27, 2004) Two definitions of camera sensitivity: Standard Output Sensitivity (SOS) and Recommended Esposure Index (REI). Published by the Camera & Imating Products Association (Japan).
New Measures of the Sensitivity of a Digital Camera, Douglas A. Kerr, Aug. 30, 2007. A useful commentary on the different sensitivity measurements.
ISO 12232:2006: Photography — Digital still cameras — Determination of exposure index, ISO speed ratings, standard output sensitivity, and recommended exposure index. Expensive download.
