Imatest currently sells several transmissive (backlit) test charts, which have a range of substrates, each with specific properties and qualities that are in process of being quantified. The following comparison of the most important of our transmissive substrates was prepared in response to several customer inquiries.
| Chart suitability displays for several common media types are shown in Test chart suitability for MTF measurements. You can use these displays to predict test chart suitability without running Imatest. |
Transmissive Inkjet
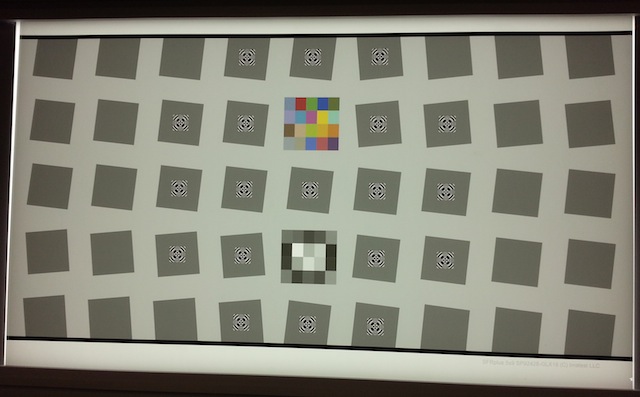
Printed at 600 ppi (pixels per inch) on Epson DisplayTrans using an HP DesignJet Z3100 printer here at Imatest HQ. Produced at sizes up to 1083mm (44 inches) in height.Quality should be very similar to our reflective inkjet materials.
Click on any of the images below to view full-sized.
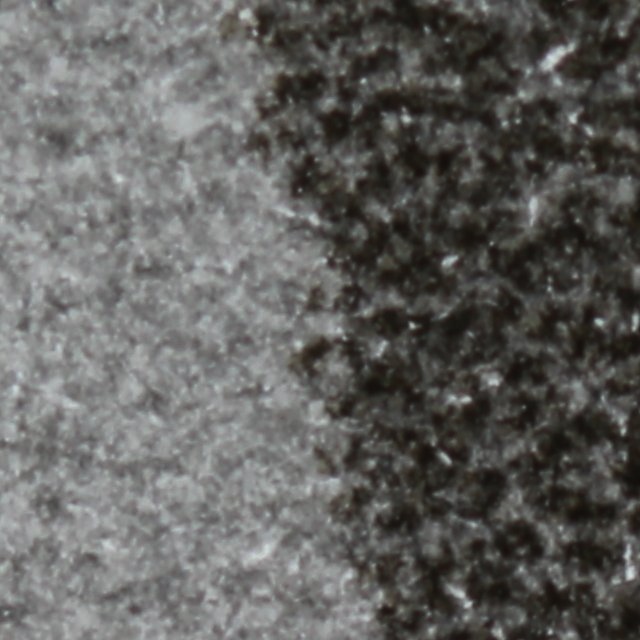
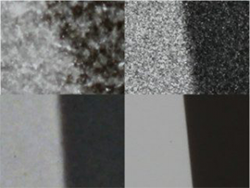
 Displaytrans media detail: 1.3 microns/pixel
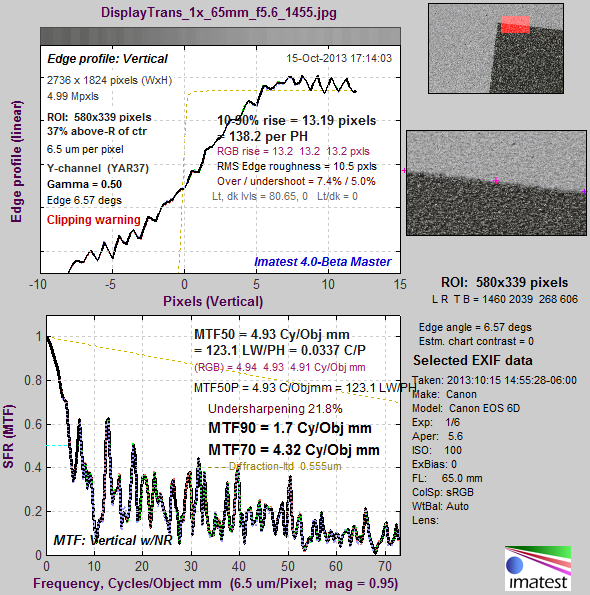
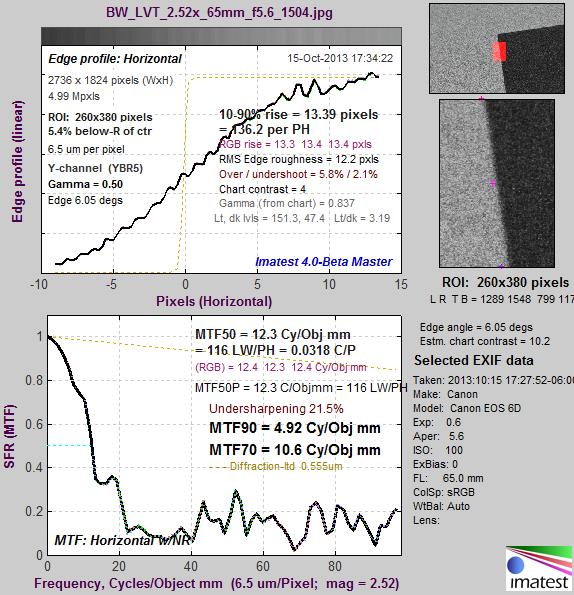
DuraTrans (Inkjet) MTF: note that horizontal scale is different in different MTF plots.
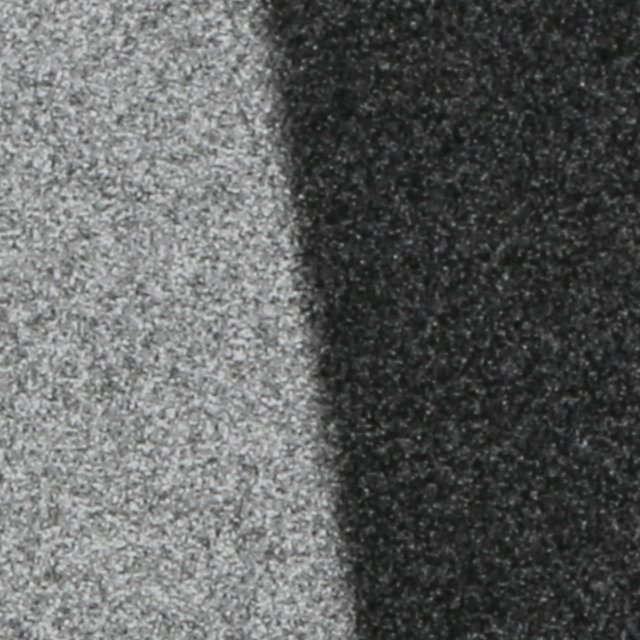
B&W LVT Film
Ilford FP-4, printed at 1524 ppi, produced at up to 482.6mm x 304.8mm (up to 19×12 inches active area on 20×12 inch film)
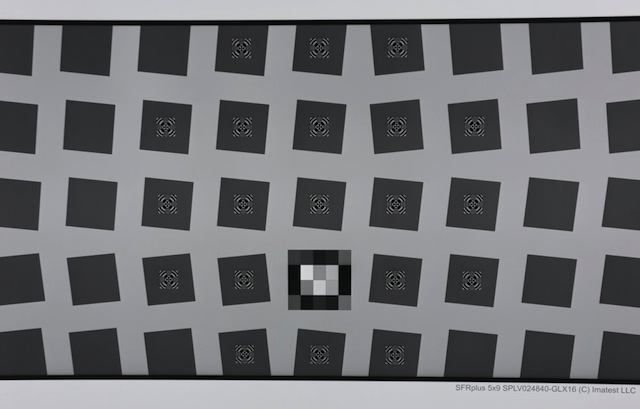
Recent results for B&W LVT film (with better performance than the sample shown above) are shown in Test chart suitability for MTF measurements.
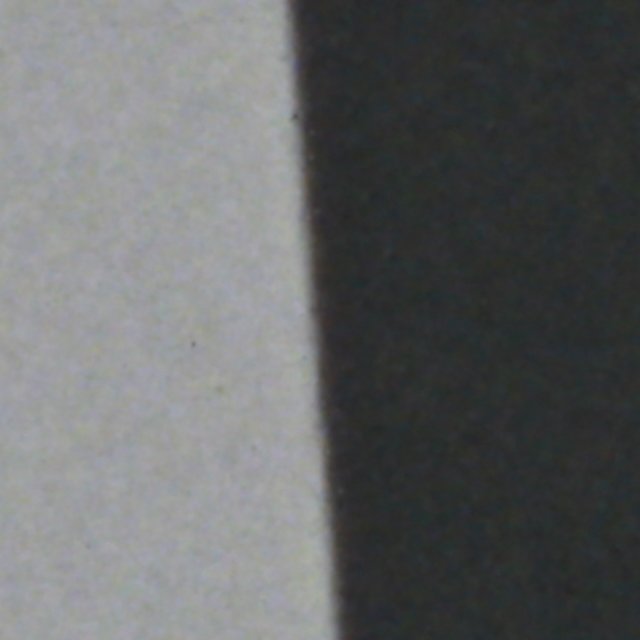
Color LVT Film
Fujichrome Provia 100F Professional, printed at 2032 ppi, produced at up to 234.95mm x 196.85mm (0.95×7.75 inches active on 10×8 inch film).
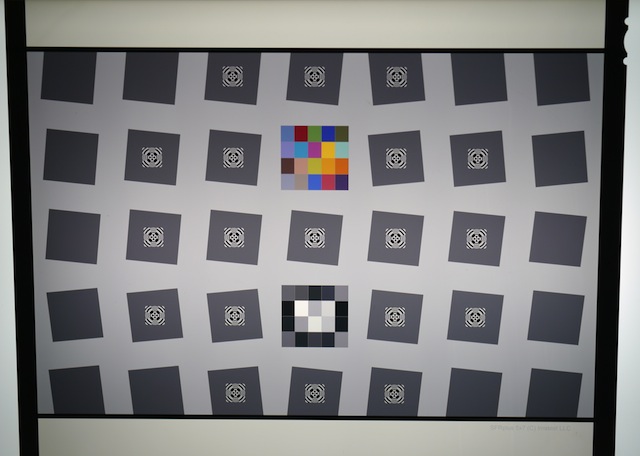
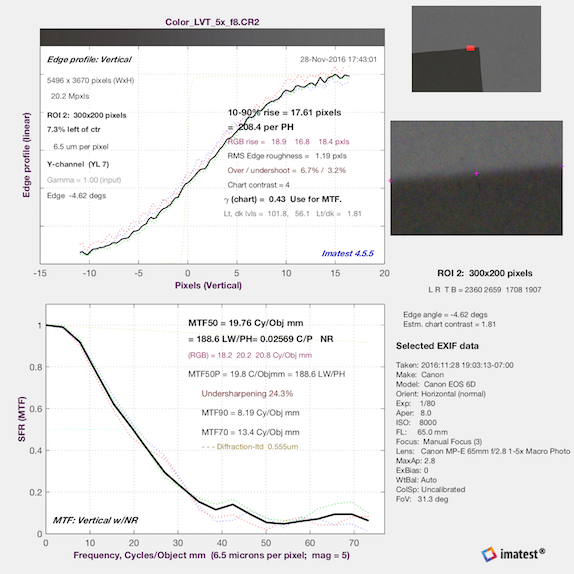
Recent results for color LVT film (with comparable performance to the sample shown above) are shown in Test chart suitability for MTF measurements.
Chrome on Glass
Chrome on optical glass, created using an ultra-high precision laser-etching process. Very high resolution, 19.74mm X 29.91mm active chart area.

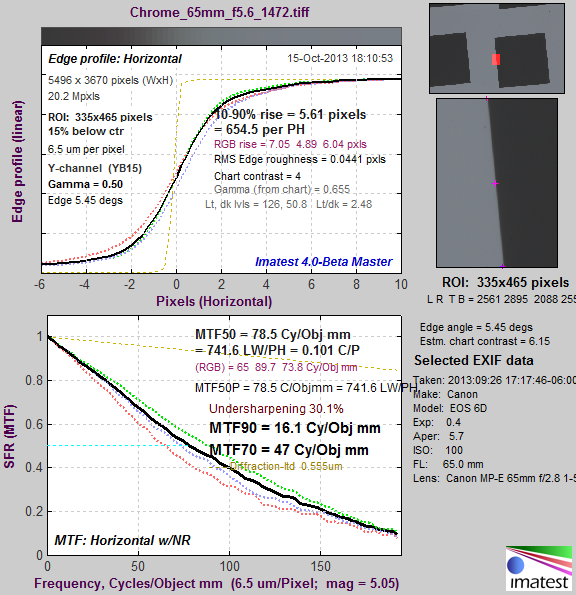
Note that the x-axis scale is very different from the above MTF plots
for film and inkjet media
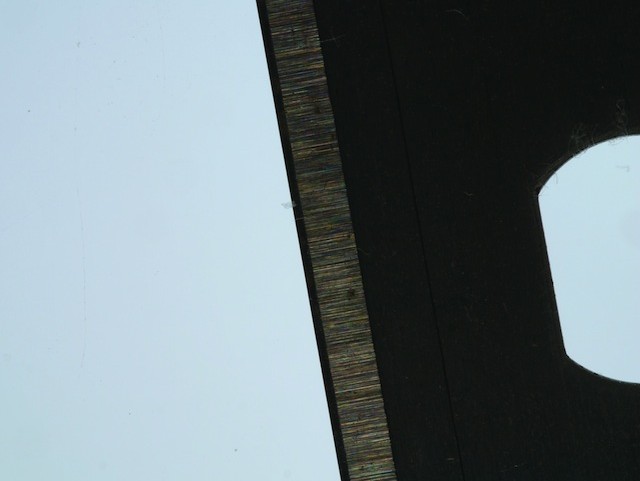
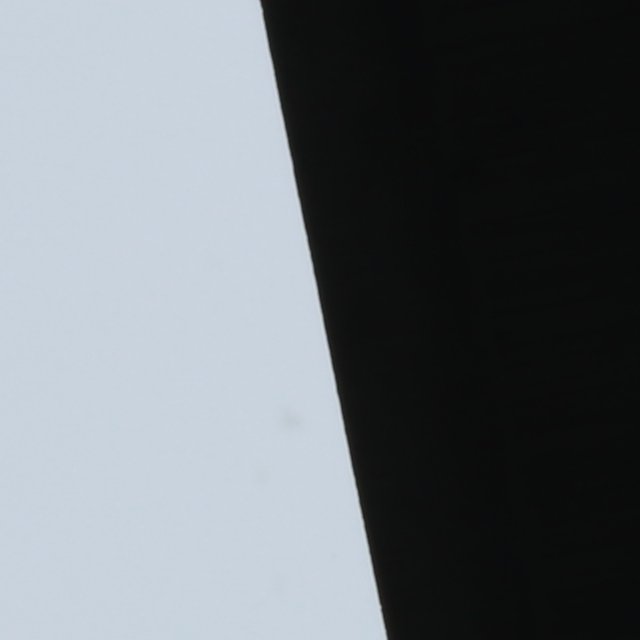
Our Control: Razor Blade
A standard, unused, straight-edge razor blade was used. The first picture was taken with the lights on, we turned the lights off to capture the edge since the grinding marks reflected light.
Click on any of the images below to view full-sized.
Capturing the Image
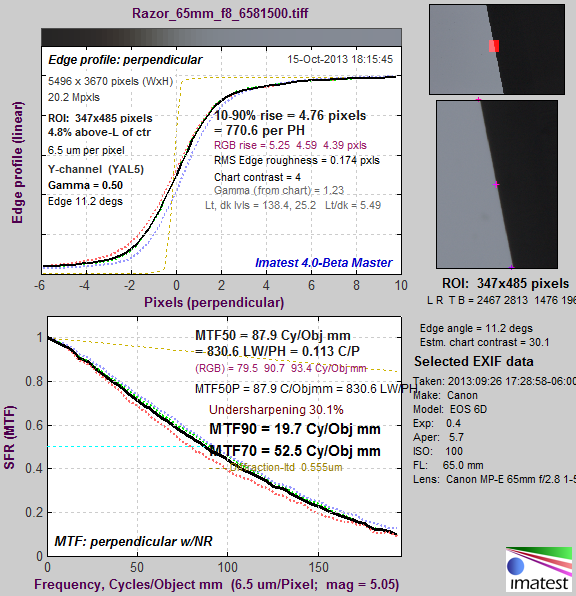
The charts were backlit by an Artograph LED light box. We photographed them using a Canon EOS 6D camera, which has a pixel pitch of 6.5 microns using a Canon 65mm f/2.8 1-5x macro lens. Manual focus was used with magnification set between 1:1 and 5:1. For each chart a series of images was taken at three different apertures, f/4.0, f/5.6, and f/8.0. For each chart the sharpest image was selected from the set using the ”Find Sharp Images” module in Imatest. The DisplayTrans inkjet chart had to be analyzed at 1:1 magnification because its edge was too rough to be recognizable at 5:1.
Recent Chart MTF measurements were made using printed slanted-edges of reasonable contrast (4:1 or 10:1) with the technique described in the Appendix of Compensating Camera MTF Measurements.
MTF Measurements and Results
The MTF was measured using the SFR module of Imatest at MTF50, MTF70 and MTF90.
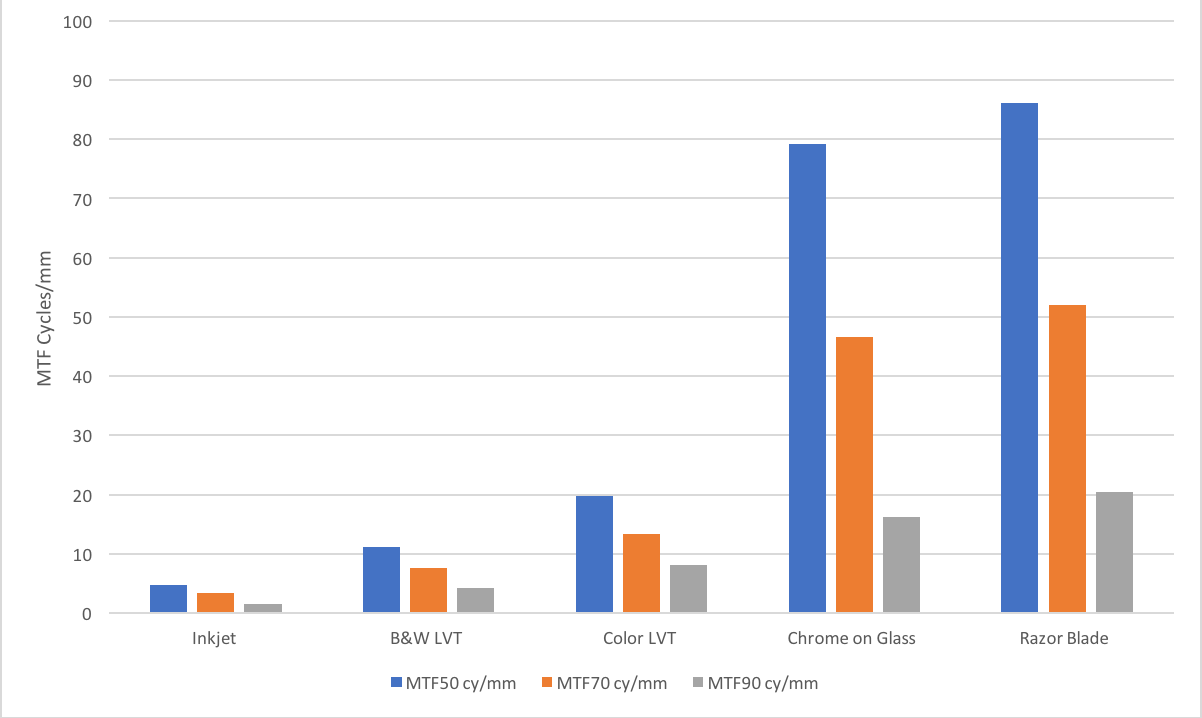
Transmissive chart quality
| Substrate | MTF50 cy/mm | MTF70 cy/mm | MTF90 cy/mm | Best Aperture |
| Inkjet | 4.68 | 3.38 | 1.52 | f /5.6 |
| B&W LVT | 11.2 | 7.62 | 4.32 | f /5.6 |
| Color LVT | 19.5 | 13.4 | 8.1 | f /8.0 |
| Chrome on Glass | 79.2 | 46.6 | 16.2 | f /8.0 |
| Razor Blade | 86.2 | 52 | 20.4 | f /8.0 |
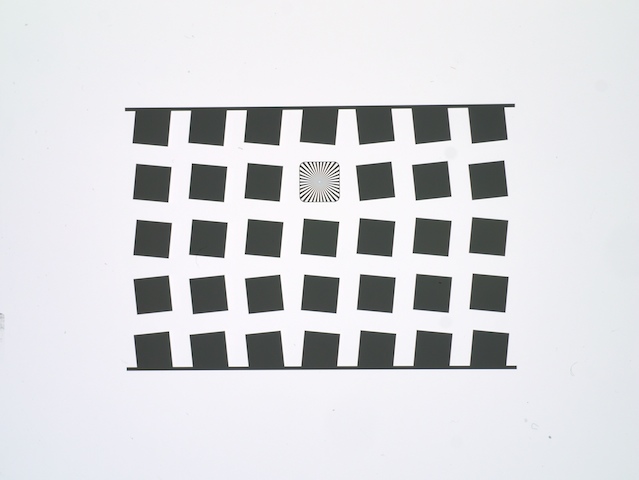
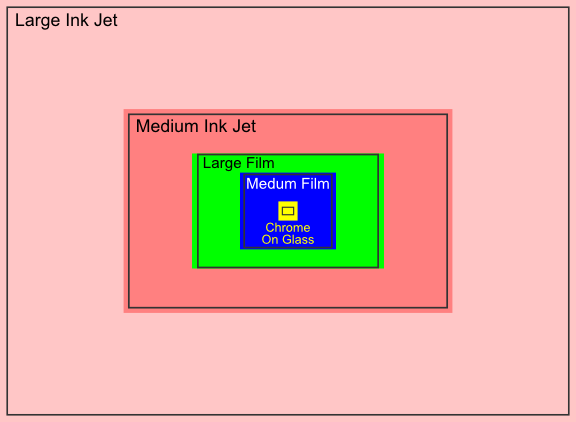
Chart Size Comparison
It is important to note that while the chrome on glass is many times better than the other substrates it is still limited due to size. The figure below shows the relative maximum sizes of a chart on a give substrate. So while the chrome on glass is approximately 3.5x higher resolution (at MTF50) than the color LVT film, it is also nearly 1/8th the size of the largest color film chart (Medium Film) meaning that a color LVT chart may be more suitable than a chrome on glass chart for a very high resolution sensor.
Because of these kinds of difficult scaling problems, we are developing a new tool called the Chartfinder. This tool will assist you in finding the best chart for a given sensor and lab setup. We are still adding to it so expect changes and notify us if you run across any bugs!
Conclusion
The chrome and glass substrate is the best available for a test chart that can be manufactured. In fact, we believe that even with our 5x magnification and high-quality lens we are still not able to truly measure the limits of the process used to create this chart. In future we hope to use a high-magnification microscope to get a more accurate result. We also are likely not truly reaching the limits of the razor blade and we plan to perform further testing on that as well.
The performance of several chart media is compared in Test chart suitability for MTF measurements.