Imatest SFR allows you to analyze and display several regions of interest (ROIs) in an image. Display options can be selected from three dropdown windows from the SFR settings window.
 |
Multi-ROI plots lets you choose the plot type: 1D or 2D; units in Cycles/Pxl, LW/PH (Line Widths per Picture Height), or LP/PH (Line Pairs per Picture Height).The 1D summary plots, which display results as a function of the distance from the image center, may be difficult to read for lenses that are poorly centered and hence have asymmetrical response. In most cases 2D summary plots are far more readable. 1D plots are no longer recommended. |
 |
Multi-ROI Results lets you choose which results to display. N is region number. Ctr-corner distance % is the approximate location of the region. CA is Chromatic Aberration in area, as percentage of the center-to-corner distance (a perceptual measurement). Secondary readouts are described here. |
 |
Multi-ROI Display lets you select how many results boxes to display, which can be helpful when many regions overlap (more likely to happen with SFRplus). From top to bottom the number of boxes is 4, 3, 2, 2, and 1, respectively. |
2D summary plot
When a 2D plot is selected, an image similar to the one shown below is displayed. This plot shows the regions of interest (ROI) and the following parameters for each ROI.
N (ROI number): Center-corner distance in %
MTF50 Cycles/Pixel or LW/PH (displayed boldface for emphasis)
MTF20 Cycles/Piexl or LW/PH
Chromatic Aberration (area in pixels)
The dotted circles delimit the central region (up to 30% of the center-to-corner distance), the part-way region, and the corner region (over 75% of the center-to-corner distance). Weighted MTF50 is the weighted mean of the mean MTFs in the three areas, for weights of 1 (Central), 0.75 (part-way), and 0.25 (corner).
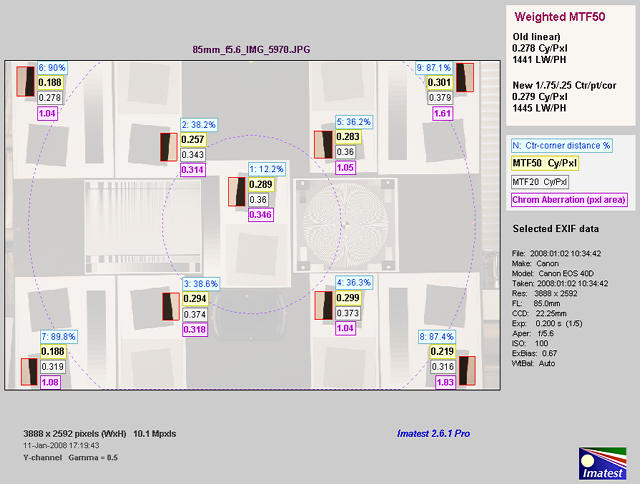
Multi-ROI 2D summary plot, showing Center-corner distance,
MTF50, MTF20, and CA superimposed on image.
This display can be particularly useful because lenses are not always centered properly. If they were, performance would be a simple function of the distance from image center. You can quickly review the summary results, then look at the detailed results for individual regions. It was developed because about 9 regions (center, 4 – part-way out, 4 – corner) is sufficient to characterize lens performance, but not sufficient for a meaningful 2D or 3D contour plot (which requires about 20 regions). Also, contour plots can only show one parameter (e.g., MTF50), while this display shows several.
1D Summary plot showing results as a function of distance from the center
This section is in small typeface because 1D plots are no longer recommended.
| This figure contains two plots: MTF50 (upper left) and 10-90% rise distance (lower left). If Cycles/pixel is selected, units are relative to pixels; if LW/PH is selected, units are relative to image height. These figures show performance (MTF50 and rise distances without and with standardized sharpening). The Cycles/pixel Figure also plots Chromatic Aberration as a function of distance from the center of the image, scaled as the percentage of distance from center to corner (0 = center; 1 = corner).The most important results below are shown in Bold. Illustrations are for the first figure (Cycles per pixel in this case). |  |
|
Upper left: MTF50 (Half-contrast frequency)
|
 |
|
| This plot shows MTF50 (the half-contrast spatial frequency) as a function of distance from the center of the image, scaled as the percentage from center to corner (0 = center; 100 = corner). There are two vertical (y) axes. The primary axis is on the left; the secondary axis (italicized) is on the right. These alternate for the two plots. In this plot, the primary axis is in Cycles/pixel for MTF50 and Pixels for 10-90% rise distance. It can also be in Cycles/mm or Cycles/inch if specified in the SFR data window. | ||
|
Black line (bold)
|
MTF50 (half-contrast spatial frequency) for the luminance (Y) channel. Unprocessed. This is the number to use for measuring lens sharpness. | |
|
Red line
(bold, dashed) |
MTF50 for the luminance (Y) channel with Standardized sharpening. This is the number to use when making general comparisons of different cameras with different degrees of sharpening. | |
|
Symbols and numbers
below data points, top to bottom |
Orientation: Location of region relative to image center. A = Above, B = Below, L = Left, R = Right. MTF50, Uncorrected and with Standardized sharpening, in units corresponding to the primary vertical (y) axis scale on the left. The vertical order is determined by the order of the data points, i.e., if the Uncorrected MTF50 is higher, its value is on top. MTF50, Uncorrected and with Standardized sharpening, in units corresponding to the secondary vertical (y) axis scale on the right. These numbers are italicized. The vertical order is determined by the order of the data points, i.e., if the Uncorrected MTF50 is higher, its value is on top. |
|
|
 |
|
Lower left: 10-90% Edge rise distance
|
 The Legend at the lower right of the 10-90% Rise distance plot sometimes covers data points. It can be moved by clicking and dragging it with a mouse. The Legend at the lower right of the 10-90% Rise distance plot sometimes covers data points. It can be moved by clicking and dragging it with a mouse. |
|
|
Black line (bold)
|
The 10-90% rise distance, uncorrected (without Standardized sharpening). | |
|
Red line(bold, dashed)
|
The 10-90% rise distance, with Standardized sharpening. | |
|
.Blue line
(bold, dashed) withyellow circles. |
Chromatic aberration (Area-based) in pixels. An indicator of the severity of CA. The area between the channels with the highest and lowest levels. In units of pixels because the x-axis is in pixels and the y-axis is normalized to 1. Explained in detail in the page on Chromatic aberration. Meaning: Under 0.5; insignificant. 0.5-1: minor; 1-1.5: moderate; 1.5 and over: serious. | |
When the SQF (multi) checkbox in the SFR input dialog box has been checked, a multiple ROI SQF Figure is produced.
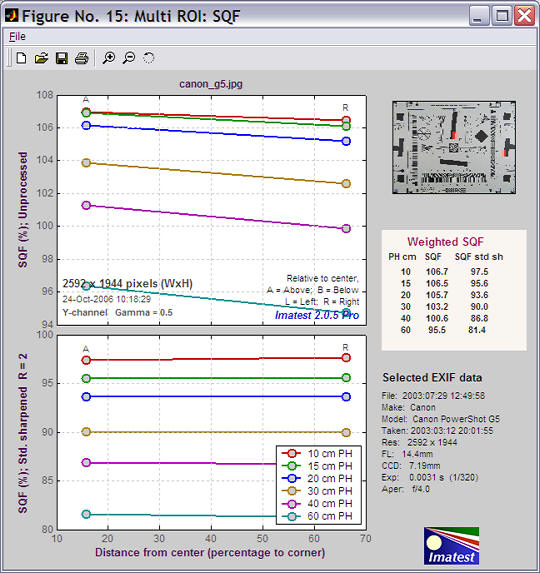
The upper plot shows SQF without standardized sharpening (unprocessed) for picture heights from 10 to 60 cm. The lower plot shows SQF with standardized sharpening (R = 2). Weighted SQFs are shown in the table on the right. The weighting formula is the same as the one used for MTF: readings near the center are given twice the weight of readings near the edge.
CSV output fileThe CSV output file can handle a large volume of results for the creation of Excel summary plots that combine results of several runs. It is designed to be opened in Excel. The following data shows the contents of the CSV file for the Canon 17-85 IS lens tested on the EOS-40D. It has been imported from Excel. Note: This function can be performed much more easily with Batchview (which works particularly well with SFRplus). For most applications the text below can be ignored.
|
 Summary plot Summary plot |
Header shows version, input file, and run date
| Imatest | 2.6.1 | Pro | SFR multi-ROI |
| File | 85mm_f5.6_IMG_5970.JPG | ||
| Run date | 1/9/2008 10:25 | ||
Geometry & file shows the Regions of interest (ROIs) in pixels and the CSV summary files for each location.
| Geometry & file: changed with Imatest 2.5.8. Origin at upper left. | ||||||||
| N | Distance % | Direction | X1 | Y1 | X2 | Y2 | Region | CSV summary file |
| 1 | 12.1 | AL | 1749 | 922 | 1894 | 1161 | Center | D:Camera_testsCanon_EOS-40D17-85_ISResults85mm_f5.6_IMG_5970_YAL12_MTF.csv |
| 2 | 38.7 | BL | 1244 | 1839 | 1380 | 2044 | Pt Way | D:Camera_testsCanon_EOS-40D17-85_ISResults85mm_f5.6_IMG_5970_YBL39_MTF.csv |
| 3 | 38.3 | AL | 1221 | 577 | 1355 | 798 | Pt Way | D:Camera_testsCanon_EOS-40D17-85_ISResults85mm_f5.6_IMG_5970_YAL38_MTF.csv |
| 4 | 36.1 | AR | 2432 | 551 | 2575 | 781 | Pt Way | D:Camera_testsCanon_EOS-40D17-85_ISResults85mm_f5.6_IMG_5970_YAR36_MTF.csv |
| 5 | 36.2 | BR | 2446 | 1817 | 2576 | 2032 | Pt Way | D:Camera_testsCanon_EOS-40D17-85_ISResults85mm_f5.6_IMG_5970_YBR36_MTF.csv |
| 6 | 90 | AL | 104 | 52 | 238 | 279 | Corner | D:Camera_testsCanon_EOS-40D17-85_ISResults85mm_f5.6_IMG_5970_YAL90_MTF.csv |
| 7 | 89.9 | BL | 133 | 2364 | 273 | 2579 | Corner | D:Camera_testsCanon_EOS-40D17-85_ISResults85mm_f5.6_IMG_5970_YBL90_MTF.csv |
| 8 | 87.3 | BR | 3571 | 2333 | 3696 | 2544 | Corner | D:Camera_testsCanon_EOS-40D17-85_ISResults85mm_f5.6_IMG_5970_YBR87_MTF.csv |
| 9 | 87.1 | AR | 3550 | 30 | 3686 | 251 | Corner | D:Camera_testsCanon_EOS-40D17-85_ISResults85mm_f5.6_IMG_5970_YAR87_MTF.csv |
nroi – roi_mult These four lines are used to define the regions in imatest.ini. These regions can be reused for Imatest runs by copying and pasting the four lines into imatest.ini, replacing the previous lines. Imatest.ini can be opened for editing by clicking Settings (in the Imatest main window), View settings (ini file).
| nroi = 9 | nwid_save = 3888 | nht_save = 2592 | roi_mult = 1749 922 1894 1161 ; 1244 1839 1380 2044 ; 1221 577 1355 798 ; 2432 551 2575 781 ; 2446 1817 2576 2032 ; 104 52 238 279 ; 133 2364 273 2579 ; 3571 2333 3696 2544 ; 3550 30 3686 251 ; |
Primary results, shown by region
| Primary results | ||||||||
| N | MTF50 (Cy/Pxl) | R1090 (pxl) |
CA (pxl) |
MTF50(LW/PH) | R1090(/PH) | PeakMTF | MTF50P(Cy/Pxl) | MTF50P(LW/PH) |
| 1 | 0.289 | 1.6499 | 0.3439 | 1498.2 | 1571 | 1 | 0.289 | 1498.2 |
| 2 | 0.2938 | 1.8284 | 0.3155 | 1522.9 | 1417.6 | 1 | 0.2938 | 1522.9 |
| 3 | 0.2566 | 2.1939 | 0.3113 | 1330.1 | 1181.5 | 1 | 0.2566 | 1330.1 |
| 4 | 0.2821 | 1.7768 | 1.0413 | 1462.5 | 1458.8 | 1 | 0.2821 | 1462.5 |
| 5 | 0.2993 | 1.6187 | 1.0377 | 1551.3 | 1601.3 | 1 | 0.2993 | 1551.3 |
| 6 | 0.1884 | 2.7046 | 1.0397 | 976.5 | 958.4 | 1.0201 | 0.1857 | 962.6 |
| 7 | 0.1871 | 2.5718 | 1.0671 | 969.9 | 1007.8 | 1.0239 | 0.1834 | 950.8 |
| 8 | 0.2191 | 2.3951 | 1.835 | 1135.8 | 1082.2 | 1.0132 | 0.2171 | 1125.7 |
| 9 | 0.3017 | 1.8871 | 1.6025 | 1563.8 | 1373.5 | 1.0104 | 0.3004 | 1557 |
Summary results The table contains summary results. These results are repeated in a single-column at the end of the CSV file, shown below. Though it is less readable, it is much better suited for copying and pasting summary results into an Excel file that can be used to produce plots.
| Summary | 1/9/2008 |
10:25 85mm_f5.6_IMG_5970.JPG 9Regions1Center4Part way4Corner MTF50
(Cy/Pxl)R1090
(pxl)CA
(pxl)MTF50
(LW/PH)R1090
(/PH)Peak
MTFMTF50P
(Cy/Pxl)MTF50P
(LW/PH)MTF20
(Cy/Pxl)MTF20
(LW/PH)Mean Ctr0.2891.64990.34391498.2157110.2891498.20.35981865.4Mean Pt Wy0.28291.85440.67651466.71414.810.28291466.70.36261879.6Min Pt Wy0.25661.61870.31131330.11181.510.25661330.10.3431778.2Mean Cor0.22412.38971.38611161.51105.51.01690.221611490.3231674.2Min Cor0.18711.88711.0397969.9958.41.01040.1834950.80.27781440Wtd mean0.27861.81911.14951444.31454.21.00210.27831442.70.35631846.8
| Mean Ctr | The mean of the central region (Ctr), up to 30% of the center-to-corner distance. |
| Mean Pt Wy | The mean of the Part-Way region (Pt Wy), from 30 to 75% of the center-to-corner distance. |
| Min Pt Wy | The minimum value of the Part-Way region. If the minimum value is much below the mean, the lens may be poorly centered (due to manufacturing tolerances). |
| Mean Cor | The mean of the corner region, which is over 75% of the center-to-corner distance. |
| Min Cor | The minimum value of the corner region. If the minimum value is much below the mean, the lens may be poorly centered (due to manufacturing tolerances). |
| Wtd mean | The weighted mean. For all parameters except chromatic aberration (CA (pxl)) the weights are 1 for Ctr, 0.75 for Pt Wy, and 0.25 for Cor. For CA (pxl) the weights are 1 for Cor and 0.5 for Pt Wy. (Lateral chromatic aberration is not important near the center.) |
The column in this table (rows in the single-column table below) contain the following results:
| MTF50 (Cy/Pxl) | The spatial frequency where MTF is 50% (0.5) of its low frequency value. Normally in cycles/pixel, but may be in cycles/mm or cycles/in if specified in SFR input dialog box. |
| R1090 (pxl) | The 10-90% rise distance in pixels. |
| CA (pxl) | Chromatic Aberration (expressed in area between highest and lowest channel) in pixels. |
| MTF50 (LW/PH) | MTF50 expressed in Line Widths per Picture Height, where 1 line pair = 2 line widths. (LW/PH is traditional in video.) |
| R1090 (/PH) | The number of 10-90% rises per picture height. |
| Peak MTF | The peak value of MTF. Equal to 1 when little or no sharpening is applied; can be much larger than 1 when strong sharpening is applied. |
| MTF50P (Cy/Pxl) | The spatial frequency where MTF is 50% of the peak value. Differs from MTF50 when strong sharpening is applied. |
| MTF50P (LW/PH) | MTF50P expressed in Line Widths per Picture Height. |
| MTF20 (Cy/Pxl) | The spatial frequency where MTF is 20% (0.2) of its low frequency value. Normally in cycles/pixel, but may be in cycles/mm or cycles/in if specified in SFR input dialog box. |
| MTF20 (LW/PH) | MTF30 expressed in Line Widths per Picture Height. |
Secondary results These include results with standardized sharpening (suffix C).
| Secondary results: C denotes standardized sharpening | ||||||
| N | MTF50C | |||||
(Cy/Pxl)R1090C
(pxl)MTF50C
(LW/PH)R1090C
(/PH)MTF20
(Cy/Pxl)
MTF20
(LW/PH)
10.2941.56891524.21652.10.35981865.420.30131.53041561.91693.70.3741939.130.28411.5941472.7…
Miscellaneous values
| Image WxH & Mpxls | 3888 | 2592 | 10.1 |
| Channel | Y | ||
| Gamma | 0.5 | ||
| Sharpening radius | 2 | ||
| Pixels per inch | |||
| Pixels per mm | |||
| um per pixel | |||
| MTF50 wtd Cy/Pxl (uncorr) | 0.278 | ||
| MTF50 wtd LW/PH (uncorr) | 1440 | ||
| MTF50 wtd Cy/Pxl (corr) | 0.294 | ||
| MTF50 wtd LW/PH (corr) | 1525 | ||
SQF summary. SQF is the Subjective Quality Factor, described here.
| SQF (Subjective Quality Factor): mean values | |||
heightViewing
dist (cm)SQFSQF_corr11599.5899.7621598.9899.66316.4398.4599.62418.9798.199.55521.2197.7599.45623.2497.3999.32
Exif data
| Exif data |
| File: 2008:01:02 10:34:42 |
| Make: Canon |
| Model: Canon EOS 40D |
| Taken: 2008:01:02 10:34:42 |
| Res: 3888 x 2592 |
| FL: 85.0mm |
| CCD: 22.25mm |
| Exp: 0.200 s (1/5) |
| Aper: f/5.6 |
| ISO: 100 |
| ExBias: 0.67 |
| WtBal: Auto |
Creating Excel plots
The single column summary is the last table in the multi-ROI CSV file. It contains the same data as the summary results (above), but it is formatted so it can be easily copied and pasted into another Excel file for creating plots that summarize several runs. For mult-ROI batch runs, this data is combined into a CSV output file with a name of the form, filename_Y_sfrbatch.csv.
Summary plot for 6 multi-ROI runs (f/5.6-f/32) for the Canon 17-85mm IS lens on the EOS-40D (JPEG)
The Excel file was created by combining single-column summary results from the 6 runs.
Any of the parameters in the summary can be plotted. To obtain a plot,
Single-column summary results The parameters in the table are described here. |
|
|||||||||||||||||||||||||||||||||||||||||||||||||||||||||||||