|
News: February 2018: Imatest presented a paper, “Measuring the impact of flare light on Dynamic Range,” at Electronic Imaging 2018. It can be downloaded here. Imatest 5.0+ The Uniformity and Uniformity Interactive modules include ISO 18844 flare measurements. |
Veiling glare is stray light that fogs images (reduces contrast in shadow areas). It is caused by reflections between surfaces of lens components and the inside barrel of the lens. It is a strong predictor of lens flare— image fogging (loss of shadow detail and color) as well as “ghost” images— that can degrade image quality in the presence of bright light sources in or near the field of view. It occurs in every optical system, including the human eye. It is a major factor in limiting camera dynamic range, especially when High Dynamic Range (HDR) sensors, which have sensor dynamic ranges of 120 dB or more, are used.
| Veiling glare can only be measured reliably from linear RAW images, converted to 16 or 48-bit files with gamma = 1. Processed images (JPEGs from cameras, etc.) handle dark tones (critical to veiling glare measurements) in unpredictable ways that can affect results. |
Lenses with low flare have been traditionally known for their excellent color performance. Color saturation is higher, especially in shadows. Low flare may be as responsible as sharpness for the exalted reputations of classic Leica and Zeiss lenses.
There are several ways of dealing with lens flare.
- In lens design, veiling glare is controlled by using high quality lens coatings (multi-layer coatings are best), baffling in the lens barrel, and careful design.
- In the field it is mitigated by lens hoods and anything that can shield the lens surface from the sun. Ansel Adams used a bellows lens shade, made famous in a Datsun (Nissan) commercial. (Here is some background information. I remember Adams’ Ford with “Zone V” license plates). He used his hat in a pinch.
- In the studio it is controlled by “barn doors” on light sources.
Veiling glare can be measured by the following Imatest modules.
- Stepchart uses a Q13 or Q14 (linear) grayscale chart adjacent to the black hole. The grayscale chart is used to estimate the camera response (for processed images). It is always more reliable to use raw images.
- Uniformity (and Uniformity Interactive) measure veiling glare using ISO 18844 method C in Imatest 5.0+. the image cannot contain a grayscale chart (linearization information must come from separate measurements.) Methods A and B, which require two chart images, will be added later.
- The Image Statistics module is valuable for examining spatially-dependent lens flare, as illustrated below.
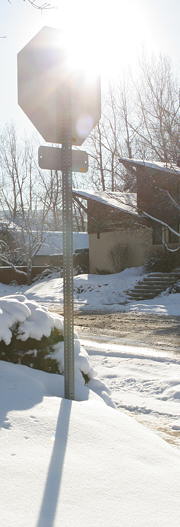
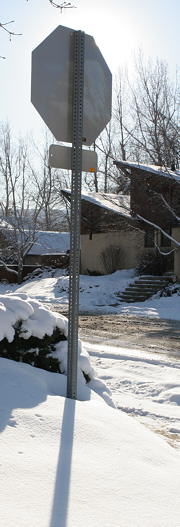
Obligatory bad photo showing severe lens flare caused by the sun (far left), and moderate flare with the sun blocked (near left).
Canon EOS-20D, 24-70mm f/2.8L, 24mm, f/8, no hood.
Taken during Colorado’s notorious “Winter of 2007”
(five feet of snow in three weeks in December and January)
Imatest veiling glare measurements are designed to give a good prediction of a lens’s susceptibility to lens flare in challenging situations: the larger the number, the worse it’s likely to be. But it’s not a perfect measurement. It can’t predict ghosting (visible behind the Stop sign in the image on the left). And it is not reliable for processed images; only linear RAW images give reliable measurements. And RAW images are often not available for inexpensive cameras and camera phones.
The measurement is fairly simple to perform, but several pitfalls can cause inaccurate or misleading results unless measurements are made with care. Some degree of exposure control— either a manual setting or exposure compensation— is recommended for best accuracy. Exposure control may not be available with camera phones and other simple devices.
Veiling glare is measured by photographing one or more perfectly black regions inside a uniform white field that extends well beyond the image frame (1.41x the image width in ISO 18844). It is defined as the ratio of the light reaching the sensor from the black region (which emits no light) to the light reaching the sensor from the surrounding white field.
Veiling glare = V = L(black region) / L(white surface), where L is the illuminance at the sensor.
For linear image sensors (which includes most non-HDR sensors), this measurement is straightforward
- if you have access to the linear (RAW) output of the sensor,
- if the white area is unsaturated (ISO 18844 recommends a level of 225 out of 255 for files with bit depth = 8),
- if the signal in the black region is large enough to be well above the noise, and
- if the black region is perfectly black.
We deal with the last of these issues first: how to create a perfectly black object— a black hole (also called a light trap). Don’t worry: it’s more environmentally friendly than the type that sucks planets into its core.
|
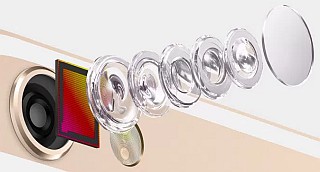
Lens reflections are a major cause of flare light. An uncoated glass surface (index of refraction ≅ 1.5) reflects R = 4% = 0.04 of the light incident on it. (Remember, a sheet of glass or a lens component has two surfaces.)
According to Edmund Optics, the best anti-reflective coatings have R ≅ 0.4% = 0.004 over the visible spectrum (~400-700nm). R = 0.005 may be more realistic for a reasonable range of incident angles. The light reflected back to the sensor from each secondary reflection would be R2 = 0.000025 = 2.5*10-5 = -92 dB (20*log10(R2)). The number of secondary reflections Nsec increases rapidly with the number of components M (groups of elements cemented together, each of which has two air-to-glass surfaces) in a lens: 1 for 1 component; 6 for 2 components; 15 for 3 components; 28 for 4 components; 45 for 5 components, etc. For M components, \(displaystyle text{Number of secondary reflections} = N_{sec} = sum_{i=1}^{2M-1}i = 2M(2M-1)/2 = M(2M-1))\) M = 5 components are typical for high quality camera phones; M ≥12 components is commonplace for DSLR zoom lenses. Overall lens flare is less severe than the number of secondary reflections suggests because the stray light don’t cover the whole image. It decreases with distance from bright regions. It’s easy to see why practical camera Dynamic Range measurements are limited to around 70-90dB, even when sensor Dynamic Range is much higher. 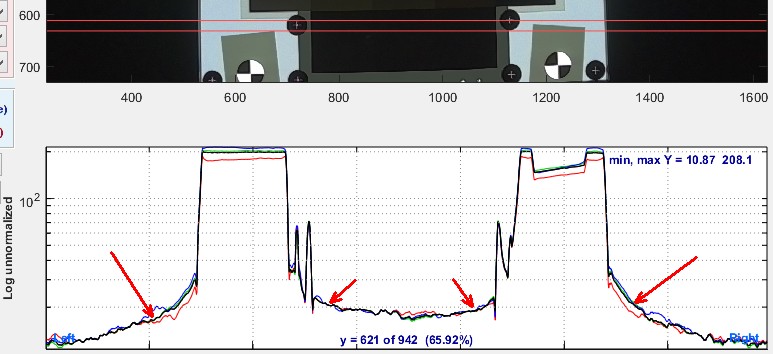 Image Statistics cross-section of a Contrast Resolution image for a high quality automotive camera, showing spatially-varying flare Because the ISO 18844 model does not measure the spatially-dependent flare caused by lens reflections, it’s value in characterizing practical system performance is limited. |
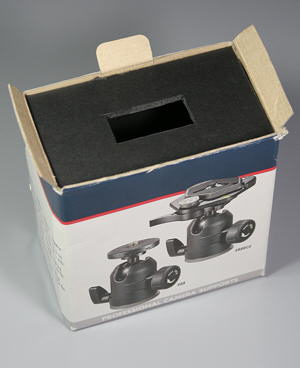
The “black hole” (light trap)
Veiling glare measurements from reflective charts with either Imatest Stepchart or Uniformity (the ISO 18844 type C measurement) require a completely non-reflective region (or regions). The darkest ordinary surfaces— materials or pigments— reflect about 0.5 to 1% of the incident light, i.e., they are are far from perfectly black*. To obtain a surface suitable for measuring veiling glare you will need to construct a surface that little light reaches— a black hole (light trap) — effectively the darkest possible region that can be photographed in a bright environment.
*Carbon nanotube-based surfaces come much closer to perfect black, but they’re
ridiculously fragile, and you can’t exactly buy them at your neighborhood camera store.
The black hole can be constructed inside a box or tube that is approximately 3x4 inches on its top (or 4 inches in diameter) and 4-8 inches deep. The bottom (inside back surface) should be lined with black velvet— the darkest material you can buy. The sides can be lined with any matte black material. We used black art paper because it was easy to work with. The top is a piece of black foam board with a 1x2 inch opening cut in the center.
The structure should be kept as lightweight as possible. If necessary it can be constructed entirely out of black foam board, with the black velvet in the inside back surface.
An alternative: A cone painted glossy black can be used to make a superior black hole.
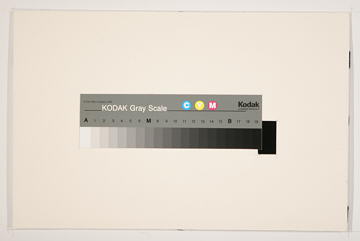
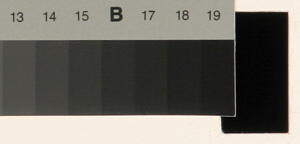
Veiling glare with Imatest Stepchart
The black hole is mounted next to a standard step chart such as the Kodak Q-13 or Q-14, which allows you to measure the camera’s tonal response (pixel level as a function of scene luminance). This can help to linearize the image, but is not foolproof because cameras rarely have simple gamma (exponential) response curves (where pixel level = brightness(encoding gamma) ). Processed files from cameras frequently have nonlinear response in the bright regions, i.e., the response curve has a (film-like) “shoulder”— a good thing pictorially because without it digital cameras have a strong tendency to burn out highlights. They often deviate from a straight gamma response in deep shadows (which are more difficult to measure than highlights).
The Imatest Stepchart veiling glare method is very similar to Measurement type C described in section 4.3.2 of the ISO 18844 standard, described below.
In Stepchart, gamma (image contrast) for measuring veiling glare is calculated by one of several methods, and can be rather different from the average gamma shown in the figures.
| No Veiling glare calculation (default) | |
| Veiling glare; gamma from darker zones (old) | Used prior to Imatest 3.9. Inaccurate with subtle glare (a problem with the semigloss surface of the Q=13/Q-14 charts) reduces shadow contrast. |
| Veiling glare; gamma from lighter zones |
Better if there are any problems with glare in the shadows, but not so good if there is a “shoulder” in the tonal response curve. Good with RAW files. |
| Veiling glare; gamma = 1 for RAW FILES!!! (best) | Best with Bayer RAW files that have been accurately converted with gamma = 1. Beware of offsets, which can spoil the measurement. |
Three additional settings allow the black hole to be adjacent to the white patch.
The white point is inferred from the region where the step chart pixel level is between 0.1 and 0.6 of the minimum-to-maximum pixel range, i.e., the brightest areas, which are frequently nonlinear (part of the tonal response curve “shoulder”), are excluded. The white reference is inferred from the patch in the middle of this region. For example, suppose it is patch 11. Since the Q-13/Q-14 has density steps of 0.1, patch 11 is 1.0 density units darker than (1/10 as bright as) patch 1, which is the reference white, i.e., we infer the white level from the measurement of patch 11: the inferred white pixel level would be (10 times the pixel level of patch 11)gamma. Since nonlinearities or even clipping of highlights is quite common, this technique results in a more accurate veiling glare measurement than you’d get by measuring the white region directly. Here is the modified veiling glare equation.
Veiling glare = V = ( Pixel level (black object) /Pixel level (white surface, inferred) )1/gamma
Assembling the target
Typical framing for measurements
For analysis with Stepchart a Kodak Q-13 or Q-14 step chart and the black hole box are mounted on a piece of mat board, roughly twice the width of the Q-13 chart— its dimensions are not critical. A 3/4x1 inch hole is cut in the mat board, just to the right of where of where the Q-13 chart will be mounted. The black hole box is mounted behind it. The Q-13 is mounted to slightly overlap the opening. The mat board is attached to a large sheet of white foam board with Velcro so it can be easily removed for safe storage.
Black hole location detail
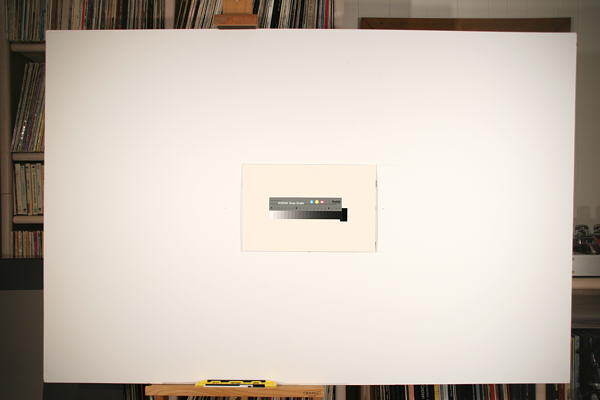
The entire target
The black hole may be placed next to the white patch if desired– several settings have been added to allow for this placement.
Measuring veiling glare
- Illuminate the target evenly, with no more than about ±20% variation in illumination across the target, as described in Imatest test lab. Keep the ambient light near the camera as low as possible ti minimize the light entering the “black hole.”
- Note whether you are using a lens hood or a filter (like the ubiquitous UV filter most photographers leave on their lenses for protection). Both affect veiling glare.
- Set the camera to the lowest available ISO speed to minimize the noise in dark patches.
- Adjust the exposure (or exposure compensation) so the white level is close to saturation (around level 225 for 8-bit files), i.e., bias it in the direction of overexposure.
- RAW output is strongly preferred, though JPEG may be perfectly fine if the response is reasonably close to a simple exponential (gamma curve); i.e., it does not have a complex tonal response curve, especially in the “toe” region). Unfortunately we’ve seen camera phones where this assumption completely failed. Here are the recommended dcraw settings:
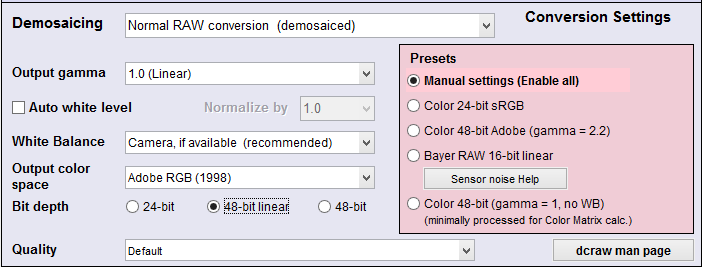 Recommended dcraw settings for veiling glare measurements
Since dcraw does not always properly remove pixel (black level) offsets in the image file we frequently recommend converting raw files to DNG format, then reading them into Imatest.
- Photograph the central portion of the target, leaving some white area around the Q-13 chart and “black hole.” Typical framing is shown above, to the right of Assembling the target. The length of the white target to the left and right of the frame should be about equal the frame itself. Similarly, the length of the white target above and below the frame should be about equal to the frame itself. (Light entering the lens from outside the image frame is an important contributor to lens flare.)
- Run Imatest and select . Open the image file. If Automatic Zone detection is unchecked and the image is the same size as the previous run you’ll be asked if you want to repeat the same ROIs (Regions of Interest). If you enter , you’ll be asked to make an ROI selection. It’s OK to make a rough selection: another window will enable you to refine it.
- After you’ve made the rough selection, the Stepchart input dialog box, shown below, appears. To measure veiling glare, Automatic Zone detection must be unchecked, the number of patches must be set to one greater than the number of patches in the step chart: 21 in this case, and Veiling glare must be set appropriately. For RAW images decoded according to the above recommendations, we recommend Veiling glare; gamma = 1.

Portion of Stepchart settings box, showing veiling glare settings.
- Click . The fine adjustment box appears. Press , just to the right of to view the dark patches clearly. The button changes to when the image is in lightened mode. It also helps to maximize the window and click the radio button (middle, left).
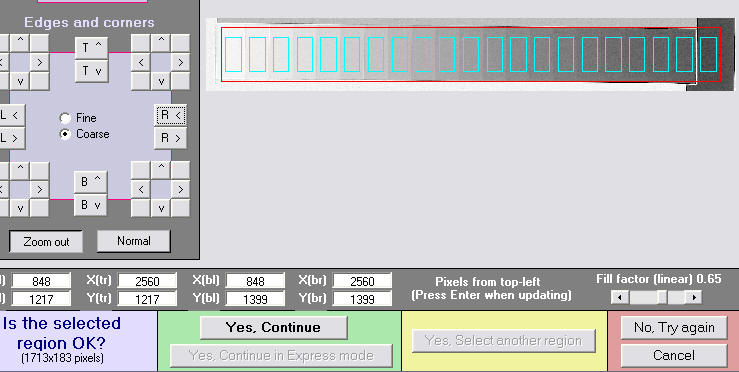
Portion of Fine ROI adjustment window; Lightened view ( box is displayed)
- Click to run Stepchart and calculate veiling glare.
Results
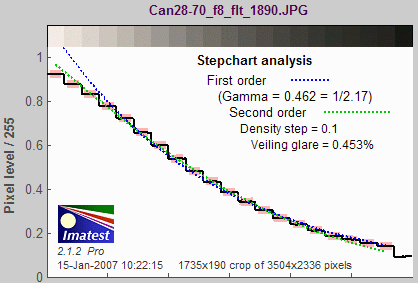
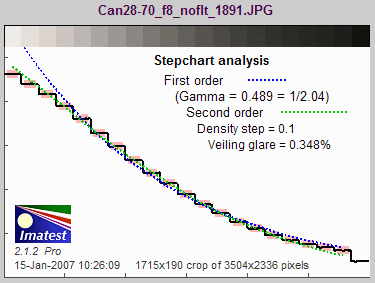
The first illustration shows the results for the Canon EOS-20D with the 24-70mm f/2.8L lens set at 70mm, f/8. Veiling glare is shown on the middle-right of the first figure.
with UV filter (not multicoated)
 No filter: 23% lower veiling glare |
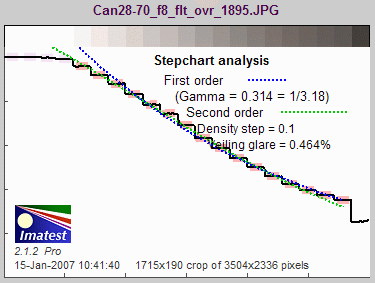 Overexposed about 2 f-stops, with UV filter: Results are insensitive to overexposure. |
These plots show the difference in linearity between JPEG and RAW (to TIFF) density response. The EOS-20D only deviates slightly from linearity (a straight gamma curve).
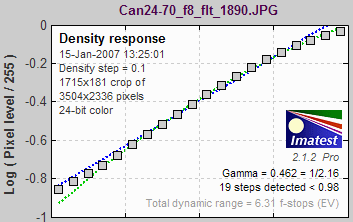 JPEG density response, showing nonlinearity in highlights |
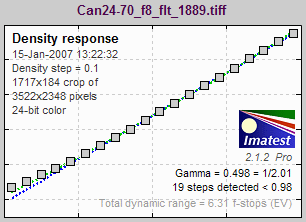 RAW/TIFF density response, showing good linearity in highlights |
|
Table of results: Canon EOS-20D JPEG data
|
||||||
| Lens | Elements | Groups | Focal length | f-stop | Veiling glare | Comments |
| Canon 24-70mm f/2.8L USM (no hood; single-coated UV filter) | 16 | 13 | 70 | 8 | 0.453% | A premium zoom, known for excellent sharpness. Results are strongly affected by the single-coated UV filter, but they are insensitive to overexposure. When working from RAW (CR2) images, veiling glare was 0.564% with the filter and 0.391% with without it. Different results; similar trends. |
| ” (no filter) | 0.348% | |||||
| ” (overexposed 2 stops, with filter) | 0.464% | |||||
| Canon 90mm f/2.8 TS-E (no filter) | 6 | 5 | 90 | 8 | 0.291% | A very high quality tilt/shift lens with relatively few elements and groups. Has beautiful tonality and color quality. Low veiling glare expected. |
| Sigma 18-125mm f/2.5-5.6 DC (hood, multi-coated UV filter) | 15 | 14 | 77 | 8 | 0.293% | A remarkably fine lens for the price. Surprisingly low veiling glare. (If you’re thinking of buying one: it has poor autofocus performance; it’s much better on manual.) |
| Canon 28-80mm f/3.5-5/6 (no filter) | 10 | 9 | 80 | 8 | 0.634% | (1991 version) A cheap “kit” lens, designed for low cost. Expectations were low. Strangely reddish white balance. |
| Canon 70-200mm f/4L USM (UV filter, hood) | 16 | 13 | 70 | 8 | 0.396% | Excellent lightweight lens. The IS version has 20 elements in 15 groups, which will increase flare. |
| The table at the bottom shows the relationship between the number of groups (sets of attached elements) and the number of reflections that contribute to veiling glare. | ||||||
Most of the results are not surprising. The Canon 90mm has the lowest flare, while the cheap Canon 28-80 is the worst. The only surprise is the excellent performance of the Sigma 18-125: a lens know for its fine performance and value, though its autofocus performance is mediocre. I use mine on manual.
Limitations
The veiling glare may be underestimated for telephoto lenses— especially if they are measured without lens hoods— because telephoto lenses form an image of only a small fraction of the light reaching the front element (the portion is much larger with normal and wide angle lenses). The target, as shown above, may not be large enough to simulate all the light that reaches the lens. If a hood is used, this error is considerably reduced.
If there are nonlinearities in the camera response at low light levels, the results may be incorrect (although relative results, i.e., comparisons, will still be valid). It’s always safest to work with RAW images and convert them with a “linear” (i.e., simple gamma curve) setting. You can read many RAW formats into Imatest, using the dcraw converter.
ISO 9358
Veiling glare, as measured by Imatest, is similar to the veiling glare index (VGI) specified in the integral (black patch) test of the ISO 9358 standard. The key differences are
- The ISO standard applies to lenses (optical systems), without including the effects of image sensors and image processing found in all cameras.
- It calls for more rigorous testing conditions. In particular, an integrating sphere must be used. This means that there will be more light from outside the field of view, which will sometimes result in higher readings.
- It does not include a grayscale step chart (for measuring tonal response) in the image. This means that only raw files (or files with extremely well-characterized tonal response (OECF curves) should be used. This is difficult to get right unless a camera raw image is available.
- ISO 18844 (described below) was created to address some of the difficulties of making ISO 9358 measurements with cameras.
ISO 18844 flare (veiling glare) measurements
with Imatest Uniformity or Uniformity Interactive
ISO 18844 flare measurements have been added to the Uniformity and Uniformity Interactive modules in Imatest 5.0+. Currently, only Method C, which uses a single image where the dark areas are “black holes” (light traps) has been implemented.
 |
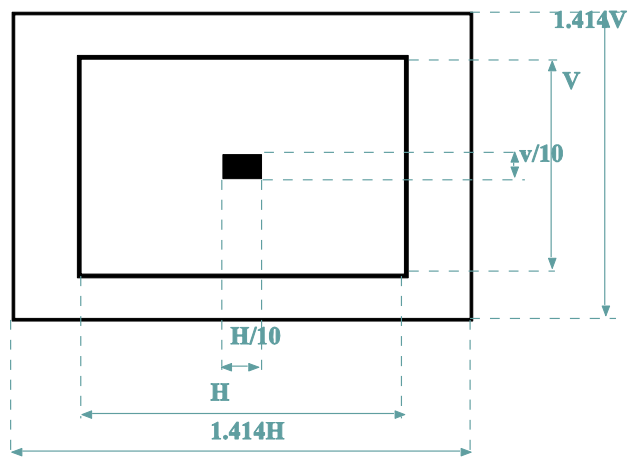 |
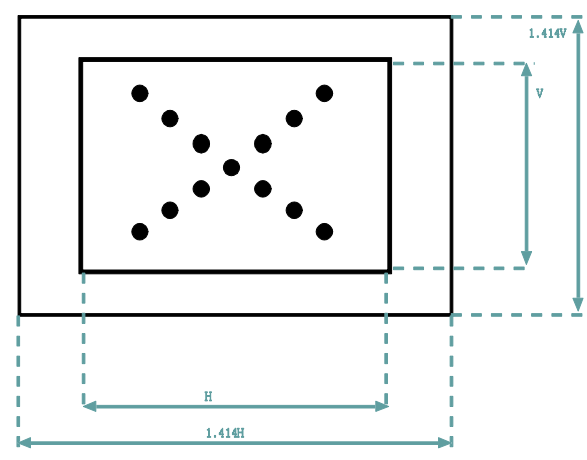
ISO 18844 chart arrangements: either a single rectangle with dimensions 1/10 the image height and width (H and W)
or a set of circles arranged on a diagonal.
Imatest provides a backlit version of this test target. Transmissive charts should be used in a dark environment, taking care to minimize light reflected back to the chart.
| The current ISO 18844 standard has one rather serious problem. In section 4.3.1 it gives an equation for linearizing the image (finding the output luma value Y’sYCC) using the equation for the sRGB color space, which is used in most consumer cameras. The problem is that most cameras do not encode their images according to the sRGB (or any other color space) standards. In fact they’re rarely even close. Most cameras apply tonal response curves (with “shoulders” to soften highlight saturation), and these curves may also affect response in the darker areas (critical to veiling glare/flare measurements) that can be difficult to measure. | 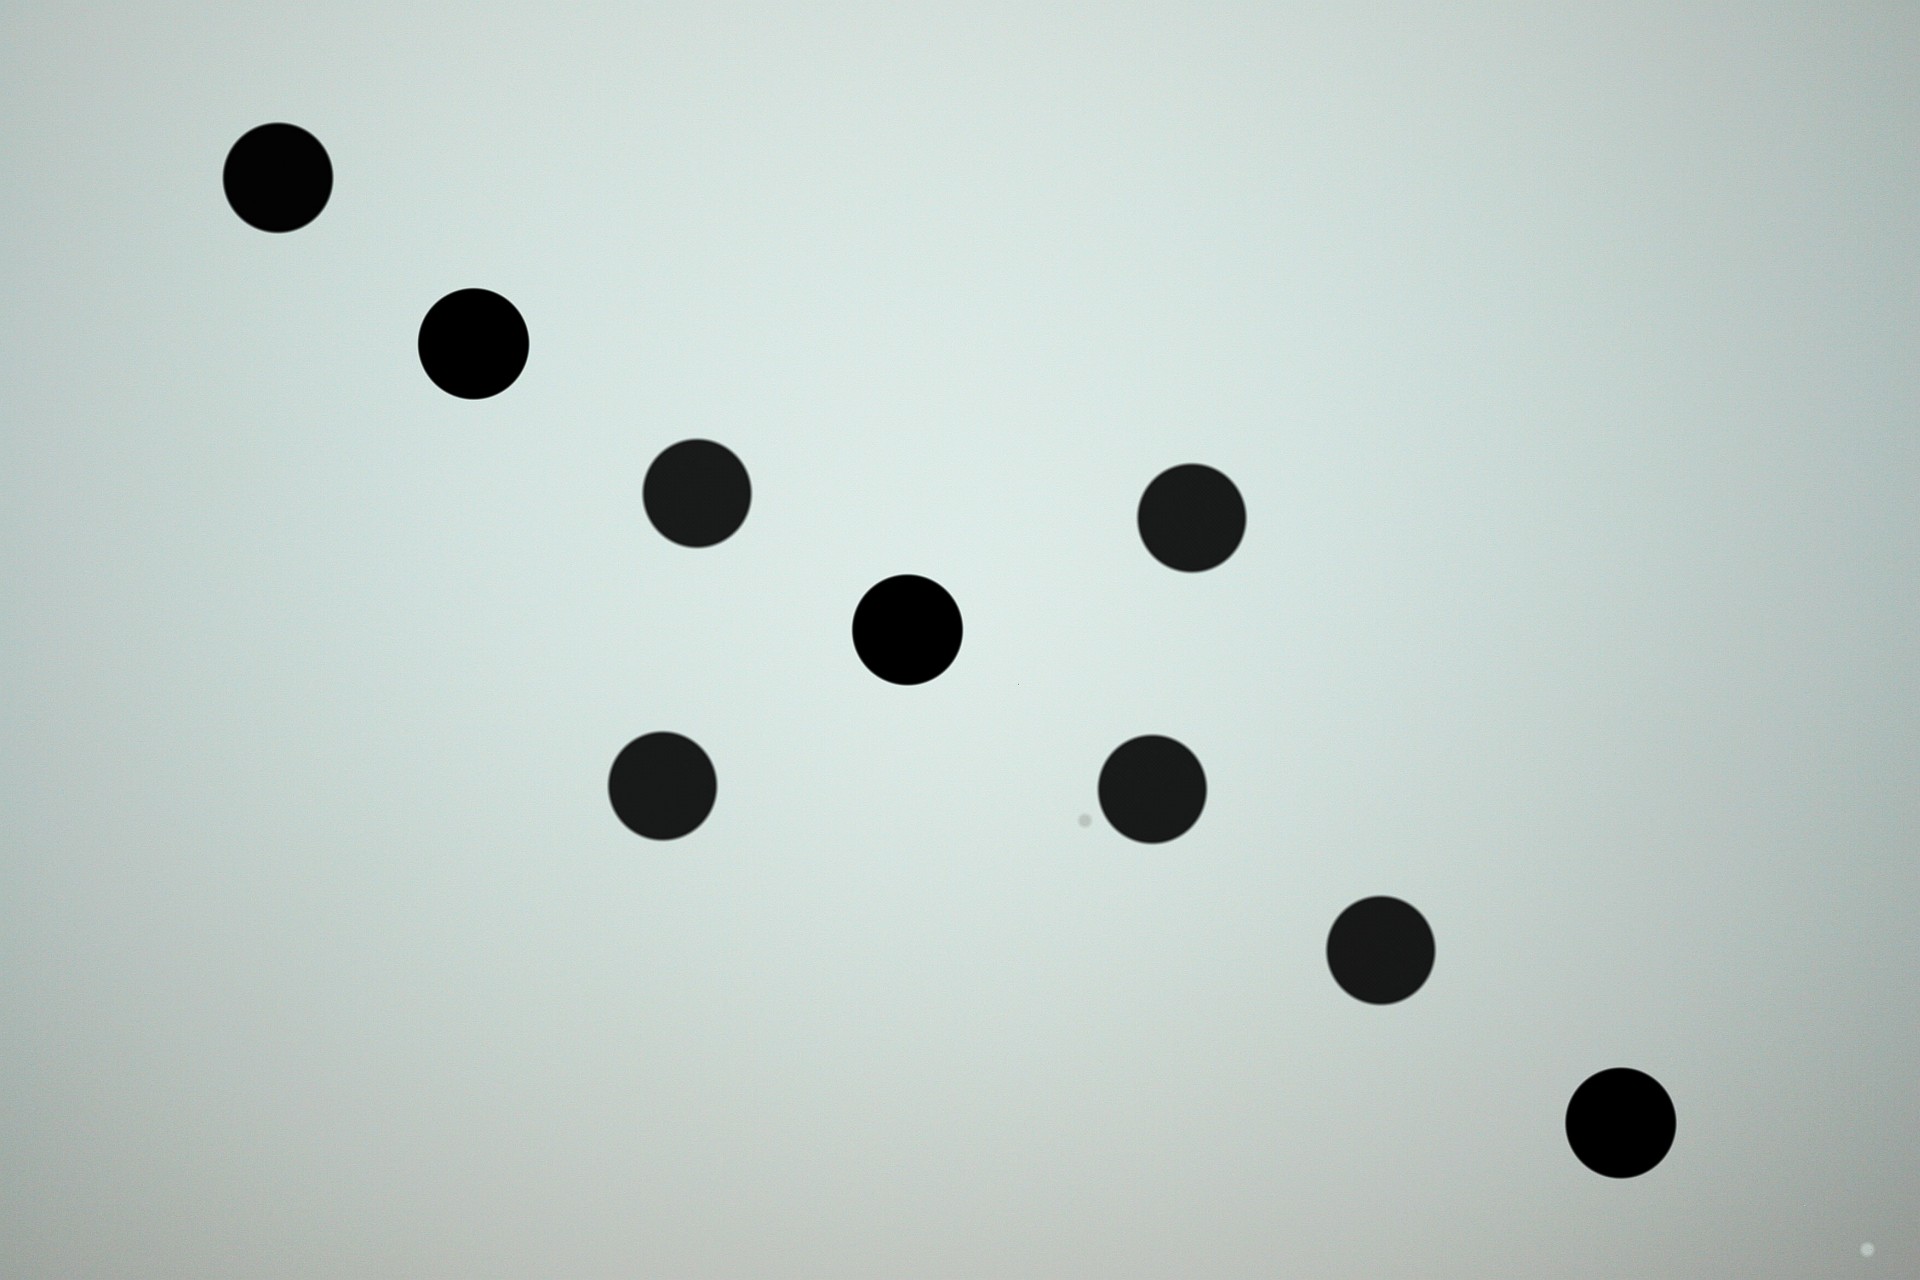 |
| Sample ISO 18844 flare image (simulated). Click to download |
- The first steps— illuminate the target through exposure and RAW settings are the same as for Stepchart.
- Photograph the central portion of the target, framing it for H and V in the above diagram, making some adjustment for aspect ratio if necessary.
- Run Imatest and select or . Open the image file. If the image is the same size as the previous run you’ll be asked if you want to repeat the same ROIs (Regions of Interest). In most cases you’ll select the entire image.
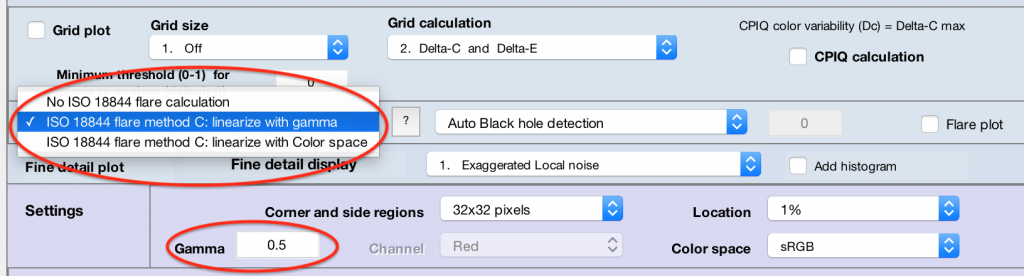
- After you’ve made the selection, if you click Yes (not Express mode) the Uniformity settings window, a portion of which is shown below, appears. You can select between no ISO 18844 calculation or the calculation with two approaches to linearization: enter the gamma (shown below to the left) or use the color space linearization (called for in the standard, but rarely correct). Gamma must be measured in a separate image.
 Uniformity settings window (portion)
- Choose a “black hole” detection method: “auto” or “from manual threshold“
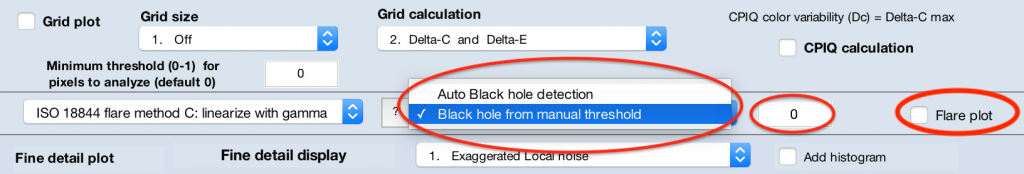
- Auto (recommended): Applies adaptive thresholding to the image to determine what pixels constitute black hole areas. Less likely to be fooled by vignetting than a manually-set global threshold value.
- Manual Threshold : When this option is selected, the field to the right is enabled and the user may enter a numeric value between 0 and 1. Linearized pixel values (normalized to the data type range, so that they area between 0 and 1) below this threshold value will be indicated as black hole areas.
- Select the “Flare plot” to have the figure generate.

Results
Results are in the ISO 18844 flare plot and in the CSV and JSON output files.
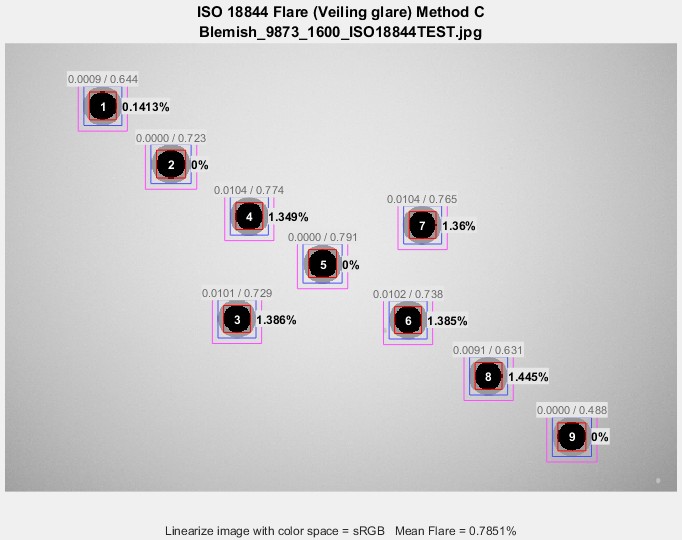
ISO 18844 Uniformity results for a simulated chart (not all diagonal regions were included)
Black Hole Detection Problems
Imatest uses a few criteria beyond the thresholding option (auto or manual) described above to determine what is a valid area for producing ISO18844 flare results. If you are testing an image and the software appears not to be operating on a black hole area in it (i.e., it is greyed out in the output plot and shows no measurement numbers), there may be a few reasons why:
The black hole area is too small : In order to prevent spurious results, we require that areas that pass the thresholding test also have a large enough contiguous area to be useful. This involves eroding in from the sides of the detected area, so if your black hole is too small in the image (which may happen with low-resolution cameras at a large distance from the target), it may not appear in the results.
The black hole is not surrounded by enough light-area data : Method C of ISO 18844 requires that the pixel value in the black hole area be compared to the pixel values in the locally surrounding light areas. Moreover, it averages the light area values from regions from all four sides of the black hole (above it, to the left of it, etc.). If there is not valid light-area data within an appropriate margin on all four sides of the black hole area, it will not be measured. This can happen when the black hole is too close to the edge of the image/crop area or too close to another black hole.