Field of View: Concentric Rings Module

Enhance
Your View with
Concentric Rings
The Concentric Rings Field of View Module newly available in Imatest 24.2 offers an innovative solution for accurately measuring field of view based on ISO 8600-3:2019 Standard methods. This powerful tool simplifies complex field of view measurements and enhances visual representation, ensuring precision and reliability in your assessments. Explore the capabilities of our module and see the difference it makes in your visual quality analysis.
Table of Contents
Current Documentation
Introduction
The ImatestTM Concentric Rings Field of View (FOV) Module, available starting in 24.2, is a fixed batch-capable module that automatically detects and analyzes images of concentric ring targets to determine the angular range of observable area, or the field of view (FOV), for a lens-camera system. Based on the ISO 8600-3:2019 Standard, the chart design—originally created to measure the field of view for endoscopes with optics—has been augmented for automatic analysis in Imatest, and can be customized for a wide variety of other camera-lens systems that require larger or smaller testing distances.
How it Works

For a known working distance, z, each ring of radius, r, on the target corresponds with a particular field of view, θFOV, which can be calculated using a simple trigonometric relationship:
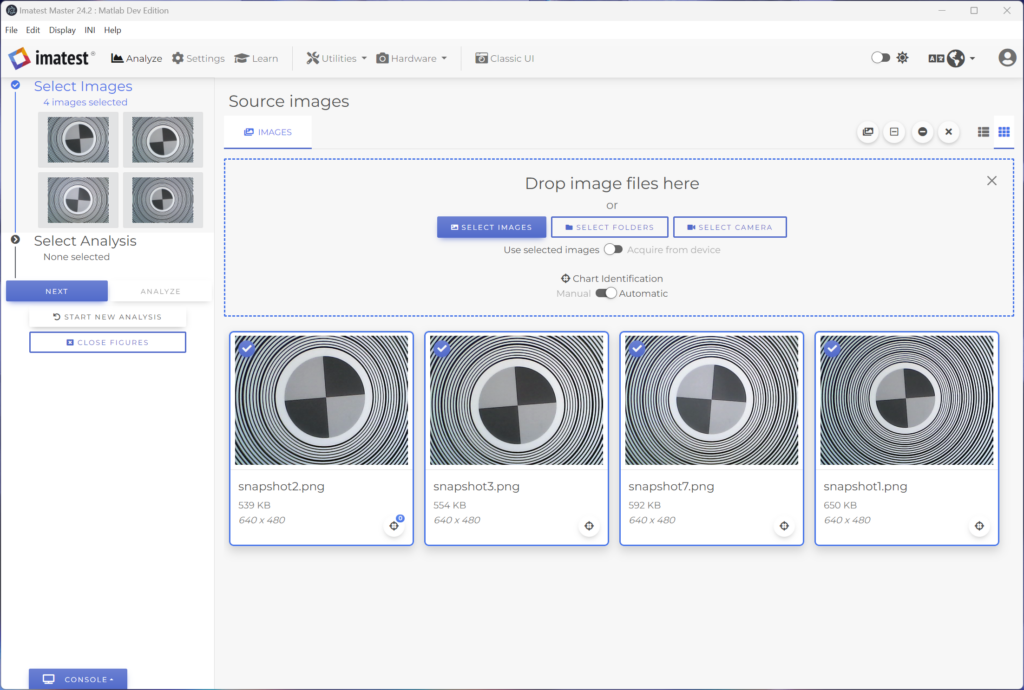
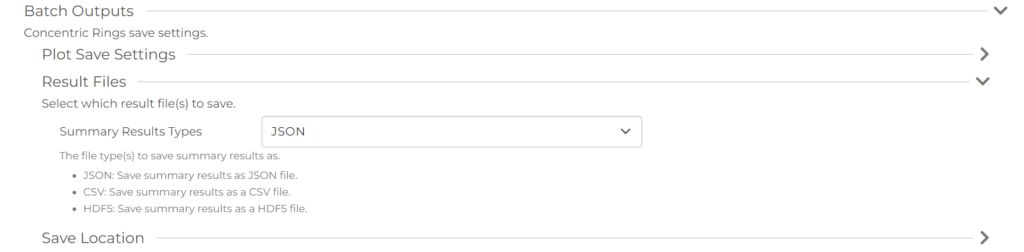
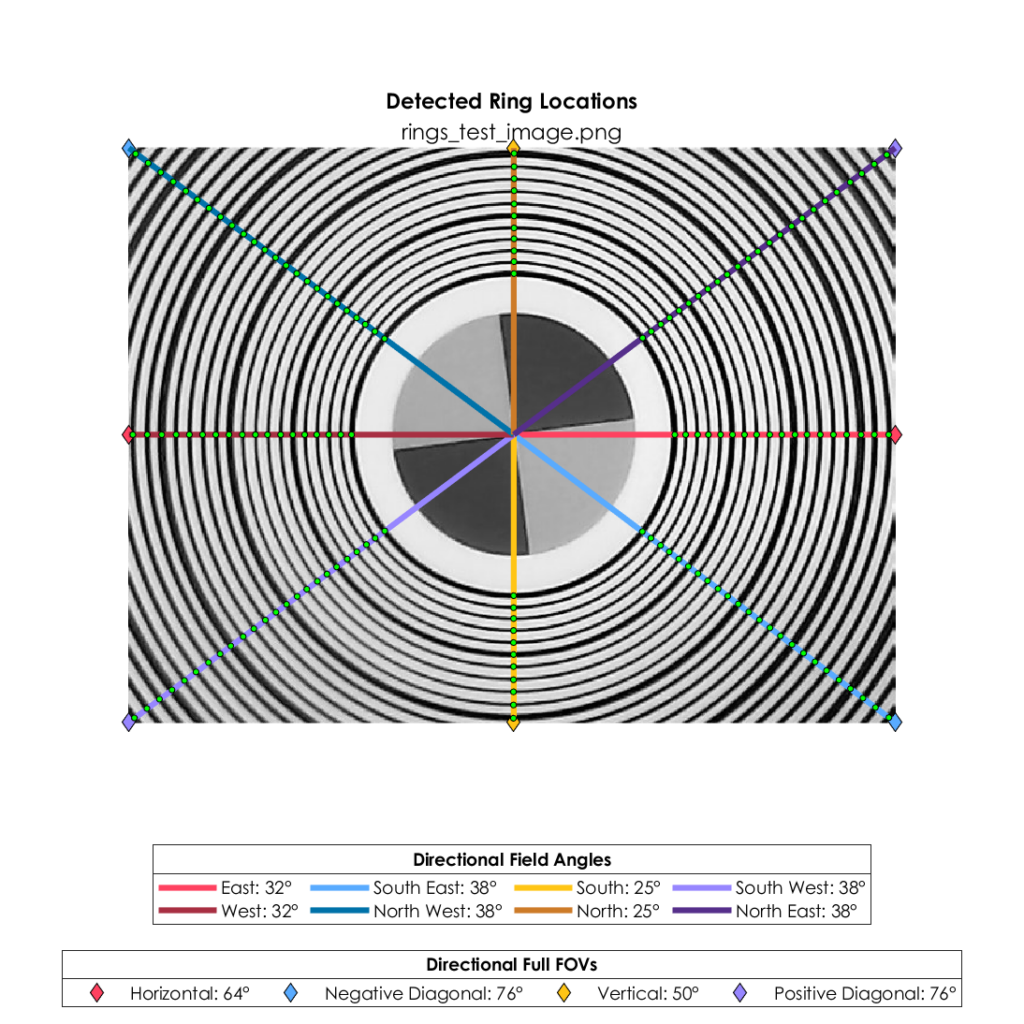
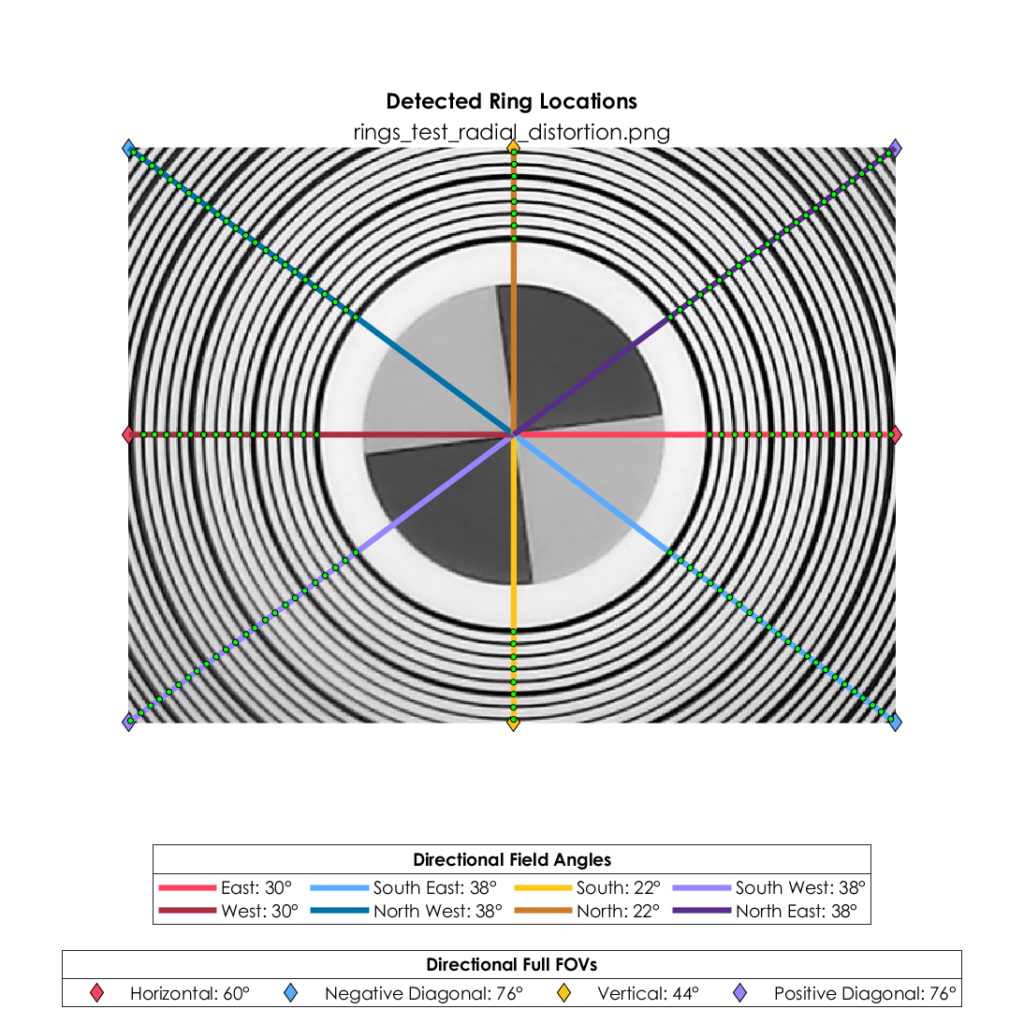
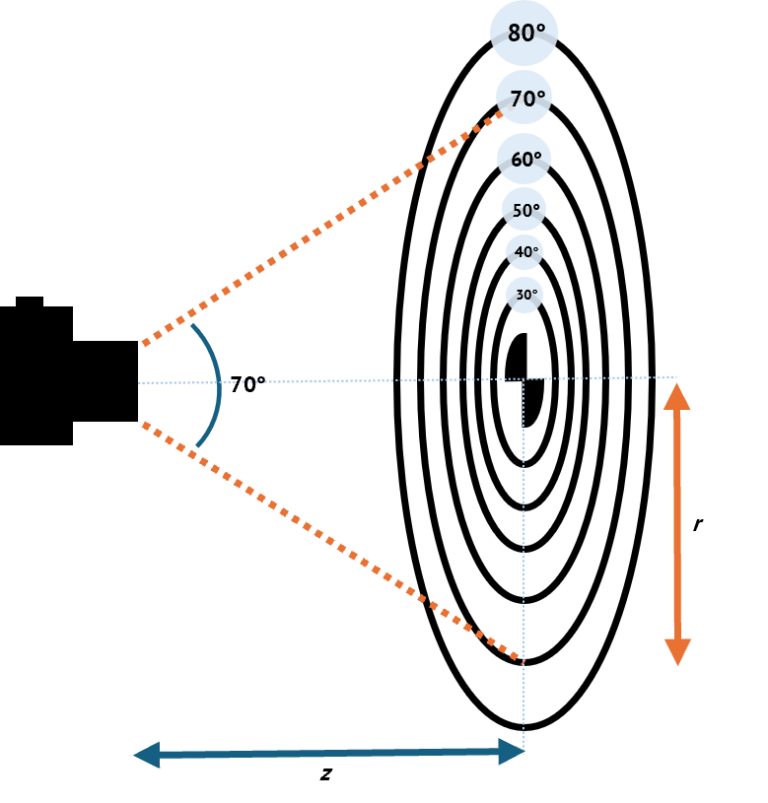
The largest visible ring or ring segment of the chart that is within the observable area for the specified working distance is used to determine the field of view of the lens-camera system in degrees.
In the illustration above, a camera-lens system centered with the chart at a distance z has a vertical observable area that extends to the 5th ring from the chart center. The 5th ring corresponds to a FOV of 70°, so the camera-lens system is determined to have a vertical FOV of 70°. The same methodology can be applied to obtain the estimated field of view in the horizontal and diagonal directions.
Asymmetric Fields of View
A lens-camera system may not have a symmetric field of view along a given axis. Even if the center of the chart is aligned with the center of the image frame, the system may demonstrate a greater field of view in one radial direction (for example, from center to top) than in another direction (for example, from center to bottom). This may be caused by the lens or by perspective distortion. This scenario is illustrated below.

To account for asymmetric cases, Imatest calculates the individual field angle for each of 8 radial directions extending from the center of the chart: East (E), South East (SE), South (S), South West (SW), West (W), North West (NW), North (N), and North East (NE):

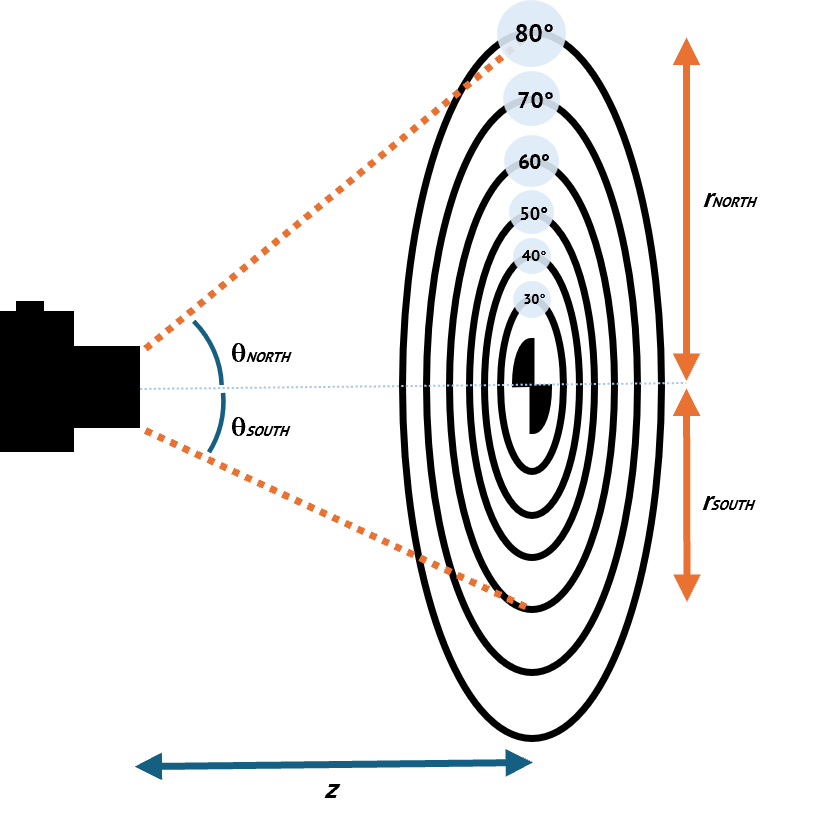
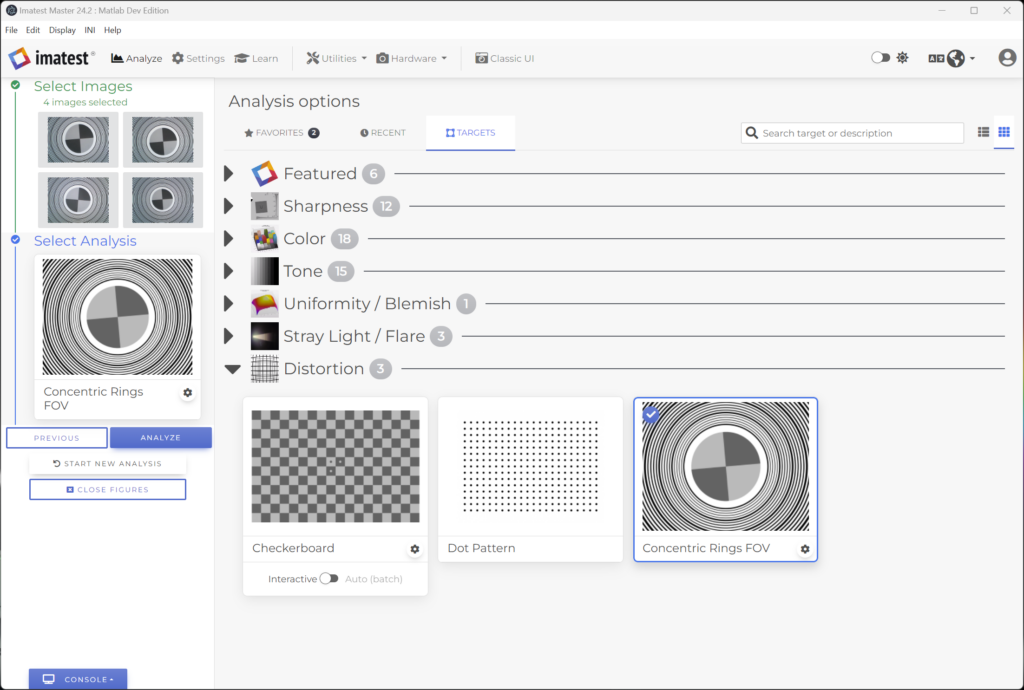
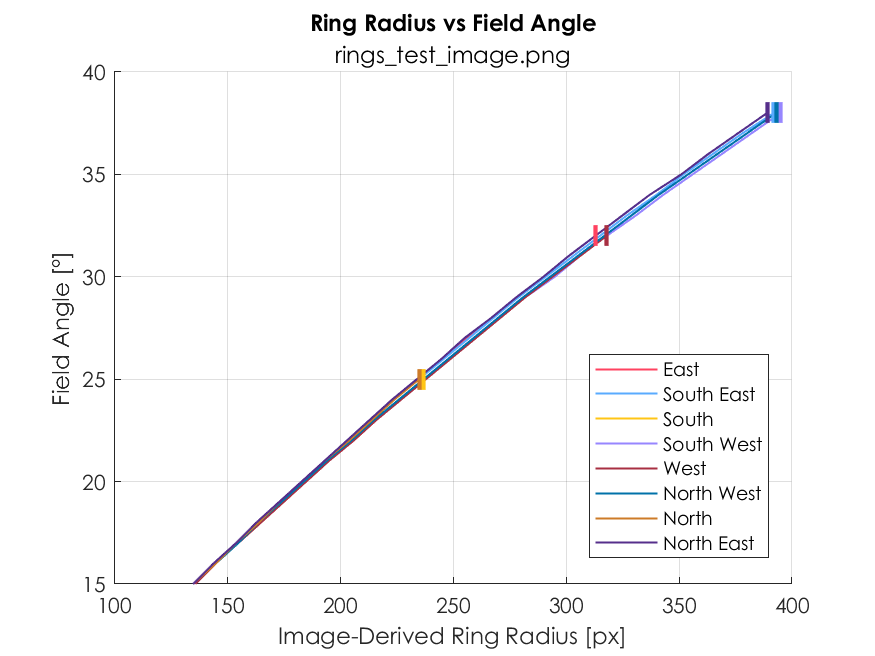
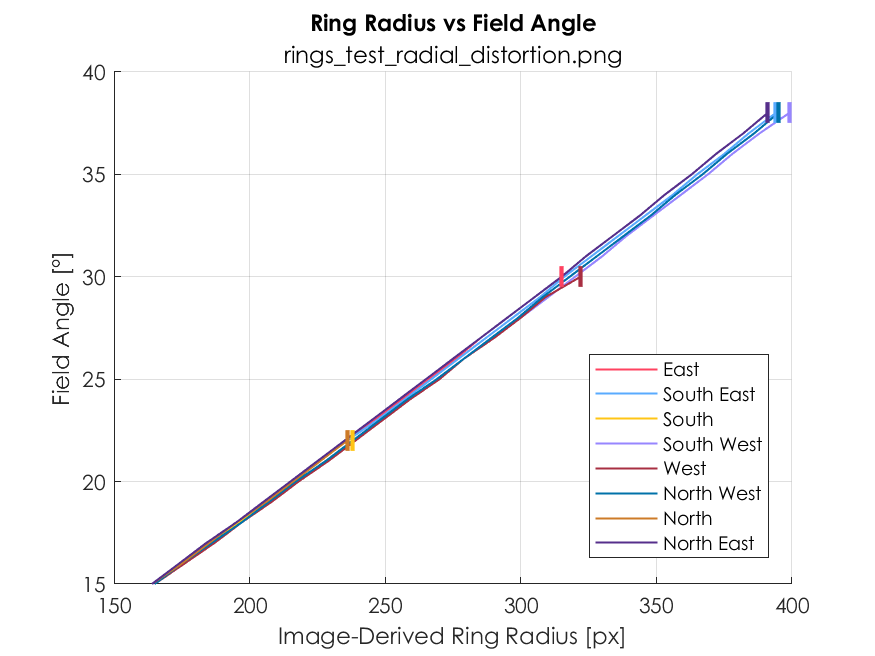
Now, for a known working distance, z, each ring of radius, r, on the target corresponds with a particular field angle, θFIELD, which can similarly be calculated as:
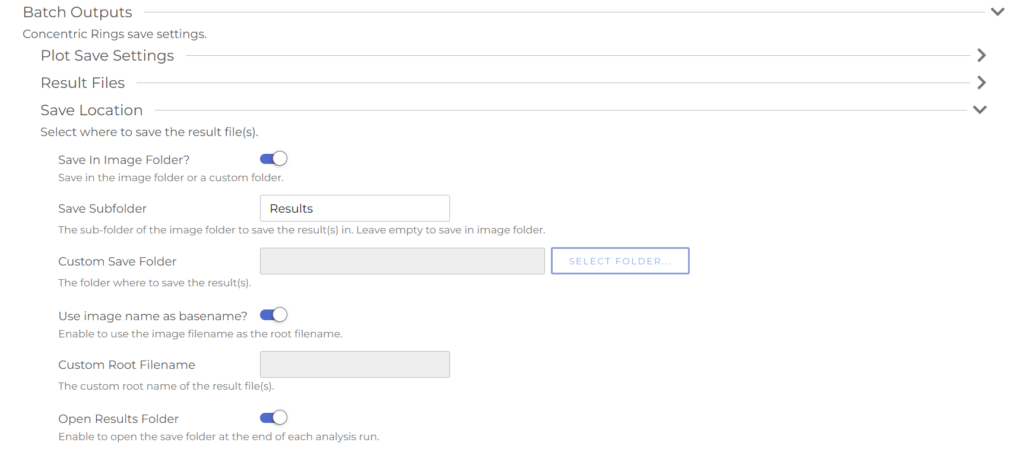
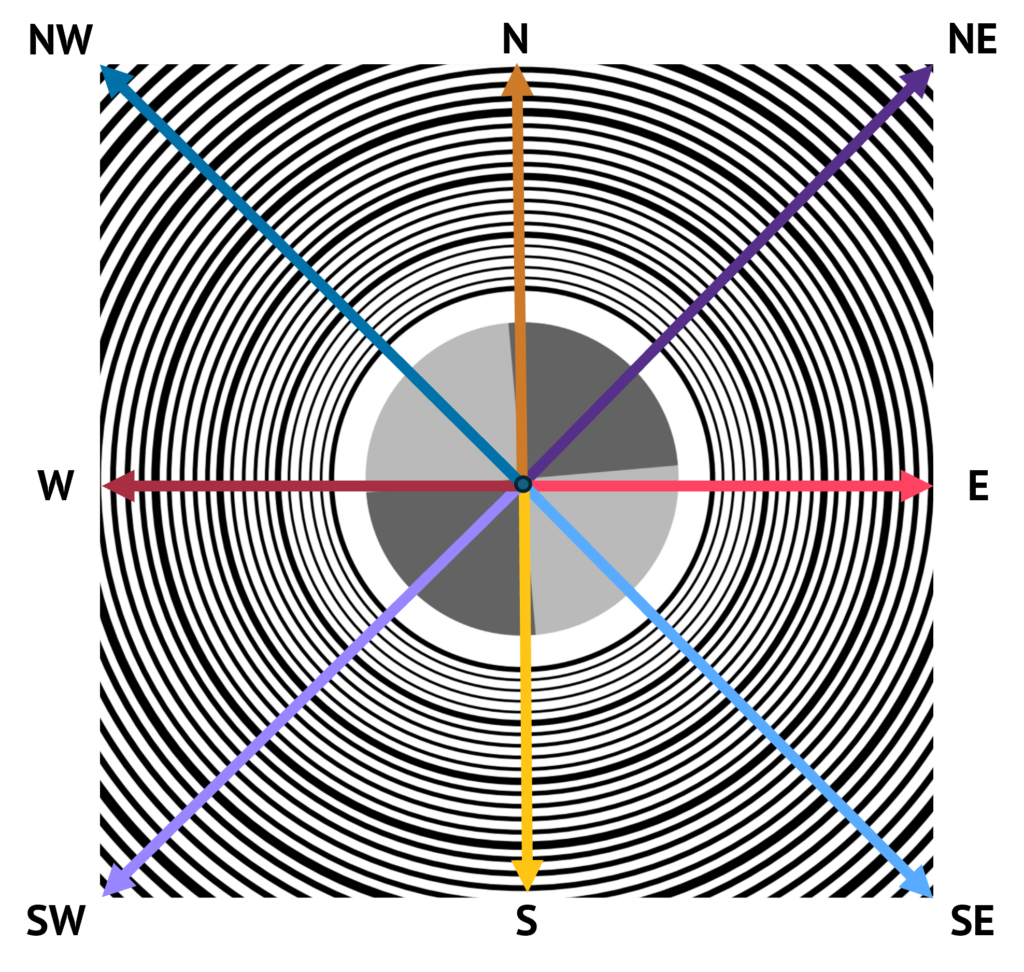
where the FIELD is one of the 8 radial directions. Imatest calculates the radius of each ring in mm from the input chart parameters provided in the Concentric Rings FOV Module settings, which are described in detail below.
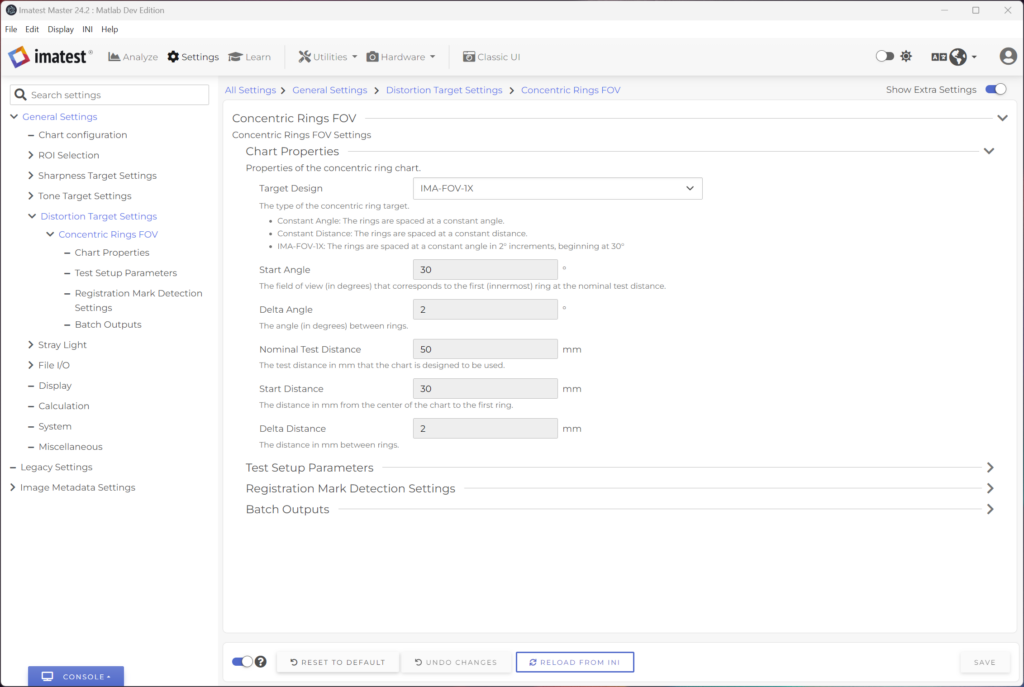
During analysis, the largest detected ring or ring segment in a radial direction of a chart image captured at the specified working distance is used to determine the directional field angle of the lens-camera system in degrees. The full field of view for a particular axis, θFOV.AXIS (vertical, horizontal, diagonal), is then the sum of the two opposite field angles that comprise the axis. For example, the vertical field of view for the camera-lens system illustrated above would be:
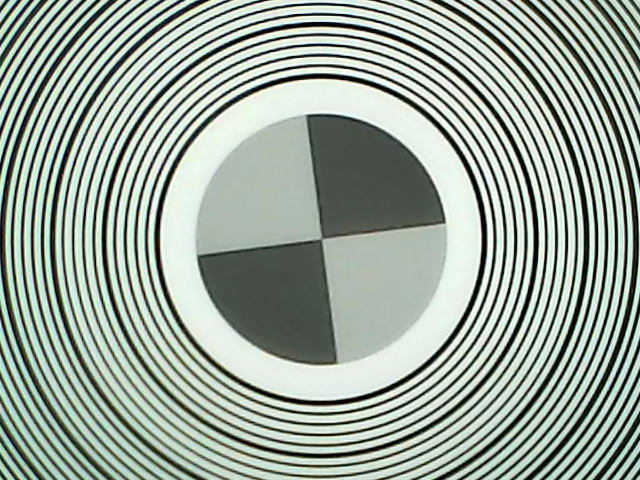
This method can be used for both symmetric and asymmetric camera-lens systems, and is the implementation used in Imatest.
Test Assumptions
Camera-Target Alignment
Camera-target Distance
The camera target distance is a measured and reported parameter of the test. The correct measurement of the camera-target distance affects all concentric rings FOV results and plots.
Decenter
Decenter refers to translations between the camera and the chart in the plane. Ideally the center of the chart (registration mark) should align with the center of radial distortion of the camera. Translations away from the ideal alignment will lead to different measurements along different radials.
Tilt (Perspective Distortion)
Tilt (or perspective distortion) refers to an angle between the plane of the chart and the plane of the focal plane array (camera detector), which ideally are parallel. Tilts away from parallel will lead to different measurements along each of the radials.
Distortion up to first ring
Under the assumption of no distortion from the center to the first ring, a distortion-free measurement can be inferred for subsequent rings.
The field of view and maximum field angle measurements are not affected by this assumption.
The following measurements can be affected by violations of this assumption:
- Optical Distortion Percentage
- Image Derived Ring Radius (mm)
- Chart Derived Ring Radius (px)
The following plots can be affected by violations of this assumption:
- Plot 3: Relative Distortion [mm]
- Plot 4: Relative Distortion [px]
- Plot 5: Optical Distortion Percentage
Getting Started in Imatest
Photograph the chart with your camera-lens system(s) under test, taking care to center the registration mark with the center of the image frame. The chart should be evenly illuminated to avoid glare, which can be problematic for accurate detection of the rings. The chart—designed to be used at the working distance intended for your system—should be in focus and should fill the entire image frame, if possible. For extremely wide FOV (fisheye) lenses that create circular images, it may not be possible to fill the entire image field. Minor light falloff at the edges of the image is acceptable, and is often unavoidable for extreme wide-angle lenses. An example 640×480 image is shown below. This test image contains some noticeable noise and artifacting.

Load image(s) into Imatest by dragging and dropping your image(s) into the Source Images tab in the main window, or by using the Select Images button to select and open images from the file explorer. Note that the Select Folders option is not supported for concentric rings analysis.

Select the analysis, by clicking Next or by clicking the Select Analysis block in the Workflow section of the main window. This will open the library of Analysis Options. Select the Concentric Rings FOV module, which can be found in the list of Distortion targets.

Settings
Open the settings by clicking the gear icon on the Concentric Rings FOV analysis card, or by navigating to All Settings > General Settings > Distortion Target Settings > Concentric Rings FOV in the Settings tab.

Chart Properties

Imatest supports two main types of concentric ring targets:
- Constant Angle: The angle between successive rings is equal. For example, if all of the rings are spaced 2° apart for a specified test distance.
- Constant Distance: The distance between successive rings is equal. For example, if all of the rings are spaced 2mm apart.
Definitions of Required Chart Properties for Each Target Type
- Constant Angle
- Start Angle: The full FOV angle (in degrees) corresponding to the first (innermost) ring at the nominal test distance.
- Delta Angle: The angle (in degrees) between rings for the specified nominal test distance.
- Nominal Test Distance: The test distance (in mm) for which the chart is designed to be used.
- Constant Distance
- Start Distance: The distance (in mm) from the center of the chart to the first ring.
- Delta Distance: The distance (in mm) between successive rings.

Test Setup Parameters
Specify your working distance in the Test Setup Parameters section of the settings. This is the measured test distance (in mm) used in your test setup, which may differ from your nominal test distance (the distance at which the chart was designed to be used).
Some reasons for differences between the nominal distance and the working distance may include:
- Measurement precision.
- Space constraints in your lab setup.
- The nominal test distance falling outside the depth of field of your lens.

Registration Mark Detection Settings
Successful detection of the registration mark on the concentric rings target is crucial for the accurate automatic analysis of the chart. The registration mark is used to determine the location of the chart center (which may differ from the image center), around which each of the concentric rings is centered. The default detection settings are often sufficient, but for images where the registration mark takes up a significant portion of the image frame, the ML/CV Autodetect method may be more robust. Additional details about the Registration Mark Detection Settings can be found in our Knowledge Base here.

Batch Outputs
The Batch Output Settings dictate the format and file save location for your analysis results. When analyzing a batch of images, separate results files will be created for each image.
Plot Save Settings
The Plot Save Settings allow you to choose the output save format for your plots, and whether you want to save and/or display the available plots at the end of an analysis. Available plot save formats include:
- JPEG: Joint Photographic Experts Group
- PNG: Portable Network Graphics
- Compressed TIFF: Compressed Tagged Image File Format
- Uncompressed TIFF: Uncompressed Tagged Image File Format
- MATLAB Figure: MATLAB Figure
- PDF: Portable Document Format
- EPS Level 3 Black & White: Encapsulated PostScript Level 3 Black & White
- EPS Level 3 Color: Encapsulated PostScript Level 3 Color
- EPS Level 2 Black & White: Encapsulated PostScript Level 2 Black & White
- EPS Level 2 Color: Encapsulated PostScript Level 2 Color
- SVG: Scalable Vector Graphics
Beginning in Version 25.1, an additional setting Plot 5: Optical Distortion Percent X-Axis, is enabled when Plot 5: Optical Distortion Percent is set to Save and/or Display. This setting allows you to choose which x-axis the optical distortion is plotted against from one of the following dropdown options:
- Field Angle: The x axis is the field angle in degrees.
- Distorted Radii: The x axis is the distorted radius in pixels.
- Undistorted Radii: The x axis is the undistorted radius in pixels.

Result Files
The Result Files Settings allow you to choose the output save format(s) for your data results files. Available data results formats include:
- JSON
- CSV
- HDF5
- XML

Save Location
The Save Location Settings allow you to customize how your results files are named and the file location where they are saved.

Once all of the settings have been chosen, click the Save button in the bottom right before returning to the Analyze tab.
Results
After returning to the main window, ensure you have selected your test image(s), and then click the Analyze button to begin the analysis. You can keep track of the analysis progress in the Console if you have the Info logging level selected.

Once the analysis is completed, the results files will populate in the file location specified in the Batch Outputs. Results files may consist of data files (CSV, JSON, HDF5) and/or plot image files, depending on your settings.
Plot Outputs
There are 4 output plot options available in the Concentric Rings FOV Module that can be saved and/or displayed after analysis has been completed. You can choose which plots to save or display in the Plot Save Settings during setup.
- Radius vs Field Angle
- Detection and FOV Summary
- Relative Distortion [mm]
- Relative Distortion [px]
- Optical Distortion Percentage


Plot 1: Radius vs Field Angle
Plot 1 displays the ring radius in pixels plotted against the estimated field angle in degrees for each of the 8 radial directions (East, South East, South, South West, West, North West, North, and North East). For constant angle charts, the distance between the rings on the chart gradually increases. As a result, when analyzing images with little to no distortion, expect to see a slight upward curve in each of the lines, as shown in the plot for Test Image 1 below. Curves for constant distance chart, on the other hand, will appear linear for undistorted images.
For images that contain some amount of radial distortion, such as Test Image 2, it is common for the curves to appear more linear.


Plot 2: Detection and FOV Summary
Plot 2 contains the analysis image marked with the detected ring locations along each of the 8 radial lines, and a summary of the estimated field angles and directional fields of view (horizontal, vertical and positive/negative diagonals).


Plot 3: Relative Distortion [mm]
Plot 3 estimates the relative distortion by plotting the true ring radius (in mm) calculated from input chart parameters in the Chart Properties settings section against the estimated ring radius (in mm) that is derived from the test image.
This plot makes it easy to quickly identify the presence of distortion in your test images in real-world units, which is shown by the deviation of the curves from the 1:1 (no distortion) reference line. This is illustrated for both of the test images below.
DISCLAIMER: This calculation makes an assumption that there is no distortion in the image from the chart center to the first ring. This assumption allows us to estimate the millimeters per pixel conversion for the given test image, which is used to calculate the image-derived ring radii (in mm).


Plot 4: Relative Distortion [px]
Plot 4 is the same as Plot 3, but instead of millimeters, it estimates the relative distortion by plotting the estimated ring radius in pixels, calculated from input chart parameters in the Chart Properties settings section against the ring radius (in px) that is detected from the test image.
This plot makes it easy to quickly identify the presence of distortion in your test images in image-space units, which is shown by the deviation of the curves from the 1:1 (no distortion) reference line. This is illustrated for both of the test images below.
DISCLAIMER: This calculation makes an assumption that there is no distortion in the image from the chart center to the first ring. This assumption allows us to estimate the millimeters per pixel conversion for the given test image, which is used to calculate the chart-derived ring radii (in px).


Plot 5: Optical Distortion [%]
Plot 5 displays the optical distortion percentage along each of the radials.
The optical distortion percentage is computed by
\(OD[\%] =\frac{r_u-r_d}{r_u}\cdot100\%\)
DISCLAIMER: This calculation makes an assumption that there is no distortion in the image from the chart center to the first ring. This assumption allows us to estimate the millimeters per pixel conversion for the given test image, which is used to calculate the optical distortion percentage.


Data Outputs
All results file formats (JSON, CSV, HDF5, XML) output the data from your analysis run. If multiple images are analyzed, a separate set of results and plot files will be saved out for each image. You can customize the formats in which results are saved in the Batch Save Settings during setup.
Results files contain information about your Imatest version, analysis run, your selected settings, and all of the field of view, field angle, and raw data calculations. Descriptions for each of the fields in the results files (as they appear in the output JSON file) are detailed on the Imatest results page.