Starting with Imatest 3.9, Imatest provides strong support for CPIQ (Camera Phone Image Quality)* Phase 2 measurements. Further detail is available in the CPIQ 2.0 Specifications & Test Methods document. Contact us if you need further information. We are members of CPIQ, and we will will add updated measurements as they become available (expected in early 2016).
*CPIQ formerly belonged to I3A (International Imaging Industry Association). It now belongs to the IEEE Standards Association, Working Group P1858.
SFR and Acutance
For CPIQ, sharpness is measured as Spatial frequency response (SFR) (also called Modulation Transfer Function (MTF)). The SFR, SFRplus ( using slanted-edges with a contrast of 4:1), or Random/Dead Leaves modules can be used for this purpose. The CPIQ document recommends the new ISO 12233 low-contrast slanted-edge test chart (under development by the ISO TC42 committee, to be released in 2013, maybe). The version shown in the CPIQ document is somewhat out-of-date. Imatest will offer the new chart in its store in either 24×36 or 40×60 inch print size. Here is a sample of the chart.
 New ISO 12233 low-contrast slanted-edge chart
Although the new ISO-12233 chart produces perfectly good results with SFR, Imatest recommends a 4:1 contrast SFRplus test chart, which is compatible with the ISO chart, but offers better automation, more edges for a more detailed map of SFR over the image surface, and several additional measurements. This chart is available from the Imatest store.

SFRplus 5×7 4:1 contrast test chart (with focus star)
Acutance is a perceptual measurement designed to answer the question, “how sharp does the image look?” It is closely related to Subjective Quality Factor (SQF), differing only in the details of the equation. It is calculated from MTF (SFR), a model of the human visual system Contrast Sensitivity Function (CSF), and viewing conditions (image height and viewing distance). The CPIQ 2.0 document defines it but gives little indication of how it should be displayed.Imatest displays it in exactly the same way as SQF, which provides many of options. To obtain Acutance measurements, open SFR, SFRplus, Random/Dead Leaves (or other Rescharts module), then click on the button in the Settings window (More settings in SFRplus). Click on the button to select the acutance calculation. Plot type can be SQF or Acutance (standard plot) or JND (Just Noticeable Difference: CPIQ Phase 2 equation. You’ll have to make some assumption on the viewing conditions. See SQF/Acutance for details.

SQF/Acutance settings window
Here are results. We have assumed that viewing distance is proportional to the square root of the print height (which fits my (NLK’s) experience of photography galleries). It can be fixed or have a cube root function.

Acutance results for viewing distance = 20*sqrt(PH/10) or 15 cm, whichever is larger
for Picture height from 2 to 40 cm (0.8-16 inches)
Color variability
The CPIQ color variability metric, maximum ΔC, is displayed in Light Falloff and Uniformity-Interactive when Grid plot is set as follows.

Grid plot settings
Here is the resulting grid plot.

Light Falloff (or Uniformity-Interactive) 15×20 grid plot for ΔC and ΔE
The CPIQ color uniformity metric is displayed on the lower-right: Maximum ΔC = 2.606 is the CPIQ metric of color variability.
Lens Geometric Distortion & Chromatic Aberration
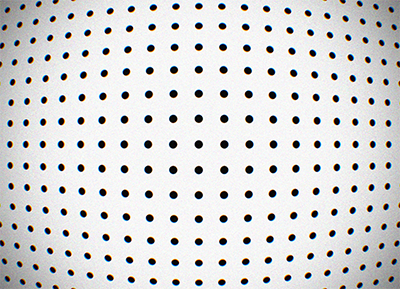
| Both lens distortion and chromatic aberration are measured by photographing a dot pattern chart and analyzing it with the Dot Pattern module. |
The image on the left, below shows Lateral Chromatic Aberration as a function of image radius in pixels. The image on the right,below shows optical and SMIA TV distortion.
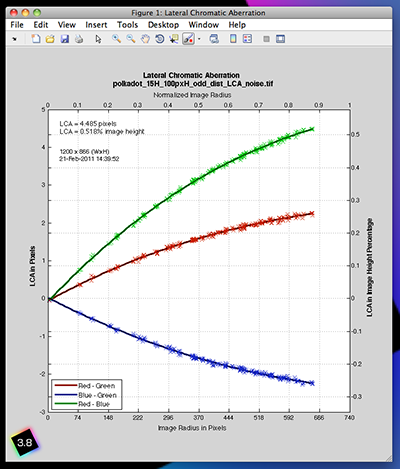 Lateral Chromatic Aberration
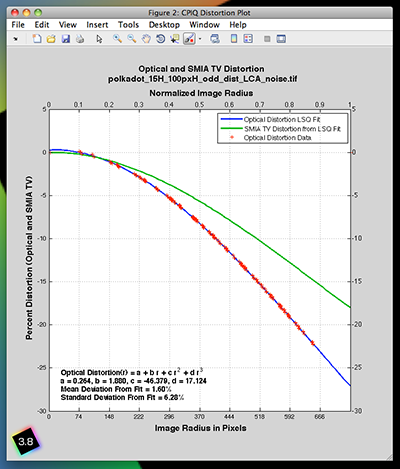 Optical and SMIA TV distortion
Texture
The CPIQ Phase 2 “Initial work on texture Metric” document calls for an analysis of the “Dead Leaves” pattern but provides little detail about how the results are to be displayed. It mentions Noise Power Spectrum (NPS), which is also called the Power Spectral Density (PSD). PSD is the square of the MTF.
Imatest has introduced a new version of the Dead Leaves chart, called the Spilled Coins chart, that has several advantages over existing Dead Leaves charts.
- It is almost perfectly scale-invariant, i.e., results do not depend on magnification, and an MTF exponent of -1 (Power Spectral Density of -2) accurately characterizes the chart.
- It is more uniform than existing charts.
- The gray areas to the left and right of the chart have the same average density as the active area, making them suitable for calculating noise PSD to be subtracted from the PSD of the central “spilled coins” area.
- It contains slanted-edges for comparing MTF calculations.
- It is available now in several sizes, surfaces, and black and white or color from the Imatest Store.
 chart")
The Imatest Spilled Coins chart (Black & White version)
The MTF or PSD of Dead Leaves images can be measured by the Imatest Random/Dead Leaves module (a part of Rescharts). This module was designed for random (or near-random) patterns with a 1/f spatial frequency response, which is equivalent to 1/f 2 Power Spectral Density (PSD). Such patterns are scale-invariant, i.e., its spectrum is independent of magnification; it isn’t affected by changing distance from the chart. This makes extremely convenient for measurements.
Random/Dead Leaves analyzes two types of target.
- The purely-random scale-invariant target, which is the best (i.e., worst-case) pattern for measuring texture because it lacks any sort of edge feature; hence it maximizes noise reduction and minimizes sharpening.
- The Dead Leaves (Spilled coins) pattern, which has some (curved) edges; it has the attribute of being more representative of real images. It will often yield a more extended (i.e., better) MTF/PSD response than the random pattern.
The slanted-edge (particularly high contrast edges) is the opposite extreme of the random: it minimizes noise reduction and minimizes sharpening, hence it gives little information about a camera’s texture response. CPIQ and the new ISO 12233 standard call for 4:1 edge contrast— much lower than the old ISO 12233 standard, which called for a minimum contrast of 40:1— an extremely high contrast level that created all sorts of problems (errors due to clipping, excessive sharpening, etc.) This is an improvement, but still not a good texture measurement.
There are a few errors in Figure 2 (Culling Matrix) of the CPIQ texture document. White noise is not scale invariant, and is quite difficult to use because it becomes smooth gray at large distances. Log Frequency is nearly scale invariant and has a complete representation of texture (with the Log F-Contrast target).
The PSD exponent of the Spilled Coins chart is different from the PSD (i.e., NPS) of the Dead Leaves target shown in Figure 4. It is -2 (i.e., scale-invariant, which is the ideal value) rather than -1.86 . We show a few results below. Full details are on Random/Dead Leaves.

Random/Dead Leaves Settings window. Exponent set to -1 (for PSD = -2)
Here are MTF results for a raw image (Panasonic Lumix DMC-G3 (Micro Four-Thirds) camera with a 14-45mm f/3.5-f/5.6 zoom lens, set at ISO 800, f/8, 28mm). Both raw and JPEG images were saved and analyzed. Crops of the image are on Texture examples.

MTF (linear frequency scale) for 8 segments of the Spilled Coins pattern
(raw image; default demosaicing). Click here to view a crop of the raw image.
| Next we show the PSD of the raw image. |
The plot on the right shows the original signal+noise PSD from the Spilled Coins area (bold red line), the noise PSD from the gray areas to the left and right (bold brown line), and the signal PSD of the Spilled Coins area after the noise PSD has been subtracted (bold blue line) using the McElvain et. al. technique. Spatial frequency is displayed on a logarithmic scale.
This plot is primarily a check to verify that an appropriate amount of noise has been subtracted from the S+N signal so that a correct value of MTF is calculated and displayed (i.e., so that noise does not masquerade as signal— valid MTF response).
PSD and noise of the raw image
The Dead Leaves pattern is typically framed so it takes up about 1/3 of the image linearly (about 1/10 by area). This number may be vary depending on the chart design and the pixel size of the image (the pattern will require more space in low-resolution images such as VGA). More details on Random/Dead Leaves. The chart is available in several configurations from the Imatest Store.
