Introduction
SFRplus is one of several Imatest modules that measures distortion and Field of View (FOV). Distortion: Methods and Modules has a detailed comparison of their capabilities. A key attribute of SFRplus is that it gives correct distortion and field of view measurements with pre-distorted charts, which enable measurements to be made close to the edges of the image with strongly barrel-distorted (fisheye) lenses.
Pre-distorted charts
The Imatest SFRplus module can handle moderately distorted images but it fails for extremely barrel-distorted images. (We’ve never seen an extremely pincushion-distorted image.) To handle this we provide charts that are distorted inversely to lens distortion, i.e., that have pincushion distortion. For testing a fisheye lens you should select a chart that has the approximate inverse of the lens distortion; it doesn’t have to be exact. When the correct chart is chosen the chart image will have low enough distortion to be properly analyzed. Although SFRplus can analyze images with large amounts of distortion, many currently-available lenses, some with fields of view of 180 degrees or more (not uncommon in the automotive industry), can only be analyzed with SFRreg.
The Imatest store offers several pre-distorted SFRplus charts that enable SFRplus to work with highly barrel-distorted (fisheye) lenses. These charts can be purchased from the Imatest store or printed from SVG files created with the Imatest Test Charts module (though we only recommend printing your own chart if you have a photographic-quality wide-body printer, a knowledge of color management, and skill in operating the printer). Here is an example of Test Charts settings for a pre-distorted chart.
 Test Charts window for creating a highly pre-distorted SFRplus chart
Note the two distortion parameters at the lower-right of the image: [1.167 1.577]. These must be entered in the More settings window for SFRplus analysis to obtain correct distortion and Field of View (FoV) measurements.
Running SFRplus & Algorithm
Distortion measurements are a part of standard SFRplus runs. You can follow the standard SFRplus instructions, but there are a few measurements you’ll need to pay attention to. These are set in the window, which can be accessed from the SFRplus settings window (that appears whenever SFRplus is run) or from the Rescharts window (at any time).
 SFRplus settings that affect distortion and Field of View calculations
Bar-to-bar Chart height cm. Must be entered to calculate the Field of View in cm.
Lens-to-chart distance cm. Must be entered along with Bar-to-bar chart height to calculate angular Field of View in degrees.
Distortion parameters You should enter the numbers printed in light gray (to not interfere with bar detection) on the lower-right of the chart. Typical values are [0.8333 1.123] for the standard pre-distorted chart and [1.167 1.577] for the extra pre-distorted chart. Use the default values of [0 0] for undistorted charts. Charts with custom distortion (selected by clicking Normal custom distort in the Invert Lt/Dk, Distortion, Special… dropdown menu) have different values.
Distortion calculation selects the equation to use for calculating SMIA TV distortion (a summary metric) and Field of View, both of which involve extrapolating distortion beyond the bars. The fourth selection, Use best of above, is generally recommended.
Imatest SFRplus uses three models of distortion. Both undistorted radius ru and distorted radius rd are normalized to the center-to-corner distance.
- 3rd order ru = rd + k1 rd3 where k1 = 0 for no distortion; k1 < 0 for pincushion distortion; k1 > 0 for barrel distortion.
3rd order distortion is the simplest: it corresponds to the classic seidel aberration. It works well for small amounts of distortion, but fails for large amounts. It generally fails when pre-distorted charts are used. - 5th order ru = rd + h1 rd3 + h2 rd5
5th order distortion provides more accurate results than 3rd order distortion, though the optimizer may be slower. It is the best equation for “mustache” or “wave” distortion (where the predominant distortion switches from barrel to pincushion along the radius). - arctangent/tangent (arctan/tan)
ru = tan(10 p1 rd )/ (10 p1 ) ; k1 > 0 (barrel distortion)
ru = tan-1(10 p1 rd )/ (10 p1 ) ; k1 < 0 (pincushion distortion)
Arctan/tan is the best representation for distortion in standard fisheye lenses, though we’ve seen some strange lenses that fit 5th order better. - Best of the above
Distortion: Methods and Modules contains additional distortion equations used in other Imatest modules (especially for Checkerboard).
Algorithm: The optimizer for calculating the distortion coefficients (k1 for 3rd order; h1 and h2 for 5th order; p1 for arctan/tan) is run for each equation. It works by finding the straightest top and bottom bars and the most even distances between the left edges and right edges of the squares in the center row of the SFRplus chart. The optimizer returns a residual error— the square root of the sum of the squares of the errors. This number is a reliable, robust indicator of how well the optimizer worked. When Use best of above is selected for the distortion calculation, the calculation with the lowest residual error is selected. This choice is strongly recommended because it is not always possible to predict which equation will give the best solution (though it’s occasionally obvious– 5th order works best for visible “mustache” or “wave” distortion).
Framing and cropping SFRplus for distortion measurementsDistortion measurements are derived from the detected square locations in the center row as well as the bars at the top and bottom of the chart. If any of the squares in the center row are detected incorrectly— which can happen if there are interfering patterns just outside the chart— the distortion measurement will be incorrect. This is best handled by avoiding interfering patterns outside the chart, but can also be fixed by cropping the chart. Here is an example. |
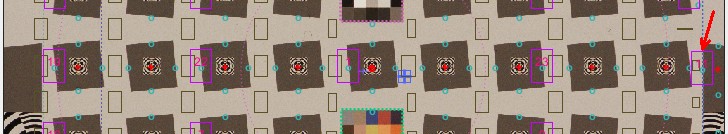 In this image interfering patterns on the right side of the image caused the right-most square to be incorrectly detected (red arrow), resulting in an error in the distortion measurement. In this image interfering patterns on the right side of the image caused the right-most square to be incorrectly detected (red arrow), resulting in an error in the distortion measurement. |
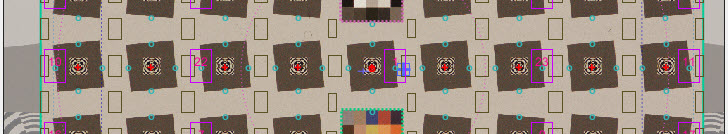 Cropping the image (the crop limits are the cyan lines near the left and right sides), corrects the detected location of the right-most square as well as the distortion measurement. Cropping the image (the crop limits are the cyan lines near the left and right sides), corrects the detected location of the right-most square as well as the distortion measurement. |
Results
SFRplus distortion results are located in the 8. Image, Geometry, Distortion, FoV display.
 SFRplus Image results, showing distortion and Field of View.
The three sets of distortion coefficients (3rd order, 5th order, and arctan/tan) are shown in the second line below the image.
SMIA* TV Distortion (barrel or pincushion), the selected equation (5th order in the above image) and the Distortion parameters (for non-zero values— pre-distorted charts-only) are shown in the third line. If Use best of above was selected in the Distortion calculation dropdown menu, the actual selected calculation is shown. [*SMIA is the now-defunct “Standard for Mobile Imaging Architecture”, started by Nokia and STMicroelectronics in 2004.]
 TV Distortion from the SMIA specification, §5.20. Referring to the image on the right,
SMIA TV Distortion = 100( A-B )/B ; A = ( A1+A2 )/2
The box on the right is described in the SMIA spec as “nearly filling” the image. Since the test chart grid may not do this, Distortion uses a simulated box whose height is 98% that of the image. Note that the sign is opposite of k1 and p1. SMIA TV Distortion > 0 is pincushion; < 0 is barrel.
Algorithm: SMIA TV Distortion is not actually calculated from the upper and lower bars, whose locations can vary considerably in different images. Instead it is calculated from the distortion coefficients: using the selected equation, using virtual horizontal lines located 1% of the image height below the top and above the bottom of the image.
 SMIA vs. traditional TV distortion SMIA vs. traditional TV distortionSMIA TV distortion is twice as large (2X) as traditional TV distortion. The traditional definition, shown on the right, has been adapted from the publication “Optical Terms,” published by Fujinon. The same definition appears in “Measurement and analysis of the performance of film and television camera lenses” published by the European Broadcasting Union (EBU). |
At Imatest we prefer the SMIA definition, which has been widely adopted in the mobile imaging industry, because it is self-consistent. In the traditional definition, TV distortion is the change (Δ) of the center-to-top distance divided by by the bottom-to-top distance. In the SMIA definition, both A and B are bottom-to-top distances.
However the traditional TV distortion is likely to be included in an upcoming ISO standard. When this happens we’ll offer a choice (a checkbox).
Distortion correction display
Clicking the Distortion correction checkbox displays the chart image with distortion corrected. Different distortion calculations (3rd order, 5th order, arctan/tan) may be compared. Note: For large images, the display may be very slow when Distortion correction is checked.
- If nonzero Distortion parameters have been entered, the original chart is displayed. This may not be useful for visual judgment, but the chart edges, if visible, will be straight in this case.
 Distortion correction checked, Distortion parameters kept for the standard pre-distorted chart.
The chart edges (shown inside the red ellipses at the bottom) have been straightened.
|
This image may be compared with the standard pre-distorted chart, shown on the right. Note that the square aspect ratio is rather odd for this image— squares are wider than they are high.
|
 |

Distortion correction checked, Distortion parameters set to 0.
The top and bottom bars have been straightened.
Summary: Imatest SFRplus has powerful distortion calculation capabilities. It can select the best of three available distortion equations (any of which may be the best for a given lens). The Distortion correction checkbox allows the distortion calculation to be visually checked for effectiveness.
Radial distortion plot
The radial distortion plot (selected with Radial Distortion plot) adds considerable detail to results in the Image, Geometry, Distortion, FoV display. This plot has four display options: 1. Delta-r, or 2. Lens Geometric Distortion (LGD), 3. r undistorted (ru), or d(LGD)/d(rd). LGD is shown below.
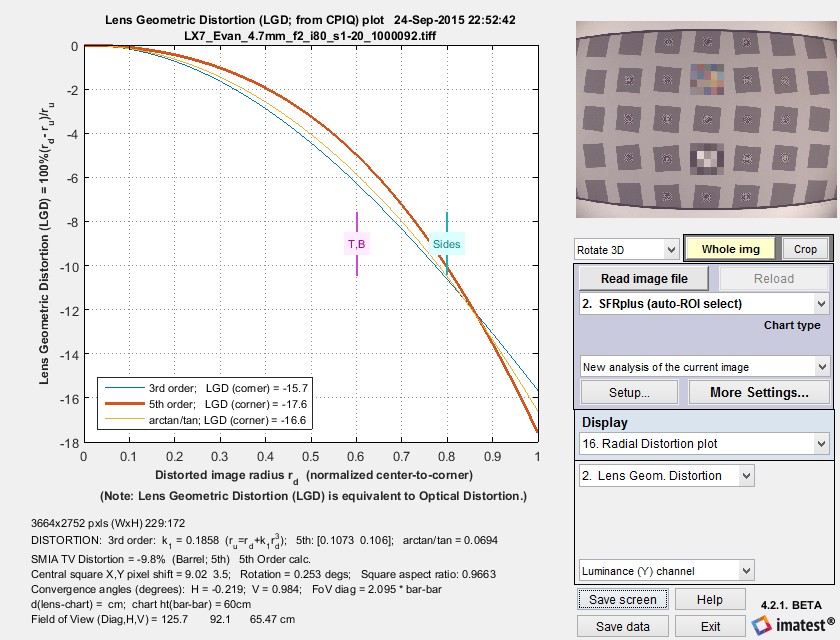 SFRplus Radial Distortion plot showing Lens Geometric Distortion 100% ( rd – ru)/ru
The display options are
- the change in radius Δr (normalized to the center-to-corner distance, i.e., the half-diagonal) as a function of the distorted (input) radius rd.
Δr = r(undistorted) – r(distorted) = rd – ru - Lens Geometric Distortion (LGD), which is included in the CPIQ Phase 2 specification, and is equivalent to Optical Distortion (defined by Edmund Optics).
LGD = 100% ( rd – ru)/ru - Undistorted radius, ru
- Curvature d(LGD)/d(rd). This curvature (new in Imatest 5.0) may be useful for determining the visual degradation caused by distortion, which is likely to be proportional to the maximum-minimum values. A change in sign may be a better indicator of mustache (wave) distortion than a change in 5th order polynomial sign (which isn’t always calculated).
The bold solid lines show Δr or LGD for correction formulas: ru = rd + k1 rd3 (3rd order; blue); ru = rd + h1 rd3 + h2 rd5 (5th order; green); or the arctan/tan equations (red). With these equations |Δr| often increases as a function of r(distorted), i.e., it tends to be largest near the image corners. The selected value (or the one with the least error, err) is shown in boldface.
Comparison with other modules— Distortion: Methods and Modules contains a detailed comparison of SFRplus distortion results with Distortion, Dot Pattern, and Checkerboard.
Final observations:
- SMIA TV distortion may not be meaningful for highly-distorted (extreme fisheye) lenses, especially when the image circle of the lens is inside the image. In some cases when the answer seems to be unreliable, “NaN” is returned for SMIA TV distortion.
- “Mustache distortion” may appear when the two 5th order coefficients have the opposite sign. A better indicator may be a change in sign of the curvature, shown in the Radial Distortion plot.
