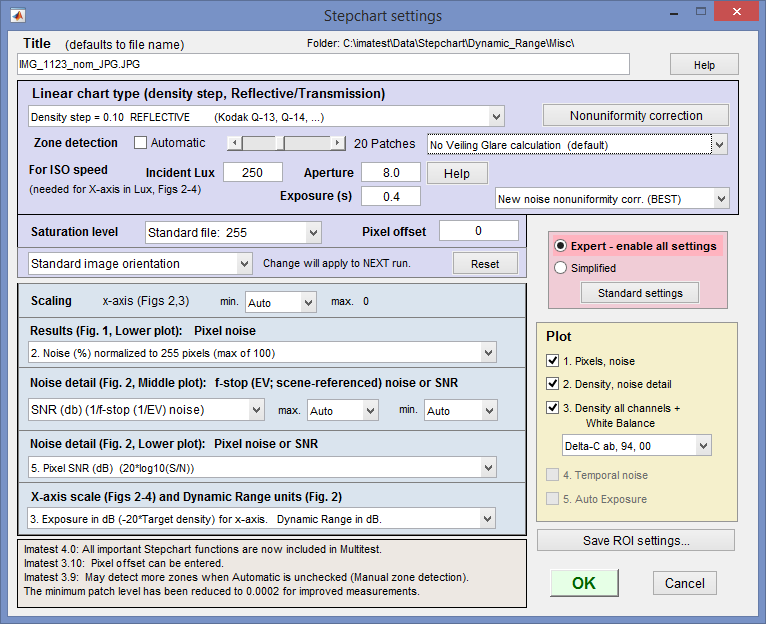
Stepchart measures the tonal response, noise, dynamic range, and ISO sensitivity of digital cameras and scanners using
- Reflection step charts such as the Kodak/Tiffen Q-13 and Q-14 Gray Scales, which have a single row of patches (a linear arrangement), or
- Transmission step charts such as the Imatest 36-patch Dynamic Range Chart or charts from Stouffer, Applied Image, Kodak, DSC Labs, and Danes-Picta. Transmission charts, which have higher maximum densities than reflective charts, are required for measuring dynamic range from a single image.
- Additional ISO charts such as ISO-14524 and ISO-15739, with non-linear (multiple rows; may be circular) patch arrangements, shown below. (Imatest Master only)
Because Stepchart is included in Imatest IT/EXE and DLL, users may need to examine or edit the INI file used to control IT versions. Stepchart settings are stored in the [q13] section of the ini file. [q13] is an old name that has been kept only for backwards compatibility— in Imatest 1.0 the module now called Stepchart analyzed only the Q13 and Q14 charts.
Most of the settings in the [q13] section are set by the Stepchart window. A few are set by responses to other windows or user actions.

Stepchart settings window
INI file settings that affect several modules are described in Imatest INI Reference.
| (-IT) | Not used in Imatest IT |
| (gr) | Affects graphics (figures). May not be of interest for Imatest IT, where graphics is often suppressed. |
| (index) | Setting is equal to the index of the popup menu. You’ll need to open the Settings window to see these: Never used for important IT settings. |
| (index-1) | Setting is equal to the index of the popup menu – 1 (0 – (index-1)). Keeps backwards compatibility for some settings that were originally 0 (off) or 1 (on), but had options added. |
| ♠ |
Set in Blemish detect settings window |
| ρ |
Set during image read or region selection |
| σ | Set in Save results window |
| ◊ |
Set in other window |
Table of [q13] settings
| Parameter | Typical values [default] |
Description | Notes |
| ITEtype | |||
| Lastfile | |||
| Lasttype | |||
| Refile | |||
| Refolder | |||
| altchart | |||
| altchartype | |||
| autopatch | |||
| bayeraw | |||
| chart_value | |||
| closefigs | |||
| distort | |||
| figsave | |||
| filecomb | |||
| fillf | |||
| folder | |||
| roi | 899 950 3029 1124 3029 950 899 1124 |
ROI (Region of Interest) for last n images: 8 numbers per image corresponding to the widths and heights in the nwid_save and nht_save variables. These 8 numbers define 4 corner ponts of a Quadrilateral which can be used to adjust for rotation and keystone distortion. Order of variables: #1: X(tl) #2: Y(tl) #3: X(br) #4: Y(br) #5: X(tr) #6: Y(tr) #7: X(bl) #8: Y(bl) |
Sample data
[q13]
= 0.6 0.6 0.65 0.65
= C:ImatestDataClass_examplesColor_stepchart_examples
fstmax_string = Auto
fstmax_value = 1
fstmin_string = Auto
fstmin_value = 1
iso15739type = 1
lastdens = 0.1 0.19 0.3 0.41 0.53 0.66 0.81 0.97 1.17 1.39 1.66 2 0.77 0.9 1.05
lastfiles = “GF1_ColorStep_4700K_45mm_f8_i100_1030244.JPG”
linfixp = 1
luxinc = 220
mirror = 0
mxn = 4 6
nht_save = 3000 480 271 237
noisenorm = 5
noiseres = 2
nonualgorithm = 1
nonucorr = 0
nonufile =
nonugamcolsp = 0
nonugamma = 0.5
nonulevel = 1
nonusave = 1
nwid_save = 4000 640 2710 862
oecf20type = 1
plot2lux = 1
plt_fstopn = 2
pltallch = Max
pltemporal = Max
pltnoise = Max
pltpix = Max
progm = Stepchart
progmalt = ISO-15739 standard 80:1
ref_value = 1
resultsave = 1
roi = 977 998 3054 1189 3054 998 977 1189 140 88 477 381 477 88 140 381 26 1 2710 271 2710 1 26 271 30 124 839 213 839 124 30 213
satlvl = 1
saveCSV = 1
saveJSON = 1
saveXML = 0
save_answer = No
save_dir = C:ImatestDataClass_examplesColor_stepchart_examplesResults
save_file_list = 1 1 1 1 0 0 0 1 0 0
stepatch = 20
vglare = 0
whitebal = 1
xmin_string = Auto
xmin_value = 1

