This page shows how to measure the quality (including uniformity and defects) of flat screen displays using Imatest Blemish Detect, which comes in GUI-based versions (Master, Image Sensor) for laboratory use and in non-GUI-based versions (IT/EXE and IT/DLL) for manufacturing Testing. The method described here applies to any type of flat screen display— including smart phones, tablets, computer monitors, and large-screen TVs.
In both environments the Imatest Blemish Detect module can test for
- Stuck on and stuck off (“hot” or “dead”) pixels
- Visible bright or dark blemishes (mura)
- Luminance uniformity
- Color uniformity
All of these measurements can be performed on a single uniform image with the pixel level set near the middle of its brightness range. When Blemish Detect is tuned correctly, blemishes (light and dark pixels) that are visible to the human eye are flagged, but blemishes too small or too weak to see are ignored.
Additional measurements, including color and tonal response, can be added as needed. These measurements require patterns similar to standard test charts. We focus here on measurements made from a uniform flat field image.
Testing method
For this example, we photograph the screen of a 7-inch tablet in a darkened environment using a high quality camera/lens combination. The camera should have at least 12 megapixels (much more than the screen) and a fairly large sensor (for low noise). Micro Four-Thirds is the minimum recommended sensor size. The camera should be calibrated (i.e., the tonal response, gamma, and color response should be known) if the screen’s tonal and color response are to be measured.
We use the 16-megapixel Panasonic Lumix DMC-G3 with the Panasonic/Leica DG Macro-Elmarit 45mm f/2.8 lens, focused manually, and set around f/8. This lens has uniform sharpness and low vignetting (light falloff) at f/8 (see the photozone.de review), making it well-suited for LCD screen testing. Of course there are many similar products, some more suited for industrial environments.
Defective screen pixels (stuck high/stuck low)
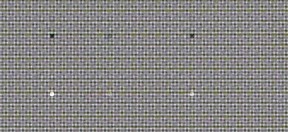 To illustrate the test methodology we use a flat middle gray pattern (around pixel level = 122; shown in the photograph below) that contains a group of high and low pixels near the center and corners of the image. The light and dark pixels are barely visible when the tablet is viewed from a normal distance; you have to look at the screen very carefully to see them. The defective screen pixels are easily visible in the enlarged crop on the right, which clearly shows the screen texture. An unintentional speck of dust is visible in the lower-right quadrant.
 Photograph of the 7-inch tablet image with barely-visible light and dark pixels
at the center & corners
Imatest Blemish Detect uses filtering comparable to the human eye to flag visible defects while passing defects that are too small or weak to be visible. This requires careful tuning, which is explained on https://www.imatest.com/docs/blemish. Blemish detect also performs all the functions of Uniformity, which are explained in https://www.imatest.com/docs/lightfall and https://www.imatest.com/docs/lightfall_master.
Setting up Blemish Detect
- Start Imatest and click Blemish detect.
- For a gray screen image surrounded by a dark field (recommended; shown above), enable automatic cropping by clicking and setting Blemish in the ROI (Region of Interest) section to Automatically select crop for image surrounded by a dark boundary. The largest rectangle that can fit in the screen area will be selected. (This feature is available in Imatest 3.10+.)
- Select the file to analyze (which should contain the entire screen image surrounded by black).
- If automatic cropping has not been enabled, crop the image for the active area of the screen.
- For the first few runs, click Yes (instead of Yes, Express mode) to set the Blemish Detect parameters, which are shown below. Once they’re satisfactory they don’t need to change.
We summarize some of the most important settings, which are described in detail in https://www.imatest.com/docs/blemish.
- Defective (hot and dead) pixels should be turned off. These are normally used for testing cameras, not screens.
- The Lowpass filter should be set to (mostly) remove noise and the screen pixel pattern.
- The Highpass filter should be set to minimize effects of long-range screen nonuniformity.
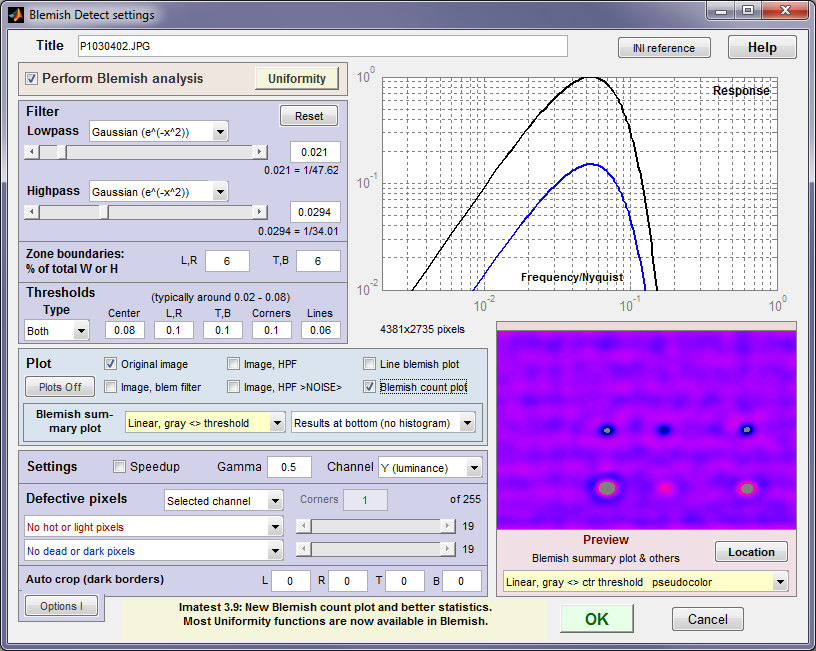
Blemish Detect settings window
- Type (displayed below Thresholds) should be set to Both so that both dark and light defects are detected. This setting was not available prior to 3.9: only dark thresholds were detected.
- Thresholds are also important: they should be based on what is and isn’t visible under realistic viewing conditions.
- The Preview window shows approximate results for a small portion of the image. (It calculates quickly.) There are many display options.
- the L, R, T, and B boxes, near the bottom to the right of Auto crop (dark borders) can be set to the number of extra pixels to crop inside the automatically detected image boundaries. This can be helpful if the screen is shaded near its edges.
| The key tuning parameters that need to be set properly so that visible blemishes are detected and blemishes below the threshold of visibility are ignored are Lowpass filter, Highpass filter, and Thresholds. |
Results
Several displays, including the original image, filtered image and results images are available. We show two results images.
- The Blemish count plot (below) shows the total blemish count and the sizes of each blemish. It can be zoomed.
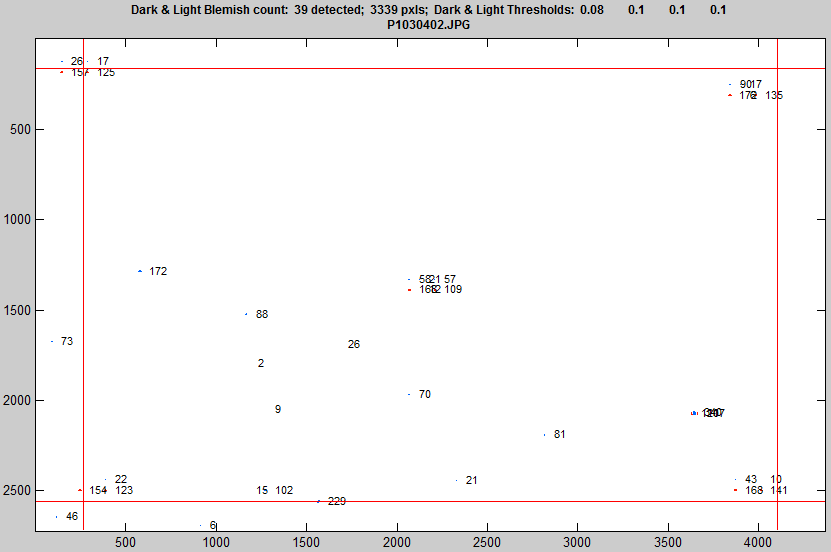
Blemish count plot: 20 blemishes detected (can be zoomed)
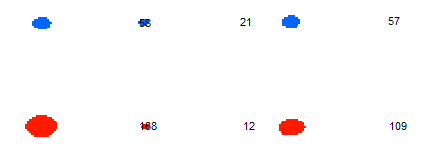
Zoom: center portion of Blemish count plot
- The main results plot— the blemish filtered image (in pseudocolor) with summary results, shown below zoomed to the defective pixels in the center (defect areas in gray; same as above). Summary results include
- The filter response
- The total number of pixels in each segment (center, top, bottom, …, corners)
- The area and location of each defect pixel.
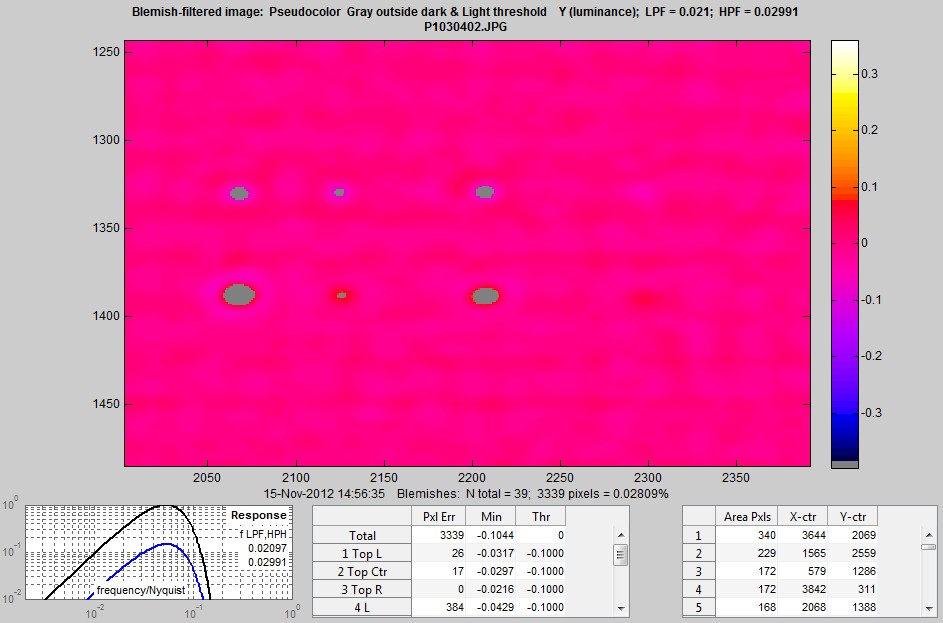 The main results plot, shown zoomed into the defective center pixels.
The filter response and defect statistics are shown on the bottom.
In addition, there are CSV, JSON, and XML output files. And very importantly, Pass/Fail criteria can be entered for testing. For example, you might set them to fail if there are more than 5 defects with more than 20 pixels (two sets of defect sizes and counts are available now).
Here is a sample of the JSON output. (JSON is a structure that is highly valuable for data interchange between programs: See http://www.json.org.)
“pixelErrors_dark”: [0,0,661,0,224,45,0,0,0],
“N_blemish_count_dark”: [8],
“blemishSizePxls_dark”: [573,133,72,47,47,28,19,11],
“blemishCenter_X_dark”: [4396.3,4396.2,3882.6,2074,2219.6,2134,2329.8,3927.4],
“blemishCenter_Y_dark”: [65.4,159.2,215.4,1328,1326.6,1328.8,2488.3,2449.1],
“pixelErrors_light”: [0,0,0,456,1314,0,0,0,0],
“N_blemish_count_light”: [12],
“blemishSizePxls_light”: [265,224,218,206,162,161,143,142,126,93,25,5],
“blemishCenter_X_light”: [3883.3,3927.2,2075.1,119.5,234.4,4024.9,2220.4,4068,373.2,258.7,3942.9,2135.2],
“blemishCenter_Y_light”: [274.7,2507.5,1387.9,181.1,2528.3,275,1387.9,2504.9,2529.4,178.1,274.6,1387.6],
Luminance uniformity
| Luminance uniformity can be measured when Uniformity functions are called from Blemish Detect. The f-stop pixel contour (normalized) shown on the right is a particularly useful display. [Note: 1 f-stop is a factor of two change in exposure; f-stops = log2(exposure).] The results are correctly calibrated if the camera’s encoding gamma—its average contrast— has been measured. This is done with a grayscale stepchart using Stepchart or Multicharts. (It needs to be done only once, before the tests.) |
The contour lines are well-filtered and are unaffected by the visible aliasing in the image on the right. (Matlab does not have good anti-aliasing when images are displayed reduced in size.) Some of the falloff is due to the lens.
Summary results shown below the image include f-stop levels at the sides (L R T B) and corners (UL LL UR LR).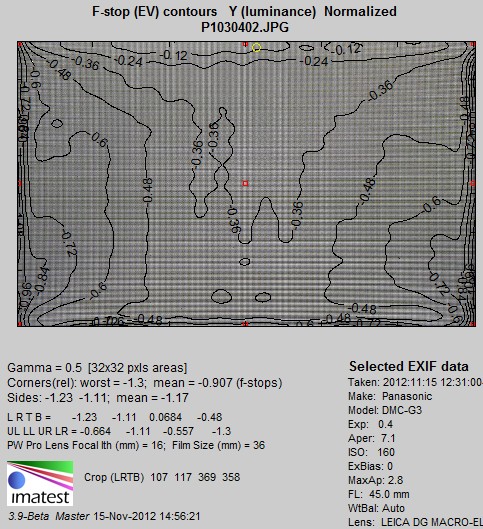
Color uniformity
Color uniformity can also be measured by the color shading Uniformity function called from Blemish Detect. Here is a result showing Delta-C 2000 (a very good metric for visible color difference that excludes luminance). Statistics are shown between the image (in exaggerated color with aliasing).
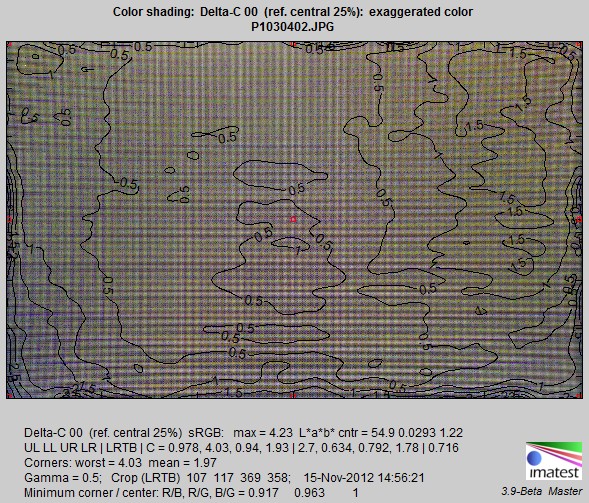 Delta-C Color difference plot. Color nonuniformity is quite small.
The highly visible aliasing pattern is an artifact of the display software.
Summary
The Imatest Blemish Detect module, which was developed to detect visible defects in image sensors, is also a powerful tool for detecting defects in flat LCD screens (or any other display technology). Tests include
- Stuck light and stuck dark regions, which may be individual pixels or clusters of pixels— tuned to what is actually visible
- Luminance uniformity
- Color uniformity
Blemish Detect works both in development and production line environments. Screen selection is completely automated; tests can be performed with no manual intervention. Pass/Fail criteria for manufacturing testing can be set for any of the key measurements (or can be added as required). Details can be found in Implementing Pass/Fail in Imatest IT.
Imatest can perform a great many other tests such as color and tonal response that may be of interest in testing flat screens.

