
- This event has passed.
Electronic Imaging 2026 (EI2026)

Where Industry and Academia Meet to Advance Imaging
Join us in person for EI 2026 at the Hyatt Regency San Francisco Airport in Burlingame, California!
EI 2026 offers:
- Exciting Symposium Plenaries and Conference Keynotes.
- A rich technical program of oral talks, interactive poster papers, a demonstration session, and multiple opportunities to network.
- An industry exhibit and conference lunches.
- A robust short course program.
- A dynamic environment to interact with colleagues from industry and academia across the globe.
Electronic Imaging 2026 brings together multiple technical conferences covering all aspects of imaging.
Learn More RegistrationExhibition
The Exhibition will be held on Tuesday March 3rd 10AM-7PM, and Wednesday March 4th 10AM-3:30PM. Stop by our booth to chat with our imaging scientists.
Imatest is presenting:
- March 1: Short Course: Information Metrics for Machine Vision
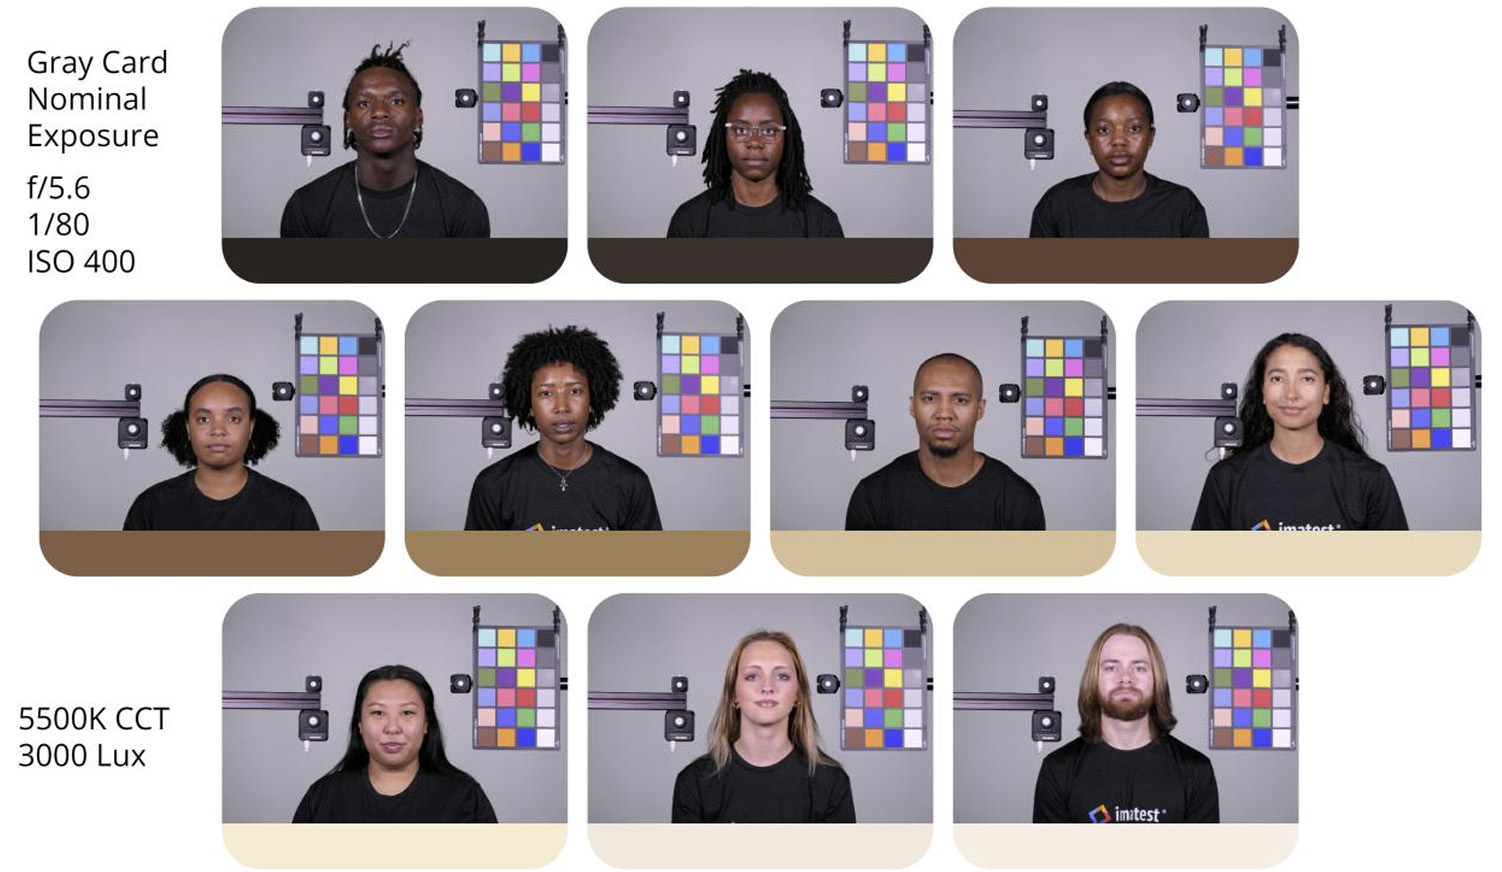
- March 3 11:00: Paper: Toward Fair and Accurate Camera Testing: Validation of Skin Tone Test Charts with Real Human Data
- March 3, 3:30: Paper: Image Sensor Noise model for Image System Simulation
- March 3, 3:30: Panel session: road markings and signage for autonomous vehicles.
- March 4, 9:30: Paper: Centroid to Low-Pass Edge Fitting in ISO 12233 eSFR: Accuracy and Impact on Digital Imaging Information Metrics
- March 4, 3:30: Paper: Information-based Dynamic Range
- March 4, 4:30: Paper: A method for calculating NIR bandpass-adjusted Optical Densities for better matching common standard test chart specifications.
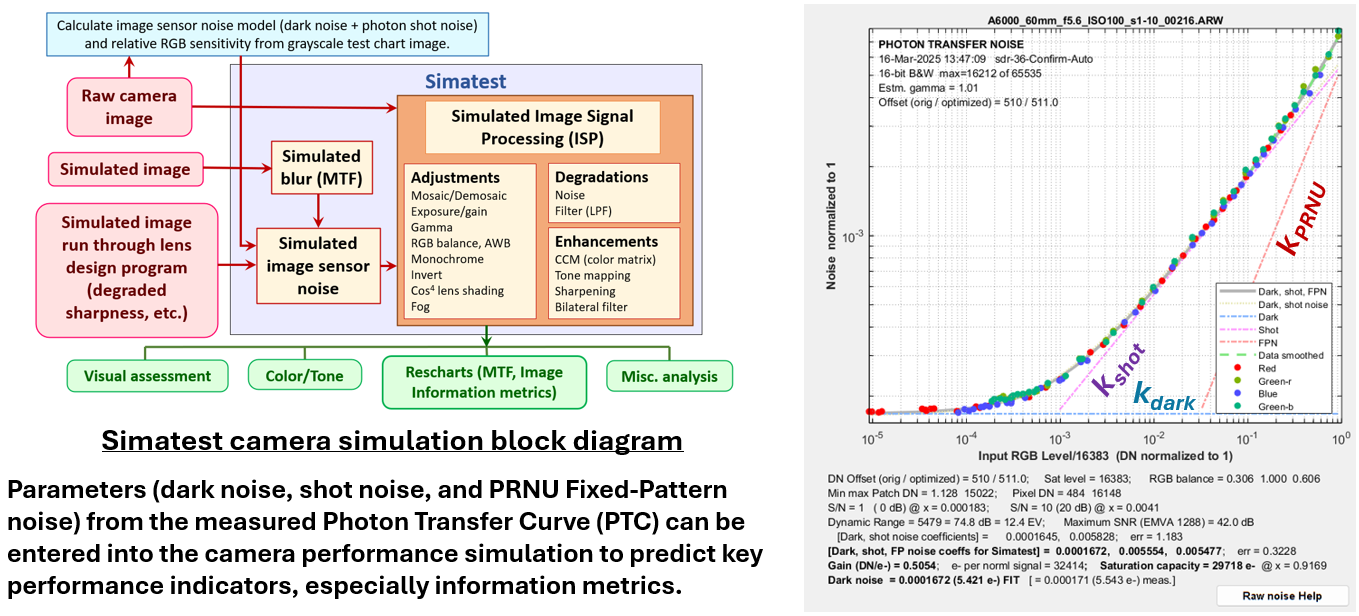 Short Course: Camera Simulation for Predicting Information Metrics and Machine Vision Performance
Instructor: Norman L. Koren
When: Sunday, March 1st 2:00 PM – 5:00 PM PST
Benefits:
- Understand the fundamentals of information capacity and how it relates to conventional SFR and noise measurements,
- understand the information metrics (information capacity and others derived from information theory), and have a feeling of how it relates to system performance
- learn about the latest work being done to correlate the information metrics with system performance
- Learn the fundamentals of system simulation, including preparing the image (typically a test chart), determining the lens degradations and image sensor noise model
- Know how to determine the effects of each system component or image processing step on the system performance.
Screenshot
“Toward Fair and Accurate Camera Testing: Validation of Skin Tone Test Charts with Real Human Data”
Megan Borek, Amelia Limbocker, Ellis Monk
Session: IQSP Skin Tone Capture and Image Quality I
Date: March 3rd
Time: 11:00 AM
Duration: 20 minutes
Accurate reproduction of diverse skin tones remains a persistent challenge for consumer cameras, with shortcomings in automatic exposure and white balance often leading to biased results. To address this, we are developing skin tone test charts designed to better represent real human skin across the full range of the Monk Skin Tone Scale. This work validates these charts using real human data collected through multiple methods. First, survey responses capture user perspectives on how their skin tones are represented in smartphone images and what they expect from their devices. Second, controlled photographic sessions with participants across the scale provide image data under varied lighting conditions and multiple exposure strategies, including gray card, spot metering, and bracketing, alongside participant-selected preferred
measurements from skin regions supplement the imaging data with objective ground truth. Together, these datasets allow us to evaluate and tune test chart behavior so that color and exposure responses align more closely with real skin. This validation represents a step toward fairer, more accurate camera testing standards, with implication for consumer photography as well as applications in medical, automotive, and security images.
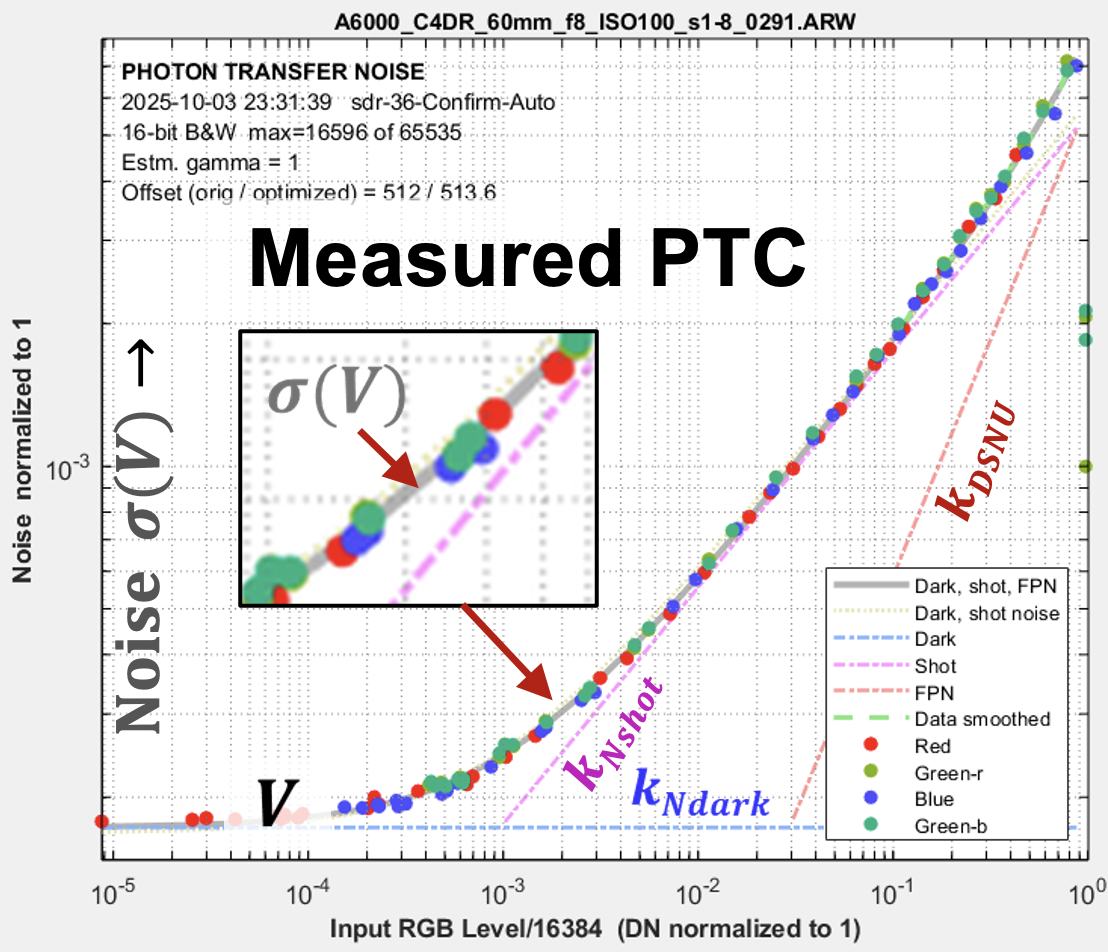
“Image Sensor Noise model for Image System Simulation”
Norman L. Koren
Session: IQSP
Date: March 3rd
Time: 3:30 PM
Duration: 20 minutes
We present an image sensor noise model, which is part of a complete image system simulation that includes image generation, lens degradations, and ISP (Image Signal Processing), and can produce classic measurements (SFR, noise, etc.) as well as the new information metrics (information capacity, SNRi, etc.).
The noise model is derived from a classic Photon Transfer Curve (PTC) obtained from one or at most two raw (undemosaiced) images of a high dynamic range grayscale test chart. Image sensor noise is composed of three factors.
Panel session: road markings and signage for autonomous vehicles.
Paul Romanczyk PhD
Session: AVM
Date: March 3rd
Time: 3:30 PM
Discussion relating to colors and spectral properties of various road elements, such as pavement markings and traffic signs, and how their properties influence the detectability by machine vision systems.
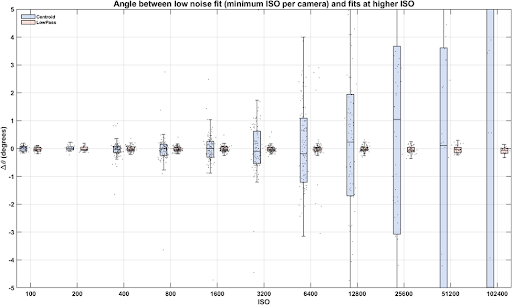 “From Centroid to Low-Pass Edge Fitting in ISO 12233 eSFR: Accuracy and Impact on Digital Imaging Information Metrics”
Sarah Kerr
Session: IQSP
Date: March 4
Time: 9:30 AM
Duration: 20 minutes
Edge localization estimation methods play a critical role in ISO 12233 eSFR analysis, influencing both sharpness results and downstream information capacity metrics. This paper evaluates the accuracy of the standard centroid method relative to a low-pass filter approach across cameras and ISO ranges. Localization errors are benchmarked against low-noise ground truth, and their propagation to eSFR results, information capacity, and SNRi metrics is quantified. Findings show that centroid fitting introduces angular bias under noise, leading to blurrier effective responses, while low-pass filtering maintains robust accuracy. These results highlight an underexplored source of error in standards-based image quality analysis and provide a foundation for improved methods. The approach will be extended toward matched filtering, enabling a closer alignment between edge analysis, information-theoretic models, and emerging metrics such as those in ISO 23654 (Digital Imaging — Information Metrics).
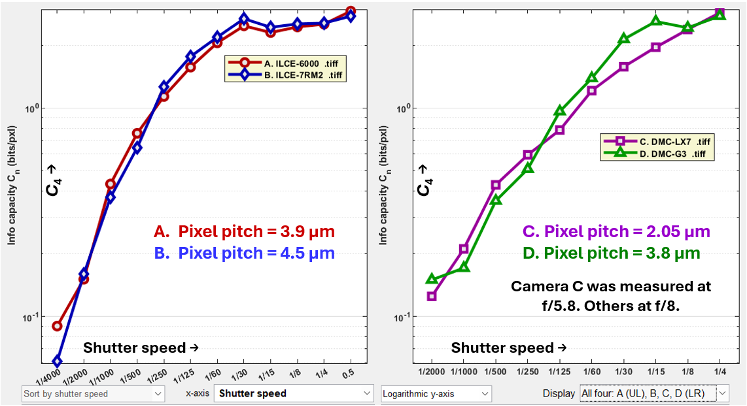 “Information-based Dynamic Range”
Norman L. Koren
Session: AVM
Date: March 4th
Time: 3:30
Duration: 20 minutes
We present a new approach to measuring camera dynamic range and low-light performance based on C4 information capacity, which is measured directly from ISO 12233-standard 4:1 contrast slanted edges. Our initial technique involves photographing a test chart that contains 4:1 slanted edges over an extremely wide range of exposures, from ½ or ¼ second (where the brighter side of the edge saturates) to 1/2000 or 1/4000 second, where the image appears nearly black, but a noisy edge is still present. The major advantages of this method are
- Dynamic range limits are based on an actual performance metric (C4) rather than SNR, which is only one of the factors that contributes to camera performance.
- C4 correctly handles performance degradation due to stray light.
We will discuss new techniques, still under development, for facilitating the measurement.
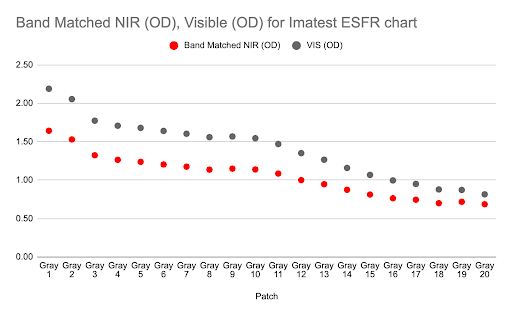 “A method for calculating NIR bandpass-adjusted Optical Densities for better matching common standard test chart specifications.”
Christian Taylor, Amelia Limbocker
Session: AVM
Date: March 4th
Time: 4:30 PM
Duration: 20 minutes
Near-infrared (NIR) imaging is now prevalent in machine vision, automotive, and biomedical applications, but most step-chart definitions were created for visible imaging. Many standards assume visible lighting conditions and only consider IR-blocking, so NIR-sensitive and RGB+NIR cameras are not adequately addressed. This leads to charts whose nominal densities don’t produce results as intended.
