Customers frequently want to know how we measure the optical center of the image (not to be confused with the geometrical center). They may be surprised that we measure three, shown below in the 2D contour map, which is one of the options in Rescharts slanted-edge modules 3D & contour plots.
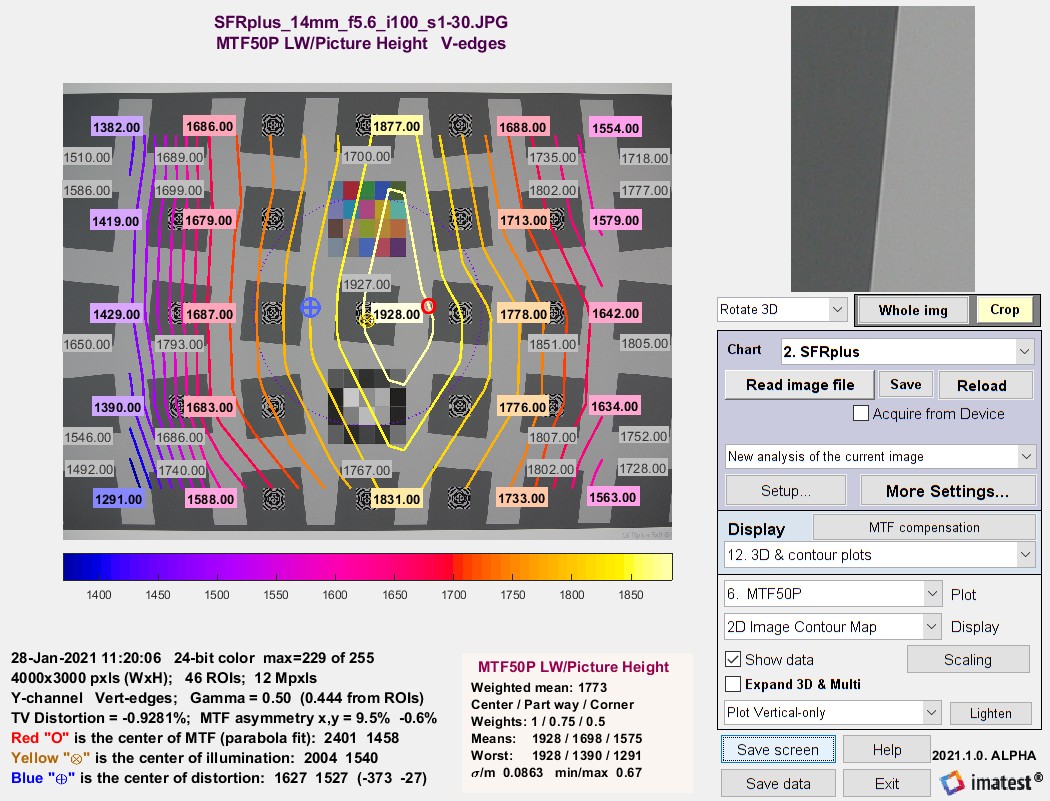 SFRplus contour plot for MTF50P, showing three optical centers:
For a normal well-constructed lens, the optical centers are all close to the geometric center of the image. They can diverge for defective or poorly-constructed lenses.
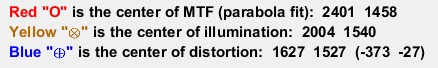
Center of MTF (Center of Sharpness)
The center of MTF (or Sharpness) is the approximate location of maximum MTF, based on a second-order fit to results for slanted-edge charts (SFRplus, eSFR ISO, Checkerboard, and SFRreg). It is displayed (along with the two other optical centers) displayed in the 2D image contour map, which is one of the options in 3D & Contour plots.
Algorithm: Starting with an array of all MTF50 values and arrays for the x and y-locations of each value (the center of the regions), fit the MTF50 value to a second-order curve (a parabola). For the x (horizontal) direction,
MTF = axx2 + bxx + cx .
The peak location for this parabola, i.e., the
x-Center of MTF = xpeak = –bx /(2ax) .
It is reported if it’s inside the image. (It is not uncommon for it to be outside the image for tilted or defective lenses.) The y-center is calculated in exactly the same way.
MTF asymmetry is calculated from the same data and parabola fits as the Center of MTF. For the x- direction,
MTF50 (x-aysmmetry) = (MTFfit(R) − MTFfit(L)) / (MTFfit(R) + MTFfit(L))
where MTFfit(R) and MTFfit(L) are the parabola fits to MTF at the left and right borders of the image, respectively. MTF50 (y-asymmetry) is calculated with the same method.
Center of illumination
The center of illumination is the brightest location in the image. It is usually not distinct, since brightness typically falls off very slowly from the peak location. It only represents the lens for very even back-illumination (we recommend one of our uniform light sources or an integrating sphere). For front illumination (reflective charts) it represents the complete system, including the lighting.
It is calculated very differently in Uniformity and Uniformity Interactive than it is in the slanted-edge modules.
Algorithm for Uniformity and Uniformity Interactive: The location of the peak pixel (even if it’s smoothed) is not used because the result would be overly sensitive to noise. Find all points where the luminance channel g(x,y) (typically 0.2125*R + 0.7154*G + 0.0721*B) is above 95% of the maximum value. The x-center of illumination is the centroid of these values. The y-center is similar. This calculation is much more stable and robust than using peak values.
Cx = ∫x g(x)dx / ∫g(x)dx
Algorithm for Rescharts slanted-edge modules: Starting with Imatest 2020.2, the mean ROI level of each region is calculated and can be plotted in 3D & contour plots.
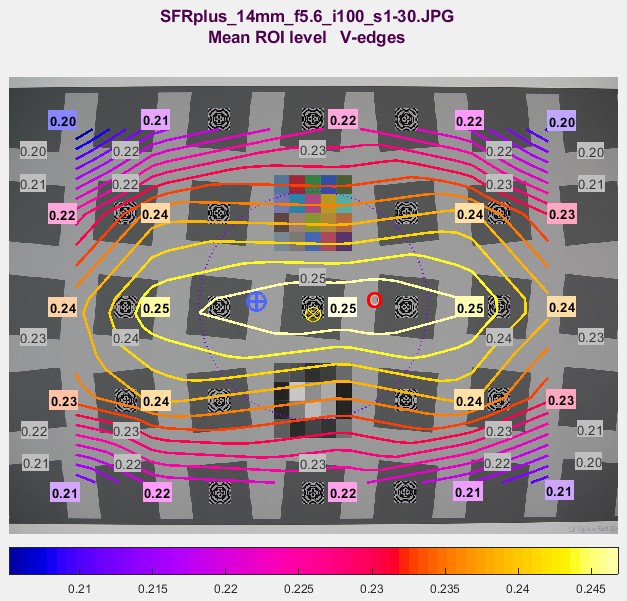 SFRplus contour plot for mean ROI levels, used to calculate
Center of Illumination (⊗)
The calculation is identical to the Center of MTF calculation (above), except that mean ROI level is used instead of MTF50.
Center of distortion
The center of distortion is the point around which Imatest distortion models assume that distortion is radially symmetric. It is calculated in Checkerboard, SFRplus, and Distortion (the older legacy module) when a checkbox for calculating it is checked. It is calculated using nonlinear optimization. If it’s not checked (or the center is not calculated), the geometrical center of the image is assumed to be the center of distortion.
Distortion measurements are described in Distortion: Methods and Modules.
Link
What is the center of the image? by R.G. Wilson and S. A. Shafer. Fifteen, count ’em fifteen optical centers. Do I hear a bid for sixteen? Going… going…