Analyses & Output – INI settings – Chart Definition Files – Chart Definition Utility – Video Analysis
The Chart Definition Utility is a self-contained GUI window in Imatest Master which can aid in the creation and verification of a chart definition JSON to be used by the Arbitrary Charts module. The primary services this utility provides are:
- Indicating errors in the construction of the chart definition JSON, both semantic (e.g., invalid value types) and syntactic (e.g., a missing comma)
- Displaying an illustration of the chart design based on the supplied definition, for quick visual verification
- Alignment of the chart design with an actual photograph of the chart, to illustrate the ROI (Regions Of Interest) that are generated by the chart design in that image
This utility can aid users as they go through the process of designing a chart, for example by illustrating how the ROI generated in an image of the chart may overlap with other chart features if they are too close.
It can also aid in the process of creating a chart definition file, which is different step of the process, by verifying that a JSON file is of a correct, parseable structure and with appropriate values for each field. By providing feedback on the nature of errors in a JSON definition file, the utility can help a user iterate and correct technical problems with their definitions.
Opening the Chart Definition Utility 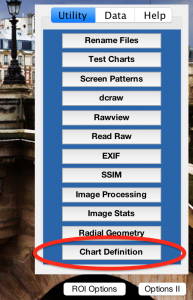
The Chart Definition Utility is available in Imatest Master 5.0 and newer. It can be accessed directly from the main Imatest window via the “Chart Definition Util” button in the Utility Panel or the same entry of the menu bar “Utility” dropdown.
The Utility can also be opened from the Arbitrary Charts module window, with the button in the “Chart Definition” pane. If a chart definition file has already been selected in this pane it will be pre-loaded in the Utility window upon opening (whether it was successfully read by Arbitrary Charts or not).
Chart Definition Verification
The top pane of the Utility window is used for verifying the validity of a chart-definition JSON file.
Valid chart design illustration
If a selected file is a valid chart-definition, a rendering of the chart design will be displayed to the user. This can be used for quick visual inspection of correctness.
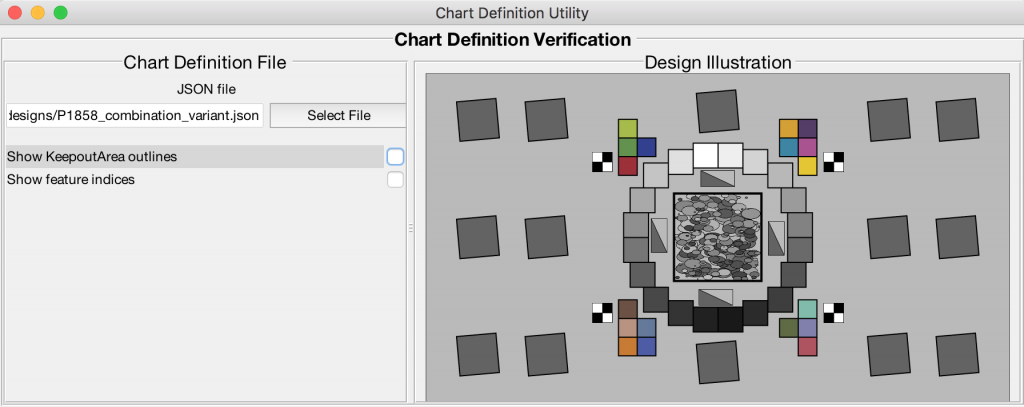
It is important to note that this is an illustration of the chart based on the supplied definition. It may not exactly match every feature on the actual printed test chart which this definition file is used to analyze, it will only draw conceptual illustrations of the ones that it is aware of through the definition file.
Display options
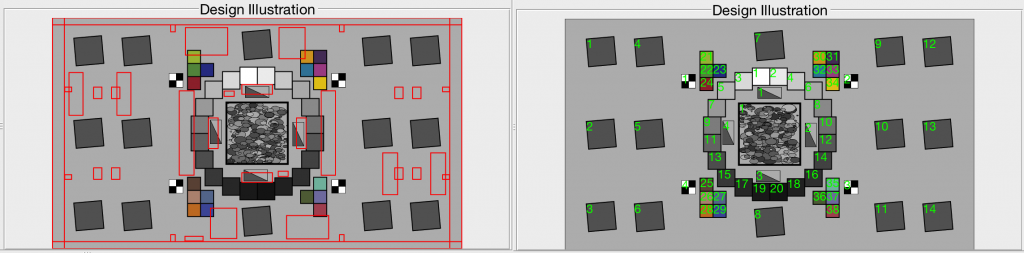
(Left) Rendering with KeepoutAreas highlighted. (Right) Rendering with chart feature indices displayed.
- The user has the option to toggle the display of KeepoutAreas as red outlines on the rendered drawing. These features (used to identify areas where there is something on the chart which cannot be analyzed by Imatest, used only for Uniformity analysis from the chart background area) sometimes clutter the drawing, hence the option to turn off their display.
- Feature indices can be displayed over the rendering of each feature, allowing for easily reference to relate a drawn feature with the corresponding chart definition file entry. The number displayed over each feature is the ‘ind’ field value of the feature’s entry into the feature array. Note that these count up from 1 for each feature type.
Invalid chart design messages
If the selected file is not a valid chart definition file, it could be for two reasons:the parameters and values entered to not meet the rules laid out on the chart definition page, or the file is not even a valid, parseable JSON structure.
Imatest displays a message, in red, describing the problem encountered which is hopefully meaningful enough to the user that they can track down and correct the problem in their chart definition file. If there are multiple problems, only the first one encountered is reported until it is fixed.
Chart Definition problems
Chart definition files which are correctly written JSONs but do not abide by the rules of arbitrary chart definitions will produce messages to guide the user in correcting the mistakes. For example, if a file is missing the required “name” field, this message will show:
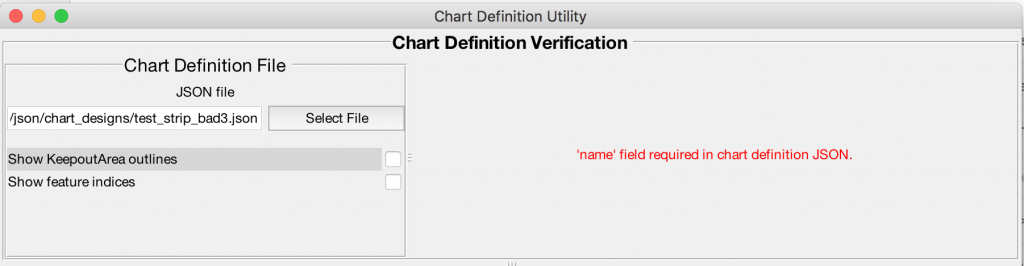
Sources of chart definition errors include missing required fields and incorrect value types for fields, e.g., a string entry in a field that requires a numeric value.
Parsing problems
There are many possible sources of error that could make a JSON not parseable. For example, one could be missing a comma, a closing bracket the demarcate the end of an array, or a colon. There could also be invalid characters, such as single quotes used for strings instead of double quotes. (There are a number of other possible errors.)
Unfortunately, Imatest cannot be as helpful when displaying messages about parsing errors, because there are so many different types. Some issues such as a missing comma or missing array close bracket can be indicated meaningfully.
However, sometimes the message will simply indicate “Value expected at position X”, and a snippet of the context of the missing value will be displayed. It is on the user to track down their JSON structure errors using these messages. Online tools such as JSON Lint may be slightly more informative in such cases.
Sample Region Detection
The lower pane of the Chart Definition Utility window allows for viewing the alignment of the features defined in a chart definition file with an actual image of the chart.
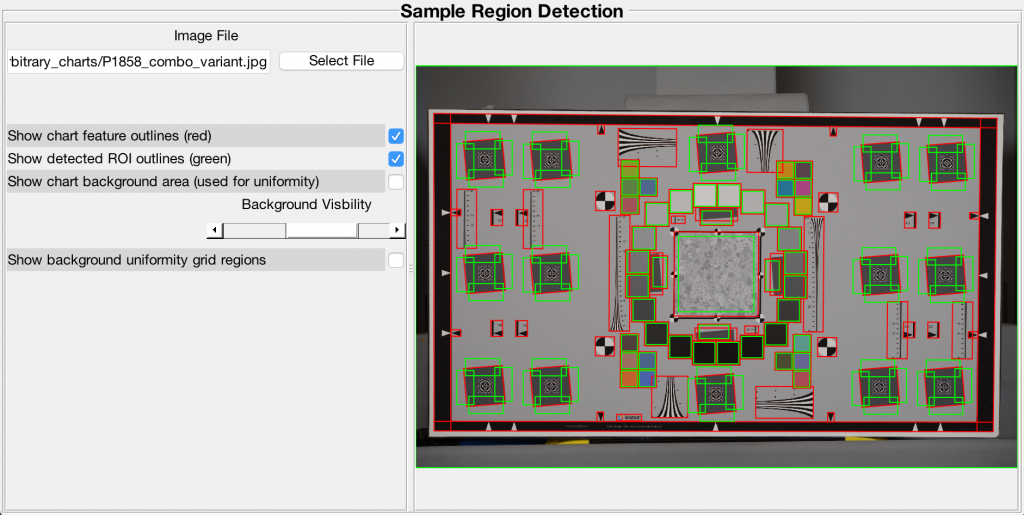
This panel is also very useful for testing whether a particular image will pass Imatest’s automatic registration functions rather than running the image through an analysis module directly. If automatic detection fails, a warning window will pop up.
When both an image file is selected in this pane and a valid chart definition file loaded in the top pane, the chart will be automatically aligned in the image (if possible).
The user can select a number of graphical guides which can verify the ROI detected in the image using the supplied definition file.
- Chart feature outlines, highlighted in red
- Analyzable ROI outlines (derived from the features), highlighted in green
- Uniformity-from-chart-background grid
- Pixel locations of the chart background (as used for uniformity grid analysis), emphasized in blue
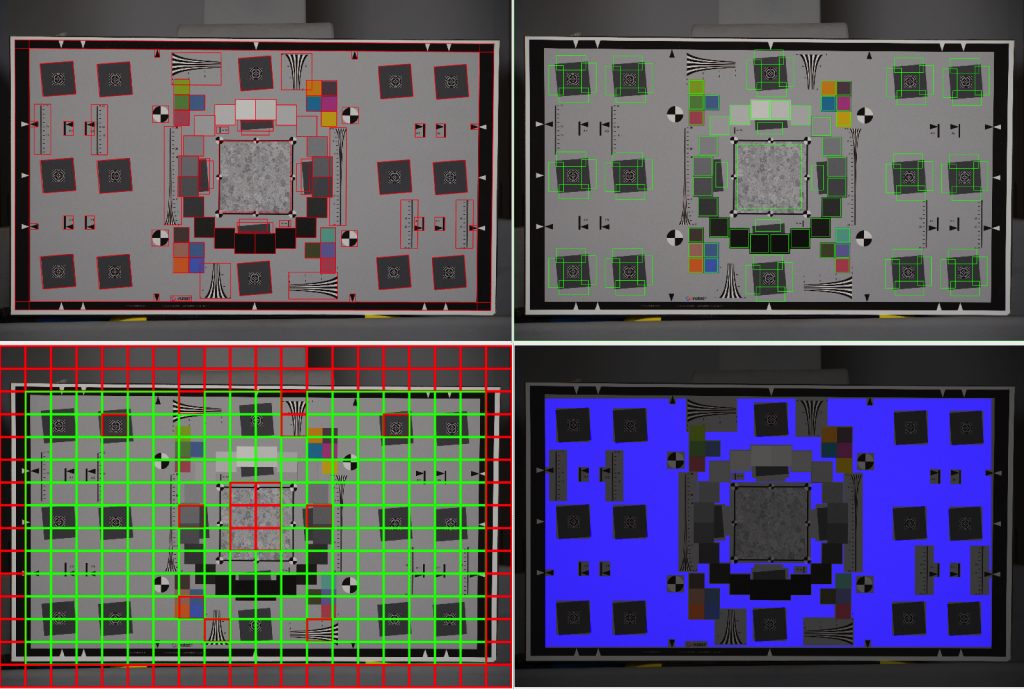
(Top Left) Chart features highlighted. (Top Right) Analysis ROI highlighted. (Lower Left) Uniformity Grid sections. (Lower Right) Chart Background area highlighted.
The ROI indicated by the green-boxed regions indicate the areas that will be used by the analysis routines of the Arbitrary Charts module. One can, for example, change the fill-factor INI-field settings for different feature types (e.g., [arbcharts] roiFillFactor_edge) and see how it will affect the ROI generated from a given image.
The pixels marked with blue to indicate the chart background area are the pixels which are within the chart boundaries but not within the area of a chart feature or a KeepoutArea. The amount of margin that a pixel needs to be from one of these regions (boundary, feature, or keepout) is determined by the INI field [arbcharts] backgroundMargin.
The uniformity grid locations are highlighted either green (if there are enough valid chart-backround pixels to make a measurement in that region) or red (if there are not enough). The red areas will return NaN values in the output results. The number of grid sections is controlled by [arbcharts] nRowsGrid and nColumnsGrid, and the number of valid pixels necessary in a region is controlled by [arbcharts] minValidPxGrid.
Feature outlines vs ROI outlines
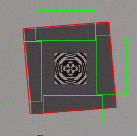 This utility also illustrates the difference between a chart feature and the ROI generated from that feature. For example, a SlantedSquareFeature detected in a real image is quite different from the four slanted-edge ROI that are generated from it.
