Starting in 23.1, a distortion model can be used to map the ROIs from a chart definition file to the correct location for highly geometrically distorted images. The distortion model can be measured for an imaging system by taking a picture under the same imaging conditions of a checkerboard chart, SFRplus chart, or eSFR ISO chart and performing a geometric analysis. Example images and a chart definition file can be downloaded from the Imatest Charts repository on GitHub.
Example
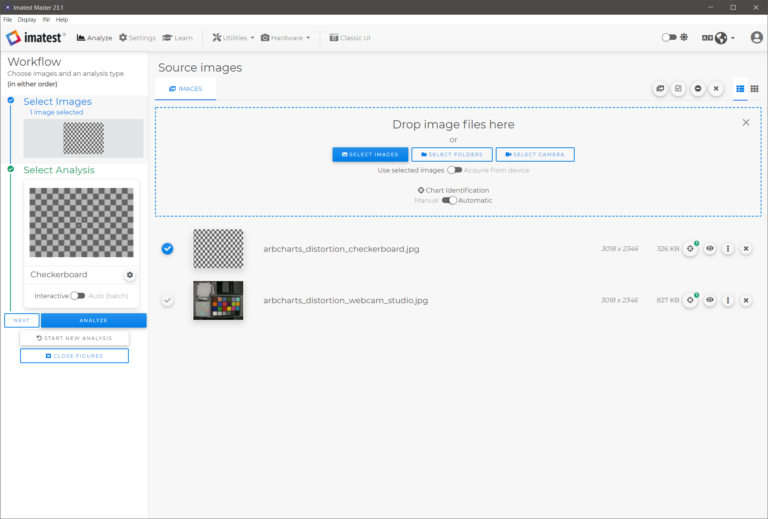
1. Load an image of your arbitrary chart and an image of a checkerboard captured under the same imaging conditions into Imatest Master. Analyze the checkerboard image with Checkerboard Interactive analysis.
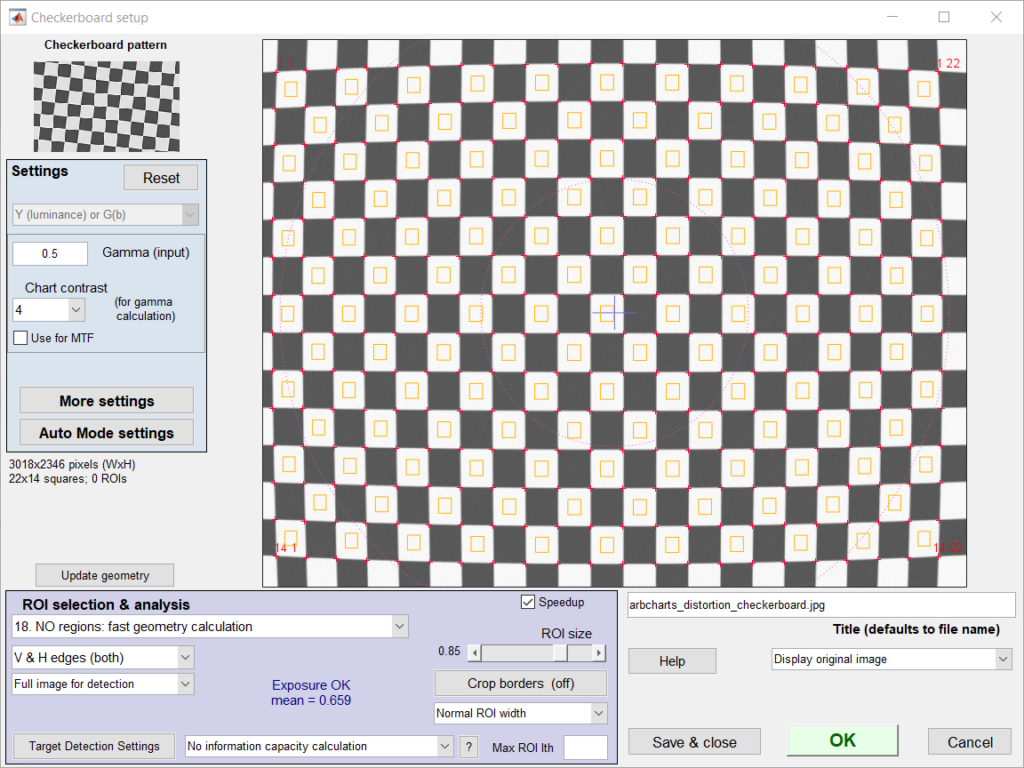
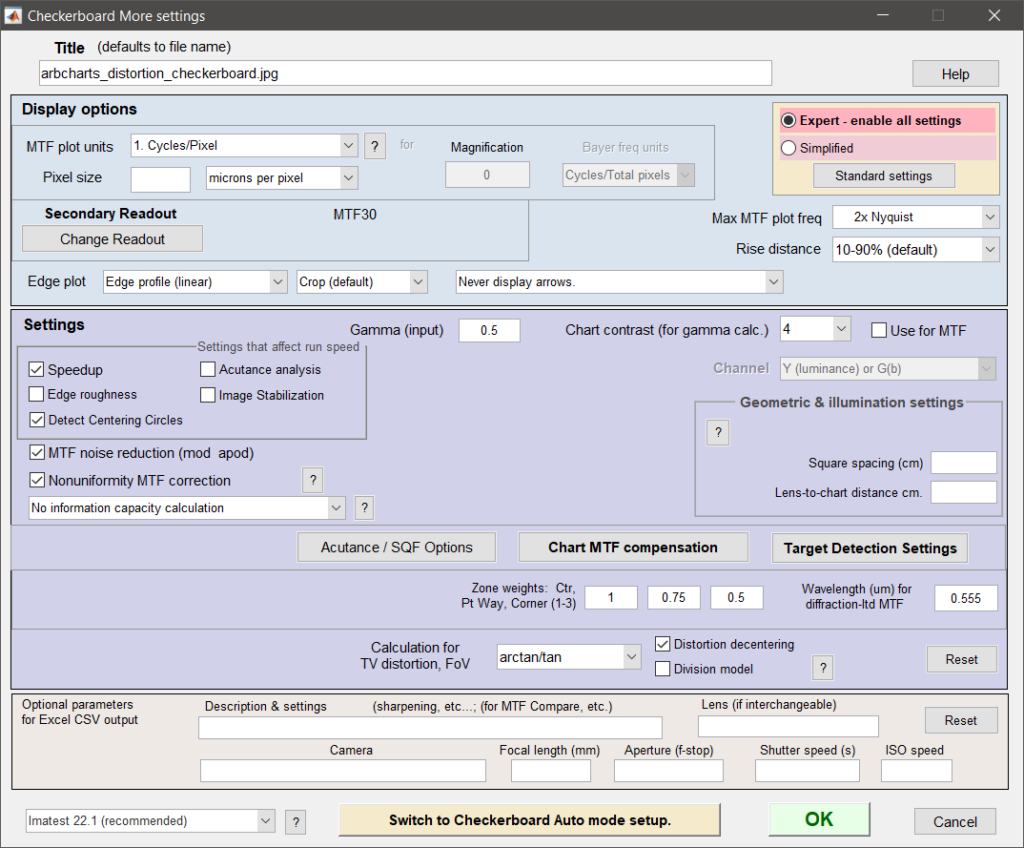
2. On the setup window (below left), ROI selection 18. NO regions: fast geometry calculation is recommended for distortion characterization. From the setup window, click the More Settings button to open the more settings window (below, right). From here, the distortion model can be selected. 5th order (3,4) or the arctan/tan models are often sufficient. It is also recommended to check the Distortion decentering box for a more accurate fit.
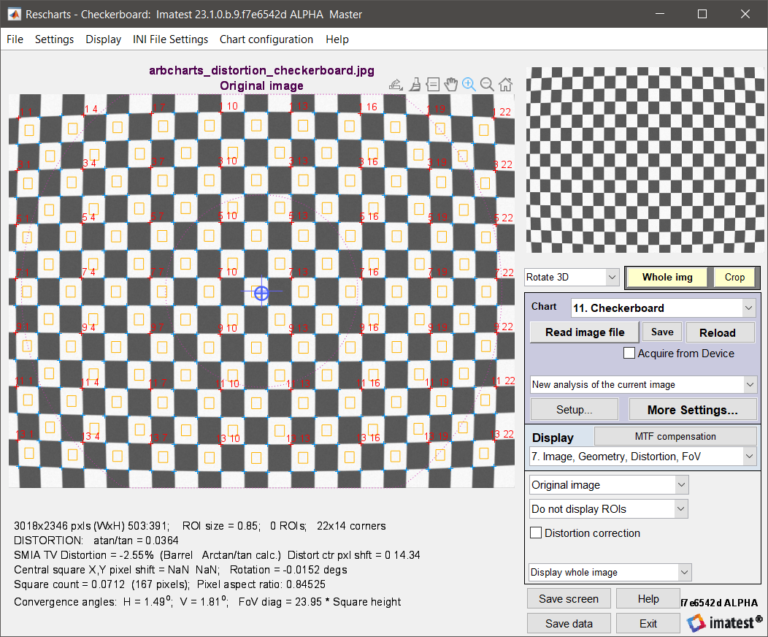
3. Proceed to the interactive results window and choose display 7. Image, Geometry, Distortion, FoV. The calculated distortion parameters are displayed at the bottom of the image. Here, we have a distortion decentering of (0, 14.34) and an arctan/tan parameter of 0.0364.
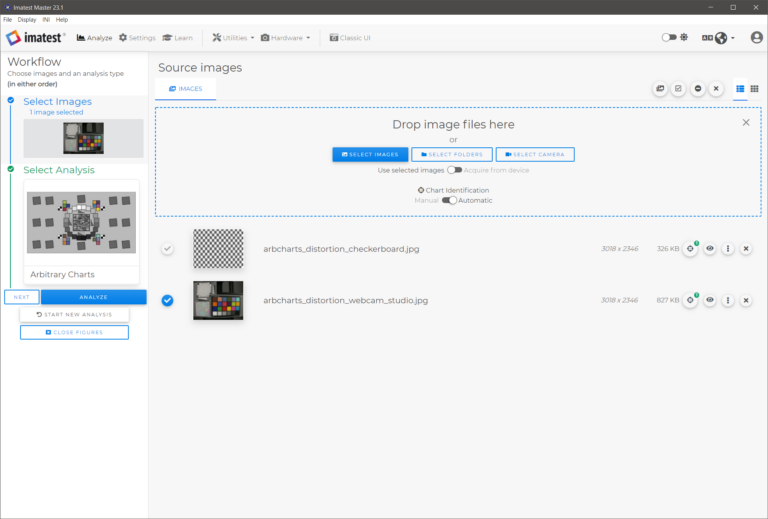
4. Now return to the Imatest Master main window and select the arbitrary chart image. Analyze that image with Arbitrary Chart analysis.
5. On the arbitrary charts analysis window, load in the chart definition file. It is next recommended to use the Chart Definition Utility to apply and visualize the distortion correction.
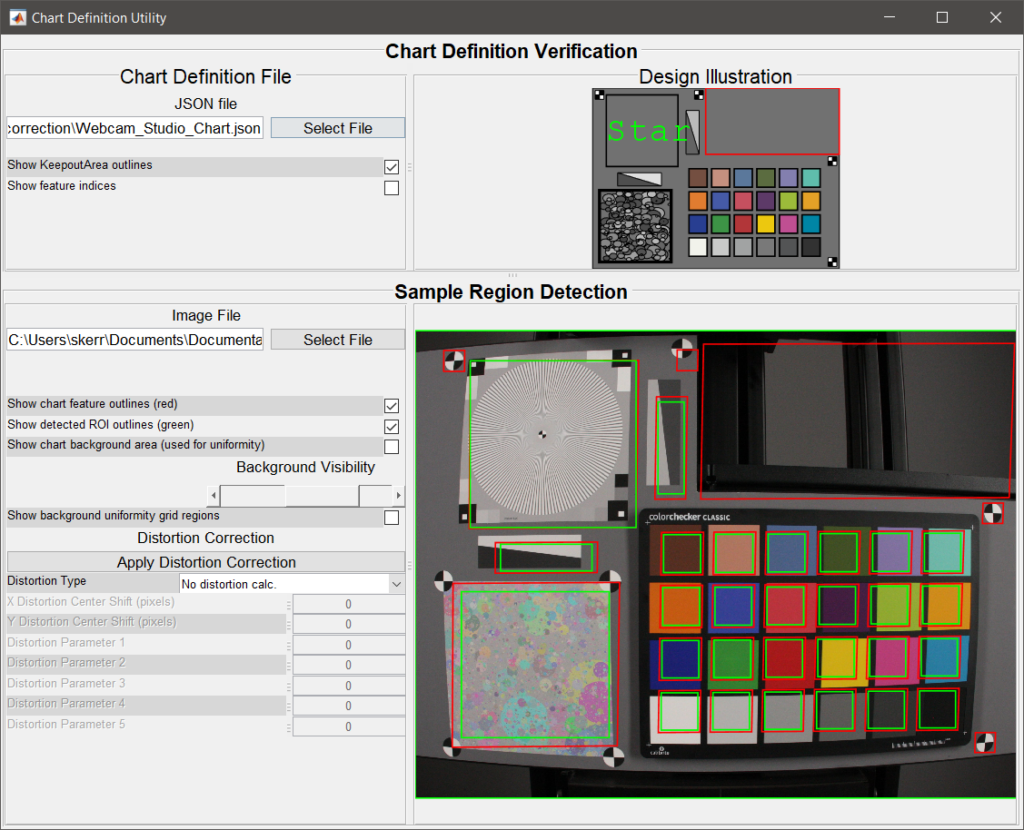
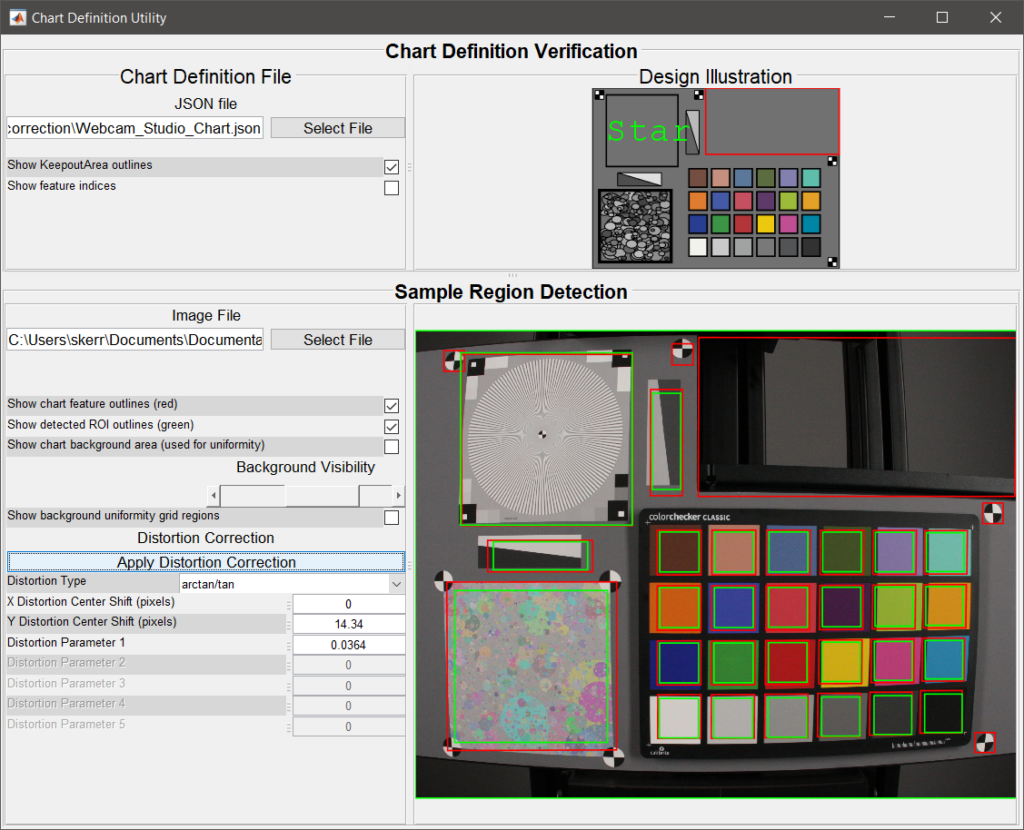
6. In the chart definition utility, it is easy to see that the chart definition ROIs are not well aligned with the chart image due to the geometric distortion (below, left). To fix this, choose the distortion model and enter the distortion parameters measured with the checkerboard image. After entering that information, click the Apply Distortion Correction button to view the corrected alignment (below, right). Upon clicking the Apply Distortion Correction button, the distortion model and distortion parameters will be saved to the INI file.
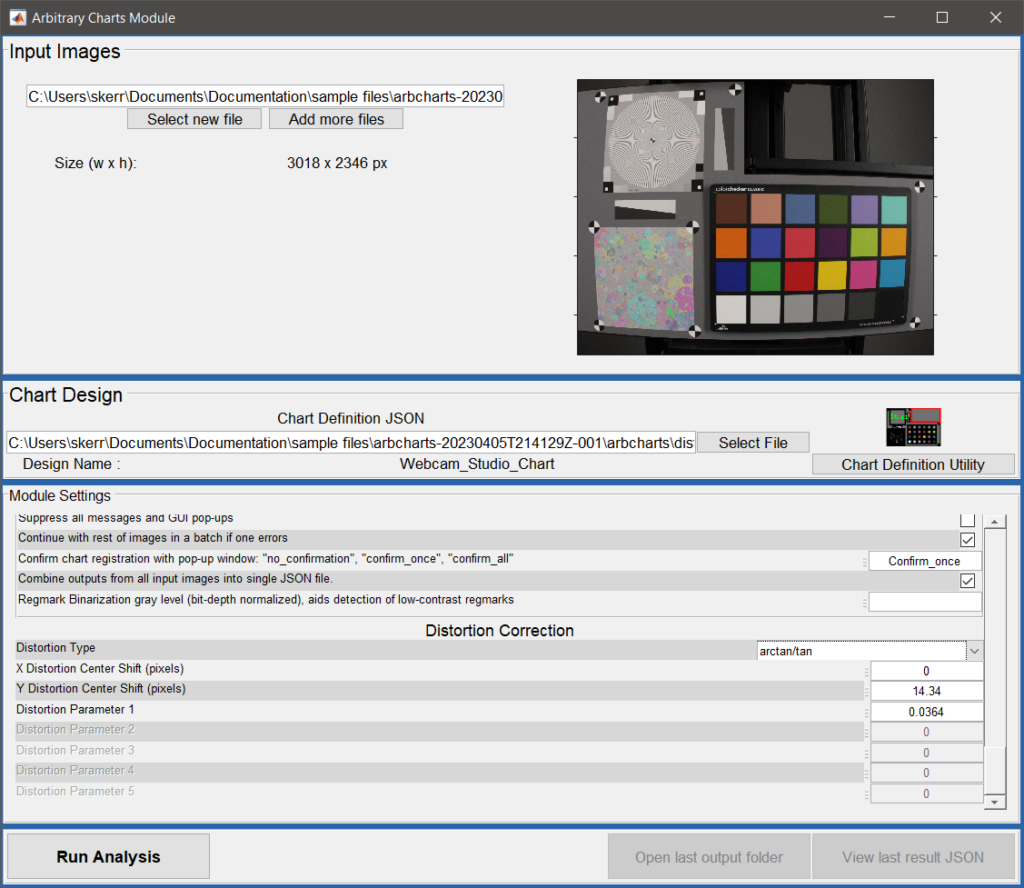
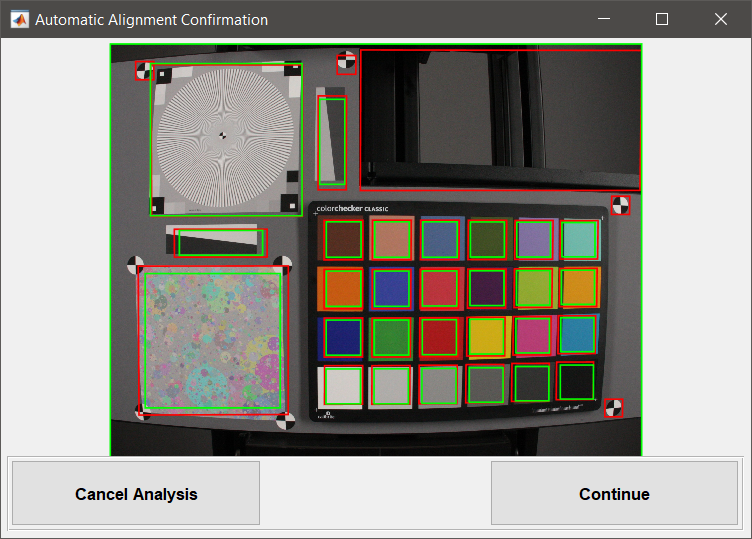
7. Now return to the arbitrary charts analysis window and navigate to the Distortion Correction section. Here, choose the correct distortion model and the associated parameters will be loaded in from the INI file. Choose Run Analysis. The Automatic Alignment Confirmation window (below, right) will provide an opportunity to confirm the ROI alignment before proceeding with the analysis.