Introduction
The Imatest Image Stabilization/Sharpness Compare module is a postprocessor for SFRplus that
- Measures the effectiveness of Optical Image Stabilization (abbreviated as IS or OIS) by comparing the sharpness (MTF or related lengths) of selected near-horizontal and near-vertical edges from three similar SFRplus images:
- Unshaken.
- Shaken without Image Stabilization. (Some recent cameras lack the ability to turn IS off. There are several approaches to measuring IS effectiveness in this case. One is to have a very precise vibratory apparatus with known vibration angles. Expen$ive. Another is to substitute a camera with similar pixel configuration and lens focal length, but no OIS.)
- Shaken with image stabilization.
 Standard SFRplus chart |
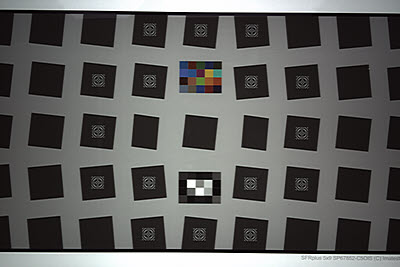 Special SFRplus chart with extra space around center square for extreme shake |
The acquisition and selection of images for measuring image stabilization will be discussed briefly below. Summary: One image should be sufficient for the unshaken case, but the worst (least sharp) of ten or more images is required for the shaken images (without and with image stabilization).
- Compares the sharpness of two images. Image Stabilization/Sharpness Compare is, in a sense, a generalization of MTF Compare, which compares the sharpness of two individual Regions of Interest (ROIs; from different images or from the same image). Image Stabilization/Sharpness Compare can create a comparison map of the entire image.
The input to Image Stabilization/Sharpness Compare is a set of two or three JSON files created by SFRplus.
| Postprocessor comparison Each lets you compare sharpness of different regions and/or images |
|
| Postprocessor to SFR, SFRplus, and eSFR ISO. Input is two CSV results files for individual regions. Lets you compare individual edges from any region of any two images (or the same image). Displays MTF for both images and transfer function (A/B) or (B/A). | |
Image Stabilization/ Sharpness Compare |
Postprocessor to SFRplus-only. Input is two or three JSON results files. Image Stabilization must be checked in the SFRplus settings window. The region selection must be the same for all the files, but files may have different sizes. Lets you compare sharpness of regions (in approximately the same location) or of the image as a while. Can compare sharpness of two image files or calculate the effectiveness of (Optical) Image Stabilization using three image files. |
| Postprocessor to SFR, SFRplus, and eSFR ISO (primarily SFRplus) that lets you compare summary results for several files run as a batch and stored in a file whose name has the form root file_sfrbatch.csv. Most useful for measuring sharpness at the center, part-way, corners, and weighted mean for a range of apertures, but very versatile: it can analyze any image sequence. | |
For the sake of brevity we’ll call the module Image Stabilization for the remainder of this page.
Operation
- Acquire the images. Lighting should be even and glare-free (see lighting recommendation). The lighting level is important since it affects shutter speed (in camera phones). The incident lux level and shutter speed should be recorded. The camera should be mounted on a shake platform that has at least pitch and yaw movements. Roll is desirable, but translation (x, y, and z) movements add relatively little value. At least ten (and perhaps twenty or more) shaken images without and with OIS should be acquired.
- Select the worst (least sharp) of the shaken images without and with OIS.
The fastest way to find the least sharp (or sharpest) of a batch of images is to run Find Sharpest Files, which lets you read a batch of image files, select a Region of Interest (ROI), then very rapidly rank the files. The numbers used by Find Sharpest Files are not standard and should not be used for anything but comparing a batch of similar images.
| Alternatively, images can be averaged by reading a batch of them into SFRplus and selecting Combine files for signal averaging in the Verify selection window.
|

|
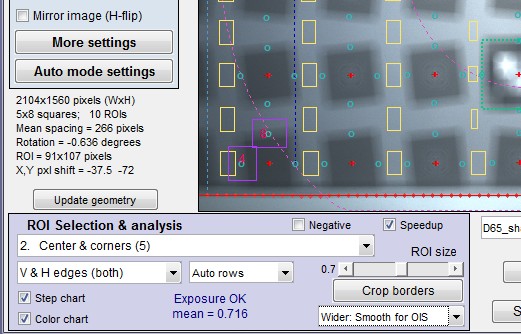 SFRplus region selection SFRplus region selection |
Note the region width selection (just under ). Wider (or Widest): Smooth for OIS is recommended for shaken images, which have very different blur statistics from standard Gaussian-like blurs (doubled due to the sinusoidal nature of the vibration.)
 Be sure the Image Stabilization checkbox is checked in the SFRplus More settings window (shown on the right). This enables results needed for Image Stabilization to be saved in the JSON summary file.
If you are running from (or ) click (at the bottom of the Rescharts window). Be sure JSON summary file is checked in the Save SFRplus results? window. Note the location of the JSON summary files: they are used as an input to Image Stabilization.
- Run the Image Stabilization module by pressing on the left side of the Imatest main window or by clicking Modules, Image Stabilization.
The window shown below will appear.

Image Stabilization opening window
The first time Image Stabilization is run the three windows at the bottom (to the right of 1. Unshaken, 2. Shaken NO OIS, 3. Shaken with OIS) will be unpopulated. On successive runs they will contain the most recent file name, which must be a JSON output file from SFRplus.
- Enter the names of the JSON files (saved output files from SFRplus) in the appropriate boxes.
- If necessary (if you didn’t enter new file names) press on the right to display the results.
Results are shown below.
Image Stabilization metrics
The key goal of Image Stabilization is to calculate the improvement in sharpness that results from Image Stabilization. A few things must be taken into consideration in making the calculation.
- Blur from the unshaken image should be removed from the calculation so that the comparison shows only the effects of image stabilization.
- Shaken images taken without and with image stabilization should be equally representative of the amount of shake so they can be properly compared. This generally requires that the worst of a large batch of images be selected, as described above. For now we’ll omit further detail, like the selection of shake apparatus and discussion of the number of images required for a good statistical sample.
The primary results of Image Stabilization are the average edge and MTF for unshaken, shaken without OIS, and shaken with OIS images. All other metrics are derived from these numbers. The glossary below contains key definitions needed for understanding the results.
Definitions
| Term | Definition |
| Image | |
| NoS | Derived from unshaken image (NO Shake) |
| Shake | Derived from shaken image without Image Stabilization |
| OIS | Derived shaken image with (Optical) Image Stabilization (OIS) |
| Primary results | |
| Average edge |
The average edge spread function, derived from edges in the image using a super-resolution/binning algorithm derived from the ISO-12233 standard. MTF is the modulus (absolute value) of the Fourier transform of the derivative of the Average edge. A function of distance. |
| MTF | Modulation Transfer Function = Spatial Frequency Response. A function of spatial frequency. |
| Derived edge metrics (single numbers derived from MTF or the Average edge) |
|
| MTF50 | The spatial frequency where MTF falls to 50% of its low frequency value. Several units are available. Cycles/Pixel is the most fundamental, but others can be highly useful. Ordinarily, MTF50(NoS) > MTF50(OIS) > MTF50(Shake). Special care is required in occasional situations (due to noise, etc.) where this order is different. |
| R1090 | The 10-90% rise distance of the average edge. |
| R2080 | The 20-80% rise distance of the average edge. May be slightly more immune to ramps in the edge than R1090. |
| LMTF L_MTF |
Length (distance) corresponding to MTF50, that is typically close to R1090 for well-behaved edges. LMTF (pixels) = 1/(2*MTF50 (C/P) ). |
LMTF (L_MTF) is a useful but unfamiliar metric that requires explanation. Essentially it is a length (i.e., distance) derived from MTF that correlates well with R1090. Recall that MTF is the modulus (absolute value) of a Fourier transform, which means that phase information has been removed. With shaken images there can be significant irregularities (asymmetries, ramps, etc.) in edges that can distort R1090 or R2080, making them unreliable as blur metrics. These irregularities, which tend to be a part of the phase of the edge, have a limited effect on MTF. The image below shows an irregular edge.
LMTF = 1/(2*MTF50) when MTF has cycles in its units (e.g., Cycles/Pixel). (LMTF = 1/MTF50 when MTF has line widths in its units, e.g., LW/PH.) In the display below, LMTF = 1/(2*0.0399) = 12.5 pixels, which happens to be close to R1090. This is not always the case.

Average edge profile and MTF for a rather poorly behaved edge.
LMTF = 1/(2*MTF50) = 1/(2*0.0399) = 12.5 pixels, which is close to R1090.
Summary— LMTF (rather than metrics derived directly from the average edge, i.e., R1090 or R1080) is preferable for calculations of image stabilization effectiveness, but all calculations will be available.
Shaken and unshaken edge lengths
Equations for edge lengths (R1090, R2080, and L_MTF) corresponding to NoS, Shake, and OIS measurements are straightforward enough, but
to correctly measure OIS sharpness gain, the unshaken length must be removed
from Shake and OIS edge length measurements.
There are three equations for accomplishing this.
| Method (Note: meas refers to shaken measurements without or with OIS (Shake, OIS). |
Desig- nation |
Description |
| MTF division (probably most accurate) |
div | MTF(NoS removed) = MTF(meas)/MTF(NoS) L(NoS removed) = 1/(2*MTF(NoS removed)) |
| Simple difference (approximation, not very accurate. May be removed from calculations in the future.) |
S1 | L(NoS removed) = L(meas)-L(NoS) |
| Square root of the difference of square lengths (approximation, more accurate than simple subtraction. The best that can be done if MTF is unavailable.) |
S2 | L(NoS removed) = sqrt(L(meas)2-L(NoS)2) |
Results designations
Let L (in L_Shake and L_OIS, below) be one of the edge length measurements (L_MTF, R1090, or R2080).
| Prefix | Edge length measurement |
NoS Removal |
Gain units |
| OIS_gain_ | L_MTF_ | div_ (only for L_MTF) | Delta = L_Shake – L_OIS (usually >0) |
| R1090_ | S1_ | Fraction = L_OIS / L_Shake (usually <1) |
|
| R2080_ | S2_ | Percentage = 100%(1-Fraction) | |
| dB = -20 log10(Fraction) |
For example, the OIS gain using L_MTF with unshaken blur removed by the division method expressed in dB is
OIS_gain_L_MTF_div_dB (This is the preferred metric, described below.)
Preferred calculation
The preferred calculation uses L_MTF with unshaken blur removed by MTF division (div). It’s more mathematically abstract than the difference techniques ((S1) and (S2)) but straightforward and accurate (not an approximation).
MTF(Shake-only) = MTF(Shake)/MTF(NoS) is the equivalent MTF of the shaken image (no OIS) with the unshaken blur removed.
MTF(OIS-only) = MTF(OIS)/MTF(NoS) is the equivalent MTF of the shaken image (with OIS) with the unshaken blur removed.
MTF50 derived from these two numbers can be used to calculate OIS gain, but care must be taken if the expected order of MTF50 (MTF50(NoS) > MTF50(OIS) > MTF50(Shake) is altered.
MTF50(Shake-only) is derived from MTF(Shake-only) only if MTF50(Shake) < MTF50(NoS).
Otherwise MTF50(Shake-only) = MTF50(NoS).
LMTF(Shake-only) = 1/(2*MTF50(Shake-only)).
MTF50(OIS-only) is derived from MTF(OIS-only) only if MTF50(OIS) < MTF50(NoS).
Otherwise MTF50(OIS-only) = MTF50(NoS).
LMTF(OIS-only) = 1/(2*MTF50(OIS-only)).
The OIS gain equations using L_MTF for OIS vs. Shake (no OIS) are,
OIS_gain_L_MTF_div_Delta = LMTF(Shake-only) – LMTF(OIS-only) = MTF50(Shake-only)/MTF50(OIS-only) (fraction, generally > 1)
OIS_gain_L_MTF_div_frac = LMTF(OIS-only) / LMTF(Shake-only) = MTF50(Shake-only)/MTF50(OIS-only) (fraction, generally > 1)
OIS_gain_L_MTF_div_pct = 100%(1-OIS_gain_L_MTF_frac) (percentage, generally >0)
OIS_gain_L_MTF_div_dB = -20 log10(OIS_gain_frac) (decibels, generally >0) (shown below)
Results
Three graphic displays are available.
The first display (below) is the detailed Single region results. Any of the regions (18 in this analysis) can be selected.

Image Stabilization window showing results for single region
MTF for the unshaken image, shaken image (no OIS), and shaken image (with OIS) are displayed along with the Shaken (no OIS)/Shaken (with OIS) transfer function. The table contains all OIS gain results for this edge (derived from L_MTF, R1090, and R1080; all unshaken blur removal algorithms, Delta, fraction, percentage, and dB).
The second display (below) contains Multi-region results for the selected metric. Choices are shown in the image below. The mean OIS gain in the Multi-ROI and 3D plot table can be set to display Vertical-only, Horizontal-only, or both (all edges).

Multi-ROI plot of OIS_gain_L_MTF_div_dB (the preferred result), showing Metric drowdown menu.
(Only a limited number of metrics are currently available for the Multi-ROI and 3D plots.)
The third display is a 3D plot of the selected metric.

3D plot of OIS_gain_L_MTF_div_dB (the preferred result)
A CSV output file can be obtained by pressing . The CSV file that contains summary information about the input files and summary results for Vertical, Horizontal, or V&H edges. Here are some excerpts from the CSV file:
| Input file | 1 | |||||
| Date run | 24-Jan-2013 14:49:02 | |||||
| Image path | C:ImatestDataSFRplusMiscImage_Stabilizationnovibes.bmp | |||||
| Title | novibes.bmp | |||||
| Height Pxls | 1200 | Width Pxls | 1600 | Regions | 18 | |
(This is repeated for the second and (if included) third files.
| Mean of Vertical edges | ||||||
| Shake-only | OIS-only | Delta | Fraction | % | dB gain | |
| 1. L_MTF_div | 14.4877 | 9.8802 | 4.6075 | 0.6812 | 31.8824 | 3.3568 |
| 2. L_MTF_S1 | 11.7326 | 7.4965 | 4.2361 | 0.6333 | 36.6706 | 4.0072 |
| 3. L_MTF_S2 | 14.8671 | 10.4262 | 4.4409 | 0.7001 | 29.9929 | 3.1116 |
| 4. R1090_S1 | 12.4647 | 7.7476 | 4.7171 | 0.6213 | 37.8658 | 4.14 |
| 5. R1090_S2 | 15.6516 | 10.7458 | 4.9058 | 0.6875 | 31.2493 | 3.2607 |
| 6. R2080_S1 | 8.074 | 5.1292 | 2.9448 | 0.6354 | 36.4551 | 3.9865 |
| 7. R2080_S2 | 10.1915 | 7.1259 | 3.0657 | 0.6998 | 30.0222 | 3.1304 |
(This is repeated for Horizontal and H&V edges.)
Note: This appendix is not an integral part of the Image Stabilization instructions, but it may be of interest to people who want to know why and how the Imatest algorithm differs from the CIPA DC-X011 algorithm.
Appendix: Notes on the CIPA DC-X011-2012 specification
CIPA (Japan’s Camera & Imaging Products Association) has published a draft specification, CIPA DC-X011-2012, Measurement and Description Method for Image Stabilization Performance of Digital Cameras (Optical Method), that may be of some interest to Image Stabilization users. However, the Imatest Image Stabilization module does not follow the CIPA specification closely because it has some serious shortcomings.
- Imatest uses the SFRplus test chart (a grid of slanted-edges) while CIPA uses a high-contrast (Black & White) checkerboard with a fruit bowl still life image in the center of the black squares. The edges of the CIPA chart are straight vertical and horizontal with a minimum contrast of 20:1. SFRplus charts could be printed with a 20:1 contrast that would satisfy the description ii §4-2-1, but if they were they tend to clip or saturate, which reduces measurement accuracy. We don’t recommend printing SFRplus with over 10:1 contrast. (We currently recommend 4:1 contrast SFRplus charts, which are consistent with the upcoming revised ISO-12233 standard.)
- DC-X011 makes no mention of MTF, which has been the industry-standard of measuring sharpness for decades. Instead, it uses the 10-90% rise distance, which is a less reliable metric. The math applied to these distances (for removing the unshaken blur, etc.) is an approximation and is inconsistent (sometimes simple addition or subtraction, sometimes the square root of the sum of the squares). The vertical and horizontal edges can result in sampling phase errors (which is why slanted-edges are used in the ISO-12233 standard: see Sharpness – What is it and how is it measured?) The CIPA standard recommends an excessive number of image acquisitions. For example, it recommends acquiring ten images without camera shake (§4-4-1), but doesn’t say what to do with them (best case? worst? average?). Only one is needed for a properly designed slanted-edge target.
Below are some notes I took while reading the CIPA standard. They include a glossary of obscure definitions used in the standard.
Since some of the terminology in section 3-3 the CIPA document may be confusing to English speakers— and is important to understanding the remainder of the document, we have created the following glossary. Blur has units of distance: pixels or microns.
| Term | § | Definition |
| (O)IS | (Optical) Image Stabilization | |
| Motion Blur Amount | 3-3-5 | Shaken, without OIS. |
| Bokeh | 3-3-6 | Blur (generic). May be caused by misfocus or camera shake. |
| Bokeh Offset Amount | 3-3-10 | Blur measured without shake. §4-2-8 seems to imply that the 10-90% rise distance (for the linearized image) is the key blur or bokeh metric. |
| Theoretical Motion Blur Amount | 3-3-12 | Blur measured with IS OFF. Apparently does not include other blur factors (i.e., blur without shake), but not clear. |
| Estimated Comprehensive Bokeh Amount | 3-3-13 | Theoretically estimated blur = sqrt((Bokeh offset amount)2 + (Theoretical motion blur amount)2 ) |
| Measured Comprehensive Bokeh Amount | 3-3-14 | Total blur measured with IS ON. |
| Reference Motion Blur Amount | 3-3-15 | A value used to calculate image stabilization performance. Equal to estimated comprehensive bokeh amount (IS OFF) – bokeh offset amount. Sounds suspiciously like Theoretical motion blur amount. If you’re confused, read §3-3-15 of the CIPA DC-X011 spec (which isn’t likely to reduce your confusion). |
| Measured Motion Blur Amount | 3-3-16 | Total blur measured with IS ON – Blur measured without shake. |
More notes
Little is said about the “vibratory apparatus” except that it should have yaw and pitch waveform components. (Where’s Roll? In the same place as the “Roll” in “Rock and Roll”?)
§4-2-7 states that “the shooting distance shall be about 20 times the 35mm equivalent focal length.” Why can’t it just say “field height should be about 19 inches (48 cm)? 24-inch (60 cm) high Imatest SFRplus charts are close to ideal.
§4-2-8 implies that the 10-90% rise distance (for the linearized image) is the key distance metric.
§4-4-1: Bokeh Offset Amount = unshaken blur. >= 10 images recommended. What do they mean by 6) … “until the necessary and sufficient shutter speed is attained”? (Probably some arbitrary maximum.)
§4-4-2: Measured Comprehensive Bokeh Amount = Blur measured with shake, IS ON.10 then >=200 images should be taken with shake ON for each shutter speed.Not clear how to select among the 200+ images.
§4-4-3: Measured Comprehensive Bokeh Amount = Blur measured with shake, IS ON. Very similar to 4-4-2. It would be a LOT clearer if they emphasized the differences.
§4-5-1: b) How can IS performance be measured with a camera incapable of turning the IS function OFF? Apparently the vibration angle of the vibratory apparatus is known. (This angle could be affected by the weight of the camera & lens.) A very high quality vibratory apparatus would be required. This approach won’t be implemented soon in Imatest.
1) Bokeh Offset Amount = unshaken blur. By sqrt(Yaw2 + Pitch2) do they mean vertical and horizontal edges? Clear as mud.
5: To measure IS performance in “stops” (f-stops or EV), measurements must be made at several shutter speeds. For camera phones (with very limited adjustments) this will require different light levels.
6.8: Have the authors heard of MTF? After reading this section (which I’d characterize as a lot of confusion about the circle of confusion) I scanned the document for MTF. Nada. I am shocked. Unbelievable!