Deprecated in Current Release
Testing lenses (Deprecated): introduction
Note: This page has been largely replaced by Testing Lenses with SFRplus. It is being kept for reference only.
Lens quality (especially sharpness) has always been of great interest to photographers. It’s what we spend the big bucks for— if we have them. And we look for it in a lens at any price point. Traditionally, lens testing has been highly tedious, best left to professionals and large publications. With Imatest, that has changed forever. All you need to do is photograph a simple target (with careful technique, of course), run Imatest SFR, the similar but more interactive Rescharts Slanted-edge SFR, or the highly automated SFRplus, and interpret the results. SFR and SFRplus measure the most important lens quality factor: sharpness, which is characterized by spatial frequency response (also called MTF for Modulation Transfer Function). Although the complete MTF response curve is of interest, the spatial frequencies where contrast falls to half its low frequency and peak values, MTF50 and MTF50P, are simple and useful indicators of both image and lens sharpness. Their relationship to print quality is discussed in Interpretation of MTF50 and SQF/Acutance. SFR and SFRplus also measure lateral Chromatic aberration, which can appear as color fringing near the edges of the frame. Other lens quality factors are described here.
| RAW files In addition to standard image files, SFR and SFRplus can analyze Bayer raw files: standard files (TIFF, etc.) that contain undemosaiced data. RAW files are not very useful for measurring MTF because the pixel spacing in the individual image planes is twice that of the image as a whole; hence MTF is lower than for demosaiced files. But Chromatic aberration can be severely distorted by demosaicing, and is best measured in Bayer RAW files (and corrected during RAW conversion). Details of RAW files can be found here. |
Imatest is straightforward to use and produces clear numeric results, but careful technique is vital. To fully characterize a lens you should test it with a variety of settings.
- Aperture: most lenses are relatively soft wide open and sharpest around the middle of their range (the “optimum” aperture): f/5.6 to f/11 for the 35mm and digital SLRs; f/2.8-f/5.6 for compact digital cameras.
- Focal length in zoom lenses also strongly affects sharpness, but there are no general guidelines about which are best.
- Distance from the image center: Lenses tend to be softer toward the edges. For this reason you should test sharpness at several locations in the frame (easy with SFR; easier with SFRplus). We recommend 9 regions to fully characterize a lens: 1 near the center, 4 part-way out (near the top, bottom, and sides), and 4 near the corners. In a well-manufactured lens, sharpness will be symmetrical about the center of the image, but we live in an era when manufacturers are constantly striving to reduce production costs, often at the expense of manufacturing quality. Even premium lenses may be poorly centered.
You’ll need to purchase a chart or print it on a photographic quality inkjet printer ,and you’ll need a flat surface for mounting the target (thick foam board from any art supply store is perfect), an environment with even, glare-free lighting, and a sturdy tripod: items most photographers have or can easily locate. You can learn a lot by testing your own lenses, but you must be aware of one essential fact.
|
You cannot measure a lens in isolation. It is a part of an imaging system that includes the camera’s image sensor and RAW converter (which may sharpen the image), or film, scanner, and scanner software. Hence,
|
The basic steps in testing the lens are:
The test target
These instructions are excerpted from Using Imatest SFR, Part 1. Several alternatives are available for obtaining test targets.
- Purchase a target from the Imatest store. We recommend the SFRplus target.
- Download one of the test images shown below and print it on a high quality inkjet printer or send the file to a lab for printing, for example, one of the labs listed by Dry Creek Photo.
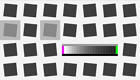 Create and print a test image with the Imatest Test Charts module. A variety of contrast ratios and highlight colors are available. Several Structured vector graphics (SVG) charts are available in Imatest Master. SVG charts with m x n grid patterns (example on right) are well suited for printing large and for automated testing, and have numerous advantages over the ISO 12233 chart.
- Purchase a chart such as the ISO 12233 (QA-72) or QA-77 or as a less expensive alternative from Danes-Picta in the Czech Republic (the DCR3 chart on their Digital Imaging page). The Applied Image charts are printed with much higher resolution than an inkjet printer can achieve, hence they can be used at much closer distances. Their disadvantage is that they have very high contrasts (>=40:1), which often results in reduced accuracy, and they have a great deal of wasted real estate: usable edges may not be found in regions of greatest interest such as the four corners.
- A printable vector-graphics version of the ISO 12233 chart is available courtesy of Stephen H. Westin of the Cornell University Computer Graphics Department. It should be printed as large as possible (17x22 inches (A2) minimum; 24x36 inches (A1) if possible for 8+ megapixel cameras) so measured sharpness is limited by the camera and lens, not the printer. Because of the limitations of the ISO chart (described above), the Imatest SVG charts are generally preferable.
You can download printable test charts by right-clicking on the thumbnails below. The bitmap chart, which is included in the samples folder of the Imatest installation, has pixel levels 47 and 255, has a contrast ratio of (255/47)2.2 = 41 when printed at gamma = 2.2 (the normal setting). This is close to the minimum recommended by the ISO 12233 standard (but higher than optimum; the revised ISO 12233 standard under development will recommend lower contrast). The two SVG charts have contrast ratios of 20 and 2. Instructions for their use can be found in SVG Test Charts. The recommended print size is letter or A4, but these charts print at maximum quality for any size.
| SVG charts — can be viewed, edited, and printed from Inkscape. Right-click on the links to save the file. Download size: 304 KB (SVG); 500 KB (PDF). Printing instructions are here. | |||
 |
Contrast = 20, light, gamma = 2.2, white highlights (SVG) | Contrast = 20 (PDF) High enough contrast to ensure maximum sharpening in most cameras but low enough to avoid clipping most of the time. |
|
Contrast = 2, middle, gamma = 2.2, white highlights (SVG) | Contrast = 2 (PDF) Relatively low contrast: little, if any, sharpening would be expected. The two charts should have the same MTF if no nonlinear processing is applied, for example, with RAW files with dcraw conversion. |
|
Bitmap chart
|
|||
 |
Edge_chart_low.png (reduced contrast; pixel levels 47, 255) | ||
|
Nonlinear signal processing and chart contrast Although Imatest SFR is relatively insensitive to chart contrast (MTF is normalized to 100% at low spatial frequencies), measured SFR is often affected by chart contrast due to nonlinear signal processing in cameras, i.e., processing that depends on the contents of neighboring pixels, and hence may vary throughout an image. Nonlinear processing is almost universal in digital cameras (though you can avoid it by using RAW images with dcraw). It improves pictorial quality but complicates measurements. It takes two primary forms.
The signal processing algorithms are proprietary; they are a part of a manufacturer’s “secret sauce” for producing pleasing images. Though they vary a great deal, some generalizations can be made. Most cameras do NOT apply noise reduction and sharpening uniformly throughout an image. Contrasty edges tend to have better (more extended) MTF than low contrast edges. For this reason it may be a good idea to photograph both a relatively contrasty edge (though not so high that it causes clipping) as well as a relatively low contrast edge. The SVG charts (above) are excellent choices. Both types of edge can also be produced using Imatest Test Charts. An estimate of chart contrast derived from the average light and dark pixel levels (away from the transition) and gamma is displayed in several places in SFR and Rescharts Slanted-edge SFR. (Estimated chart contrast = (avg. pixel level of light area/avg. pixel level of dark area)^(1/gamma) ). Nonlinearities are analyzed in depth in the Log F-Contrast module. |
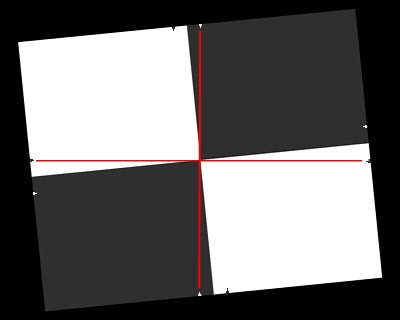 The use of guide marks for tilting the chart
Print the test image (either downloaded or created by Test Charts) from an image editor using a high quality inkjet photo printer on glossy, semigloss, or luster paper. Alternatively, send it to a lab to be printed. Dry Creek Photo has an excellent listing. I recommend printing at least two copies: one for measuring center sharpness and one for edge sharpness. The printed image size should be 8x10 inches (20.3x25.4 cm) or smaller— size is not critical. Be sure the edges look clean and sharp to your eyes; examine them with a good magnifier or loupe. Chart quality is discussed in detail in Chart quality and distance. The charts should be tilted approximately 5.7 degrees (anywhere between 2 and 7 degrees is OK) when they are photographed. It is tilted 5.7 degrees when the tick marks, located near the edges, are vertically or horizontally aligned with the center. This is illustrated by the red horizontal and vertical lines on the right. Imatest Master can analyze edges of nearly any angle; exact horizontal, vertical, and 45° edges should be avoided for best results. The charts are printed straight and physically tilted because the edges print sharper that way. If they were printed at an angle, the printer dot pattern could cause some jaggedness. A 5.71° angle (tan-1(0.1)) is an offset of one part in 10.
Assemble the prints into a target to be photographed.
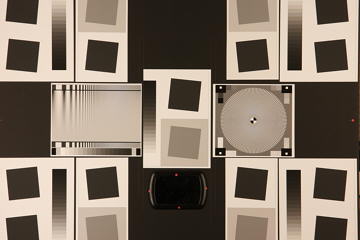
The following target is described in detail in The Imatest Test Lab. It can be used to measure lens performance near the center, part-way out, and near all four corners. The Log F-Contrast and Star charts to the left and right of center are not necessary for lens testing; they provide information about signal processing.
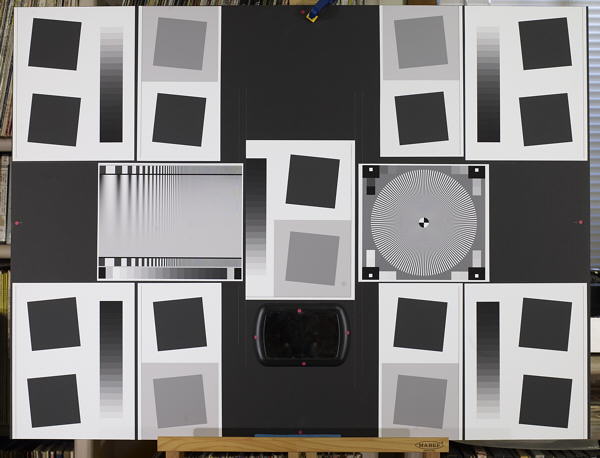
Sharpness target (30×40 inch) for cameras up to 13 megapixels
The printed charts are mounted on a 32x40 inch sheet of 1/2 inch thick black foam board with spray adhesive or double-sided tape. If a ColorChecker is substituted, Velcro is recommended so it can be removed for dark storage. 1/2 inch foam board stays flatter than standard 1/4 or 3/8 inch board. Black board results in less flare light than white board. (Flare light is light that bounces between lens elements and off the inside of the lens barrel, reducing image contrast).
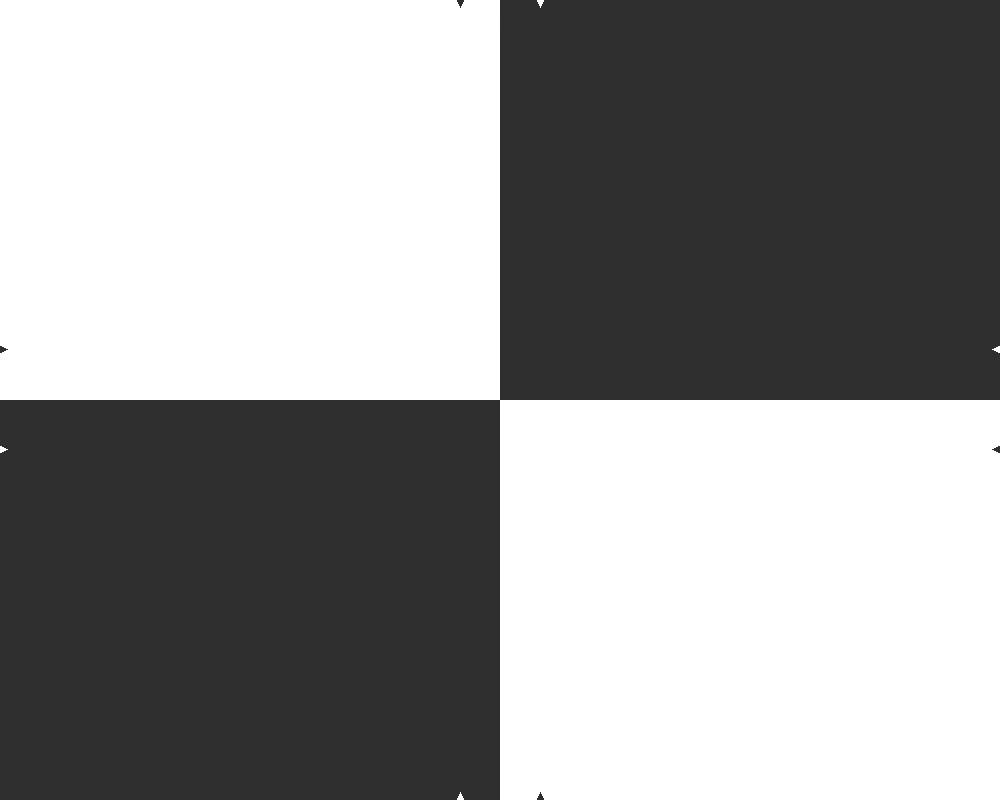
An image of a horizontal or vertical edge on an LCD monitor (desktop or laptop) can also be used as a target. The camera should be tilted with respect to the monitor. The image dark gray and white rather than black and white to minimize clipping. This page contains a description and an image, as well as a description of the Screen Patterns module, which can be used to create an image. The disadvantage of this technique is that you have only one edge to work with; you can’t easily create a map of lens performance.
Photograph the target.
Framing
| Frame the chart so there are usable edges near the center, part-way out, and near the corners. Take care that the chart is properly aligned. A number of useful alignment techniques and tricks are presented in The Imatest Test Lab. |
 |
For a given lens/focal length combination, I recommend testing the lens over a range of f-stops from wide open to fully stopped down. Digital SLR lenses are typically sharpest around f/8. Sharpness is lost to lens aberrations at large apertures and diffraction at small apertures. With Imatest SFR you can find the precise optimum aperture.
Lighting
The chart below summarizes lighting considerations. The goal is even, glare-free illumination. Lighting angles between 30 and 45 degrees are ideal in most cases. At least two lights (one on each side) is recommended; four or six is better. Avoid lighting behind the camera, which can cause glare. Check for glare and lighting uniformity before you expose. A description of recommended lighting setups can be found in The Imatest Test Lab. (We formerly recommended 4700K (near-daylight) SoLux quartz-halogen lamps, but we now recommend LED lamps, which are available with adjustable intensity and color temperature.) The BK Precision 615 Light meter (Lux meter) is an outstanding low-cost instrument (about $100 USD) for measuring the intensity and uniformity of illumination.
Distance
|
Using a chart printed on Premium Luster paper on the Epson 2200 (a high quality pigment-based inkjet photo printer), the MTF of the 6.3 megapixel Canon EOS-10D showed no change if the image field was at least 22 inches (56 cm) wide– twice the length of the chart. Performance falls off slowly for smaller widths. Choose a camera-to-target distance that gives at least this image field width. The actual distance depends on the sensor pixel count and the focal length of the lens. Cameras with more pixels, and hence higher potential resolution, should should have a larger image field width. Some guidelines for the minimum field width are,
|
Image field width (in inches) > 8.8 * sqrt(megapixels) ( > means “greater than.”) Image field width (in cm) > 22 * sqrt(megapixels)
The distance to the target should be at least 40X the focal length of the lens for digital SLRs. (25X is the absolute minimum; 40X leaves some margin.) For compact digital cameras, which have much smaller sensors, the distance should be at least 100X the actual focal length (not the 35mm-equivalent): the field of view is about the same as an SLR with comparable pixel count. The recommended distance is described in geeky detail in Chart quality and distance. |
More on distance can be found in SFR Instructions Part 1. |
Exposure
| Proper exposure is important for accurate Imatest SFR results. Neither the black nor the white regions of the chart should clip— have substantial areas that reach pixel levels 0 or 255. The best way to ensure proper exposure is to use the histogram in your digital camera. Blacks (the peaks on the left) should be above the minimum and whites (the peaks on the right) should be below the maximum. |
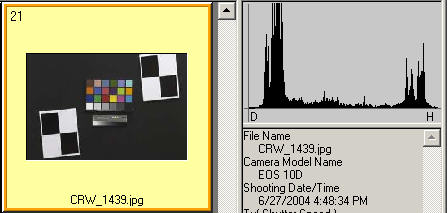 |
The histogram, taken from the Canon File Viewer Utility, indicates excellent exposure.
| Tips on photographing the chart |
| Distance doesn’t matter as long as the target far enough from the camera so sharpness is limited by the camera and lens, not by the target. For a target printed on the Epson 2200 printer, a distance that gives at least a 24 inch (horizontal) field of view seems to be sufficient. |
| The target should be evenly lit and free of glare. |
| White balance should be approximately neutral. |
| Use a sturdy tripod and a cable release. If possible, use the mirror lock. You can use Imatest SFR to find the difference made by a good tripod or mirror lock. Imatest SFR can sharpen your technique, literally ( pun intended ). |
| Be sure to expose the image so detail is maintained in both light and dark areas. Neither should be blocked (clipped). Use your camera’s histogram. If more than 0.5% of the pixels are at levels 0 or 255, Imatest SFR will assume that clipping has taken place and issue a warning message. This has no effect on the calculations– it’s just a warning that accuracy may be compromised. |
| Be sure the camera is correctly focused on the chart. Imatest SFR can test the accuracy of your camera’s autofocus. |
| Place slanted-edge images near the corners of the field as well as near the center. |
Save the image as a RAW file or maximum quality JPEG. If you are using a RAW converter, convert to JPEG (maximum quality), TIFF (without LZW compression, which isn’t supported), or PNG. If you are using film, develop and scan it. The file name should be descriptive and should indicate the parameters you are testing. Use dashes and underscores ( – and _ ), but try to avoid spaces, which work with Imatest, but can cause trouble in DOS command lines and web pages. An example of a file name is Canon_EOS10D_70-200f4L_100mm_f8.jpg. If the folder contains meaningless camera-generated file names such as IMG_3734.jpg, IMG_3735.jpg, etc., you can change them to meaningful names that include focal length, aperture, etc., with the View/Rename Files utility, which takes advantage of EXIF data stored in each file.
Run Imatest SFR or Rescharts Slanted-edge SFR
These instructions are excerpted from Using Imatest SFR, Part 2 . Start Imatest by double-clicking the Imatest icon ![]() on the Desktop, the Windows Start menu, or in the Imatest directory (usually C:Program filesImatest in English installations). After several seconds, the Imatest main window opens. Then, either
on the Desktop, the Windows Start menu, or in the Imatest directory (usually C:Program filesImatest in English installations). After several seconds, the Imatest main window opens. Then, either
- Click . The button is grayed out (inoperative) for the first run because no file has yet been read. It can be used in succeeding runs to save time when analyzing different regions, though multiple ROI (region of interest) runs are more efficient.
- Click , then either
- Click if Slanted-edge SFR is the selected Chart type, or
- Select Slanted-edge SFR from the Chart type: dropdown window.
The Rescharts Slanted-edge SFR module performs the same calculations as SFR, but with more interactive interface, described on the Rescharts page.
Select the image file or batches of files
When you click , the window below appears, requesting the image file name(s). The folder saved from the previous run appears in the Look in: box on the top. You are free to change it. You can open a single file by double-clicking on it. With Imatest Master you can select multiple files (for combined or batch mode runs) by the usual Windows techniques: control-click to add a file; shift-click to select a block of files. Then click . Three image files for the Canon 17-40mm L lens (taken with the EOS-10D) are highlighted. Large files can take several seconds to load. Imatest remembers the last folder used (for each module, individually).
Multiple ROI selection (for batch runs, Imatest Master only).
|
Select the ROI (Region of Interest)
If the image has the same pixel dimensions as the last image in the previous run, a dialog box asks you if you want to repeat the same ROIs (regions of interest) as the previous image. You can retrieve saved ROIs from past runs by clicking on in the Imatest main window prior to selecting SFR.
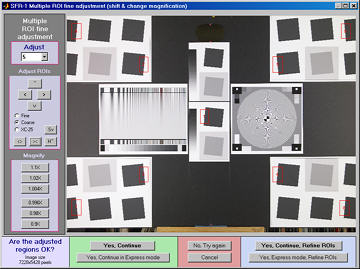
| If you answer No or if the image has a different size, the coarse selection dialog box shown on the right is displayed with the instructions, Select ROI by clicking and dragging, or clicking outside image. Click on one corner of the intended region, drag the mouse to the other corner, then release the mouse button. Click outside the image to select the entire image.After you make your selection, the ROI fine adjustment dialog box (below) appears. You can move the entire ROI or any of the edges in increments of one pixel. You can also enter the ROI boundary locations in the boxes below the image. If you do this, be sure to press return (or move the cursor) to register the change. You can zoom out to view the entire image, then zoom back in. | 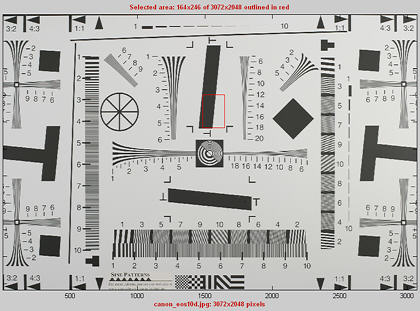 ROI selection using ISO 12233 chart(popular, but has much wasted area) ROI selection using ISO 12233 chart(popular, but has much wasted area) |
When you are satisfied with the ROI selection, proceed by selecting one of five choices at the bottom of the box. The ROI fine adjustment is particularly valuable for working with tiny regions and excluding interfering detail.
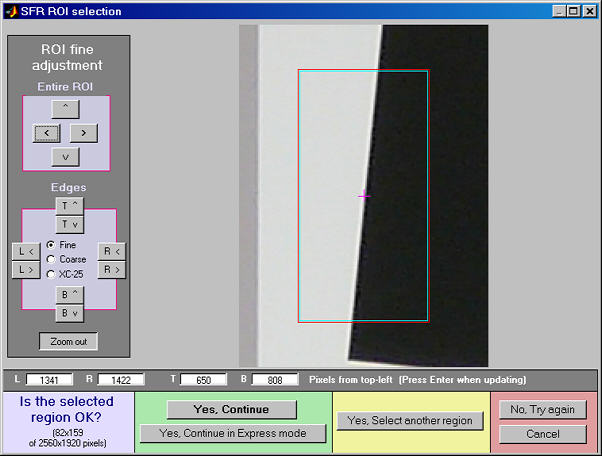
ROI fine adjustment
|
If the selected area is too small, too large, or inappropriate, you’ll be asked to repeat the selection. The ROI is normally checked for validity, but there are some cases (e.g., endoscopes) where valid images may fail the usual tests ROI filtering can be relaxed considerably by opening the button in the Imatest main window (Pro only) and clicking Light filtering in the first group of controls. This can can lead to errors when regions are selected carelessly. Normal filtering is the default. After the run is complete, you can save ROIs for future runs in a named file by clicking on in the Imatest main window. These settings can be retrieved later by clicking on .
Cropping recommendations
| For best accuracy the length should be between about 80 and 500 pixels. In most cases little is gained for lengths over 300 pixels.The width (height in the image on the right) should be at least 50 pixels. The light and dark zones should be at least 10 pixels wide, with 20 preferred. Little is gained for minimum dark/light zone widths over 40 pixels or total width over 100 pixels. | 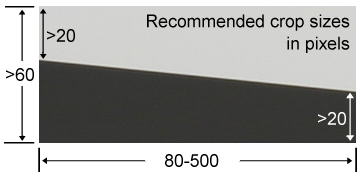 |
My typical crops are between around 120x80 and 300x140 pixels. The absolute minimum and maximum crop dimensions are 10 and 1200 pixels (800 for strong ROI filtering). For very small crops (width or length less than about 25 pixels) a warning message may appear in place of the light/dark level display: Zero counts in n bins. Accuracy may be reduced. This indicates that some interpolation was required to obtain the final result, and that you should be aware that results may not be as accurate or repeatable as they would be for larger ROIs. Small crops or noisy images may require weaker error filtering than normal crops/images. Press in the Imatest main window and set SFR ROI filtering to Light filtering.
SFR input dialog box
After you select the Region(s) of Interest (ROI(s)) the Imatest SFR input data window appears, unless Express mode has been selected. All input fields are optional. Most of the time you can simply click OK (the box on the lower right) to continue. Selections are saved and can be used for future express runs. The input data window is described fully in SFR instructions, Part 2. It is divided into sections: Title and on top, then Plot, Options, Settings, Optional parameters, and finally, or . Here are a few highlights.
SFR input dialog box (full version) Plot This area controls which figures to plot. Settings are saved between runs. The boxes adjacent to Edge/MTF control the x-axis scaling for the MTF plots. You can choose between Cycles per pixel (the default), Cycles per distance (inch or mm), Line Widths or Pairs per Picture Height (LW/PH or LP/PH), or Cycles per angle (milliradians or degrees). If you choose Cycles per distance or angle, you must enter the pixel spacing— either in pixels per inch, pixels per mm, or microns per pixel. If pixel size is omitted, the x-axis will be displayed in Cycles per pixel. Display options affects the appearance of plots.
- Secondary readout(s) (defaults to MTF30, the spatial frequency for 30% contrast; MTF50 is the primary readout.) Can be set for MTFnn or MTFnnP at any contrast level or to MTF at a specified spatial frequency in cycles/pixel, line pairs/inch or line pairs/mm. For example, you might select MTF at the half-Nyquist frequency, 0.25 cycles/pixel. Details.
- MTF plot freq selects the maximum display frequency for MTF plots. The default is 2x Nyquist (1 cycle/pixel). This works well for high quality digital cameras, not for imaging systems where the edge is spread over several pixels. In such cases, a lower maximum frequency produces a more readable plot. 1x Nyquist (0.5 cycle/pixel), 0.5x Nyquist (0.25 cycle/pixel), and 0.2x Nyquist (0.1 cycle/pixel) are available.
- Edge plot selects the contents of the upper (edge) plot. Three displays are available. 1. Edge profile (linear) is the edge profile with gamma-encoding removed (the default). 2. Line spread function (LSF) is the derivative of the linear edge profile. 3. Edge pixel profile is proportional to the edge profile in pixels, which includes the effects of gamma encoding. The edge can be cropped (default) or the entire edge can be displayed.
- Chart contrast For a medium or low contrast charts (contrast <= 40; not recommended with the old ISO 12233 chart), you can enter the chart contrast (or Off). If the ROI is large enough, the actual (measured) gamma will be calculated and displayed along with the contrast factor (the chart contrast multiplier = measured gamma/nominal gamma, where nominal gamma is entered in the Settings area, described below). If the Use for MTF box just to the right is checked, this value will be used in the MTF calculation, which may result in a modest improvement in accuracy.
- restores the settings in Options and Settings to their default values.
Settings (affects the calculations)
- Standardized sharpening is a software “filter” applied to a camera’s MTF response that facilitates comparisons between cameras by compensating for different degrees of sharpening. Standardized sharpening display, which appears as red dashed curves ( − − − − ) in the edge and MTF plots, is selected with the checkbox. Radius controls the sharpening radius. The default value of 2 (pixels) is works well for many compact digital cameras; it is often smaller for Digital SLRs, and can be different for different RAW converters. For very broad transitions, the radius is automatically increased unless Fixed sharpening radius in the Settings menu of the Imatest main window has been checked. For more detail, see What is standardized sharpening, and why is it needed for comparing cameras?
Standardized sharpening should be unchecked for most lens tests. Standardized sharpening tends to “flatten” lens comparisons, though it can give a useful indication of what to expect after sharpening. - Gamma is the exponent of the curve that relates scene luminance to pixel level. It is explained briefly in the glossary and in detail here. It defaults to 0.5, which is typical of digital cameras, but it is affected by camera (or RAW converter) contrast settings. Gamma is reliably 0.5 when RAW files converted with dcraw are entered into Imatest. Gamma is used to convert pixel levels back to the linear scale required to calculate MTF. A 10% error in gamma results in a 2.5% error in MTF50. If you have doubts about the value of gamma, I recommend running Colorcheck or Stepchart. A nominal value of gamma should be entered, even if the value of gamma derived from the chart (described above) is used to calculate MTF.
- Channel is normally left at it’s default value of Y for the luminance channel, where Y = 0.3*R + 0.59*G + 0.11*B. In rare instances the R, G, and B color channels might be of interest.
- (Standardized sharpening unchecked ): Standardized sharpening results are replaced with RMS Edge roughness in pixels and MTF50P: the frequency where MTF drops to half its peak value— a useful indicator of the performance of heavily-sharpened cameras without post-processing. (MTF50P = MTF50 for cameras with weak to moderate sharpening.) The plots for the separate RGB channels are emphasized, but the MTF summary .CSV output is unchanged.
- Picture Width and Height defaults to the width and height of the input image in pixels, assuming landscape format, where height < width. If the input image has been cropped, or if it doesn’t represent the entire camera image, Picture Height (and Width) should be entered manually.
When entries are complete, click OK. A Calculating… box appears to let you know that calculations are proceeding. Results appear in individual windows called figures (Matlab’s standard method of displaying plots). Figures can be examined, resized, maximized, and closed at will. Their contents are described in MTF (Sharpness) plot, Chromatic Aberration, Noise, and Shannon Capacity plot, and Multiple ROI (Region of Interest) plot.
Two precautions when working with figures
| Too many open FiguresFigures can proliferate if you do a number of runs, especially SFR runs with multiple regions, and system performance suffers if too many Figures are open. You will need to manage them. Figures can be closed individually by clicking X on the upper right of the Figure or by any of the usual Windows techniques. You can close them all by clicking Close figures in the Imatest main window. | Clicking on Figures during calculationscan confuse Matlab. Plots can appear on the wrong figure (usually distorted) or disappear altogether. Wait until all calculations are complete— until the Save or Imatest main window appears— before clicking on any Figures. |
Save the results
 SFR Save dialog box.At the completion of the SFR calculations the Save SFR results? dialog box appears (unless Express mode has been selected). It allows you to choose which results to save and where to save them. Selections are saved for future runs. The default is subdirectory Results of the data file directory. You can change to another existing directory, but new results directories must first be created outside of Imatest using a utility such as Windows Explorer. (This is a limitation of this version of Matlab.) Figures, CSV, and XML data are saved in files whose names consist of a root file name with a suffix and extension. The root file name defaults to the image file name, but can be changed using the Results root file name box. Be sure to press enter. When multiple ROIs are selected, the Save results? dialog box appears only after the first set of calculations. The remaining calculations use the same Save settings. The first four checkboxes are for the figures. 5-7 are for Excel .CSV results. 8 is for XML output. You can examine the output figures before you check or uncheck the boxes. Checking Close figures after save closes figures after they are saved. This can be useful for large batch runs (Imatest Master only), where too many open figures will degrade the performance of most computers. Details of the output files can be found here. The following table lists figures and Excel-readable CSV files produced by Imatest SFR.
| Figures (.PNG image files) | |
| filename_YA17_cpp.png | Plot with x-axis in cycles/pixel (c/p), Y-channel,17% of the way to the corner above the center of the uncropped image. |
| filename_YA17_lwph.png | Plot with x-axis in Line Widths per Picture Height (LW/PH). |
| filename_YA17_ca.png | Plot of Chromatic Aberration, with noise statistics and Shannon information capacity. |
| Excel .CSV (ASCII text files that can be opened in Excel) | |
| CSV output files are explained in detail below. Click link for detail on individual file. | |
| SFR_cypx.csv | (Database file for appending results: name does not change). Displays 10-90% rise in pixels and MTF in cycles/pixel (C/P). |
| SFR_LWPH.csv | (Database file for appending results: name does not change). Displays 10-90% rise in number/Picture Height (/PH) and MTF in Line Widths per Picture Height (LW/PH). |
| filename_YA17_MTF.csv | Excel .CSV file of MTF results for this run. All channels (R, G, B, and Y (luminance) ) are displayed.The first row has the headers: cy/pxl, LW/PH, MTF(nchan), MTF(corr), MTF(R), MTF(G), MTF(B), MTF(Y), where nchan is the selected channel. The remaining lines contain the data. Can easily be plotted or combined with data from other files. |
| filename_Y_multi.csv | Excel .CSV file of summary results for a multiple ROI run. |
| filename_Y_sfrbatch.csv | Excel .CSF file combining the results of batch runs (several files) with multiple ROIs. Particularly useful for generating easily-readable Excel plots. |
Repeated runsIf SFR was previously run with an image of the same pixel dimensions and you click on either of the Run SFR buttons, an image that displays the selected ROIs appears on the left of the screen and you’ll be asked, “Do you want the same ROIs as the previous image?” A portion of the previous image and the ROI repeat box for Imatest Studio are shown in the image on the right. Two additional options are available for Imatest Master. |
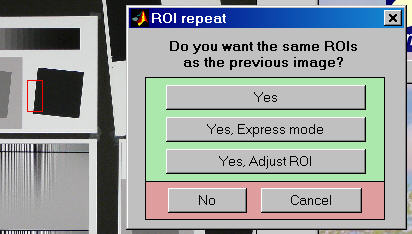 ROI repeat dialog box: Imatest Studio (Master below) ROI repeat dialog box: Imatest Studio (Master below) |
| Yes | Use the previous crop. Open SFR input dialog box. |
| Yes, Express mode | Use previous crop and run in Express mode. Do not open the input dialog box; use saved data instead. Save dialog boxes are also omitted.Some warnings are suppress. Speeds up repeated runs, e.g., testing several apertures. |
| Yes, Adjust ROI | Open a fine adjustment dialog box (shown below), starting with the previous selection.Useful for a sequence of runs with similar, but not identical, framing.Imatest Studio: Only available when a single ROI is selected. Imatest Master : For multiple ROIs, a window that allows ROIs to be shifted and changed in magnification is opened. |
| No | Crop the image using the Select the ROI… dialog box described above. |
| Cancel | Cancel the run. Return to the main Imatest window. |
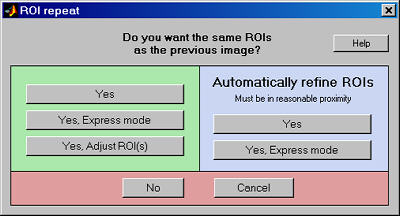
| Automatically refine ROIsYes | Imatest Master onlyRefine previous crop (see description below) and run in Express mode. |
| Automatically refine ROIsYes, Express mode | Imatest Master onlyRefine previous crop (see description below). Open SFR input dialog box. |
| Automatic ROI refinement (Imatest Master only) This option is very useful for sequences of runs where chart alignment varies slightly; it can be especially valuable for Imatest API in manufacturing environments. The Imatest Master ROI repeat dialog box offers two options in the light blue box on the right (Yes and Yes, Express mode) that include automatic ROI refinement. Results of the refinement are shown in the crop of the Multi-ROI 2D summary plot on the right. The original (incorrect) ROIs are shown as cyan rectangles; the automatically refined (shifted) ROIs are shown as bold red rectangles filled with the full contrast image. Automatic ROI refinement works best with charts dedicated to SFR measurement such as the SFR SVG test charts. It may not work as well with the ISO 12233 charts because of the narrowness of the SFR strips and the presence of interfering patterns. The length of the ROIs should be no larger than 85% of the length of the edge to be measured. Automatic refinement will succeed if no more than 30% of the ROI length is off the edge. The modified ROI is not saved in imatest.ini. |
ROI repeat dialog box: Imatest Master
Results of automatic ROI Refinement: Original (cyan) and refined (bold red) |
Interpret the results
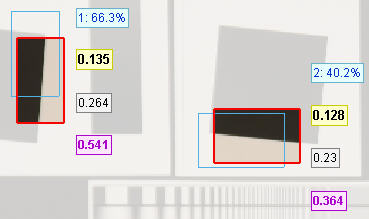
Multiple regions If you selected multiple regions of interest and checked one of the 2D image plots in the Multi-ROI plots section of the input dialog box, as shown above, the following summary display appears.
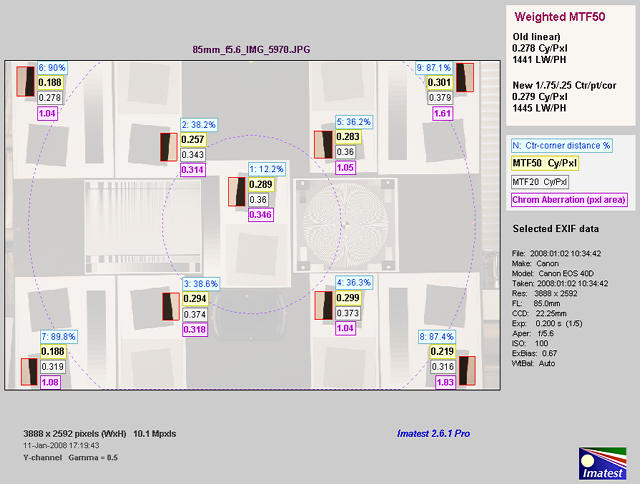
Multi-ROI 2D summary plot, showing Center-corner distances,
MTF50, MTF20, and Chromatic Aberration (in pixels) superimposed on image.
This display can be particularly useful because lenses are not always centered properly. (If they were, performance would be a simple function of the distance from image center.) You can quickly scan the summary results, then look at the detailed results for the individual region. The legend explaining the four results boxes next to each ROI is on the right. The boxes contain (1) The ROI number (N) and the center-to-corner distance expressed in %, (2) MTF50 in either cycles/pixels or LW/PH, in boldface for emphasis, (3) MTF20, and (4) Chromatic Aberration in pixels of area.
If you saved the CSV summary output files for sequences of multiple ROI runs (for example, for a sequence of apertures: f/4, f/5.6, f/8, f/11, …) or if you did a batch run using multiple ROIs, you can combine data from several runs and produce concise summary plots in Excel. The technique is described here. Here is an example.
 Summary plot for 6 multi-ROI runs (f/5.6-f/32) for the Canon 17-85mm IS lens, EOS-40D (JPEG)
The Excel file was created by combining single-column summary results from the CSV summary output files for the 6 runs.
 Edge and MTF display.
Single region detail The most detailed Imatest SFR figure, shown on the right, contains the average edge profile on top and MTF (spatial frequency response) on the bottom. (Input-related data on the right of the figure is omitted here.) Although the edge response in the upper figure is relevant to sharpness, the MTF curve in the lower figure is the preferred measurement because
- MTF, and especially MTF50 or MTF50P, the spatial frequencies where contrast drops to half its low frequency or peak levels, correlate well with perceived image sharpness, and
- System MTF response is the product of the MTF of individual components. No such simple formula is available for edge responses.
SQF— Subjective Quality Factor is the best measurement of perceived print sharpness because it includes the contrast sensitivity of the human visual system, print size, and estimated viewing distance, in addition to MTF. Its importance will grow as it becomes more familiar. SQF is strongly affected by sharpening. Other numbers are available for evaluating lenses. The Secondary readout feature allows you to select (spatial frequency for) MTF at any level or MTF at a spatial frequency specified in Cycles/pixel, lp/mm, or lp/in. For example, you could use MTF30 (which results in a higher spatial frequency), or MTF at a fixed spatial frequency (as is done in manufacturer’s data sheets, which typically give contrast (MTF) at 10, 20, and 40 (or 10 and 30 line pairs/mm). If you do this you may want to scale the x-axis to cycles (i.e., line pairs) per mm instead of the default cycles/pixel. Remember, in evaluating lenses, use the results without standardized sharpening (the black curves and text). It’s best to uncheck the Standardized sharpening box. Results with standardized sharpening do, however, have some interest: they indicate what can be achieved after sharpening. But they tend to “flatten” differences between lenses.
Clipping can reduce the accuracy of calculations, though the amount of clipping is a poor indicator of the reduction in accuracy. Click here to learn more.
To learn more about sharpness measurements, see Sharpness: What is it and how is it measured?, SFR Tour, and SFR Results: MTF (Sharpness) plot.
| Chromatic Aberration is an important aspect of lens performance. CA is best measured on tangential edges near the borders of the image. The best measure of CA is the percentage of the distance from the image center. Interpretation: under 0.04; insignificant. 0.04-0.08: minor; 0.08-0.15: moderate; over 0.15: serious.For more information, see Chromatic Aberration and SFR Results: Chromatic Aberration … plot. |
 Chromatic Aberration display. Chromatic Aberration display. |
Checklist
License holders are encouraged to publish test results in printed publications, websites, and discussion forums, provided they include links to www. imatest.com. The use of the Imatest Logo is encouraged. However you may not use Imatest for advertising or product promotion without explicit permission from Imatest LLC. Contact us if you have questions. Imatest LLC assumes no legal liability for the contents of published reviews. If you plan to publish test results, you should take care to use good technique. This list summarizes the key points presented above. It’s well worth reviewing.
| Sturdy camera support | Use a sturdy tripod, cable release, and, if possible, mirror-lock. |
| Target mounting | If you are working outdoors, be sure the target doesn’t shake in the wind. |
| Target distance | Be sure you’re far enough fro the target so the printed edge quality doesn’t affect the measurements. Target distance considerations are given here. |
| Focus | Be sure the camera is focused accurately on the target. Note whether you used manual or automatic focus. |
| Target alignment | Make sure the corners, as well as the center, are in focus. |
| Raw conversion and settings | The choice of RAW converter (in or out of the camera) and settings, particularly Sharpening, can make a huge difference. Contrast and White balance are also important. Settings that affect contrast and transfer curve can also have a strong effect. If possible a “Linear” setting (meaning a straight gamma curve with no additional tonal response adjustments) should be used. |
| Gamma | SFR sharpness results are moderately sensitive to the Gamma setting: A 10% gamma error changes MTF50 by 2.5%. For best results gamma should be measured by running Colorcheck or Stepchart. Ideally a Q-14 target (similar to the Q-13, but larger) should be mounted close to the slanted edge images. |
| Cleanliness and filters | Lens surfaces should be clean. You should note whether you have a protective (UV or Skylight) filter. It can make a difference— more likely reduced contrast than reduced sharpness. With Imatest you can find out. |
| File formats | Use RAW or the highest JPEG quality. Never use less than the maximum resolution or JPEG quality unless you are specifically testing the effects of these settings. |
| Lens settings | Lens performance is a strong function of the aperture (f-stop) and focal length (for zooms). Be sure to record these settings (easy because they’re saved with the EXIF data) and include them in your writeup. The optimum (sharpest) aperture is of particular interest. Lens performance is also somewhat affected by the distance to the target. |
| White balance | Should be close as possible to neutral, particularly in Colorcheck. |
