
| Standard: | ISO 21550 — Photography— Electronic scanners for photographic images — Dynamic range measurements |
| Technical Committee: | ISO/TC 42 Photography |
| Published: | 2004-10 (This page revised 2022-10.) |
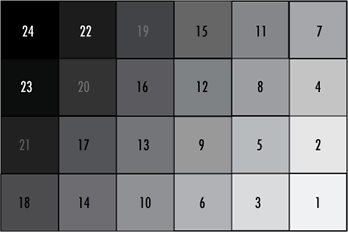 This tiny ISO 21550 chart for measuring dynamic range, printed on 35mm film and available from the Imatest Store, can be analyzed using the “general m x n“ option in Color/Tone Interactive or Color/Tone Auto (batch-capable, fixed UI).
The chart patch numbering order (shown on the right) is the inverse of the usual Imatest numbering order. Density reference files can be downloaded by clicking one of the the links below.
ISO-21550_0-4_reference (reference file for 0-4 Optical Density)
 ISO-21550_0-6_reference (reference file for 0-6 Optical Density) (no longer available)
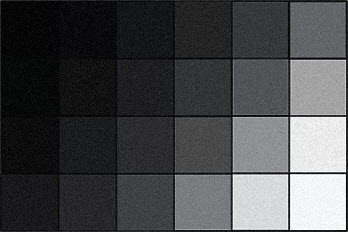
For the test on this page, we modified the Edmund Optics image to have more reasonable patch values, Then we ran the image. Click on the thumbnail on the right to download it.
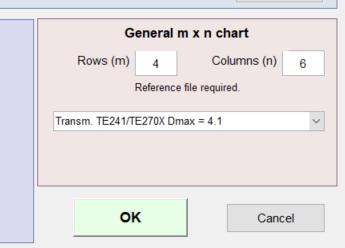
Open Color/Tone Interactive, then click on Settings… (on the right, below the center). The General m x n chart box is in the lower-right of the Settings window. Select Rows (m) = 4 and Columns (n) = 6.
 |
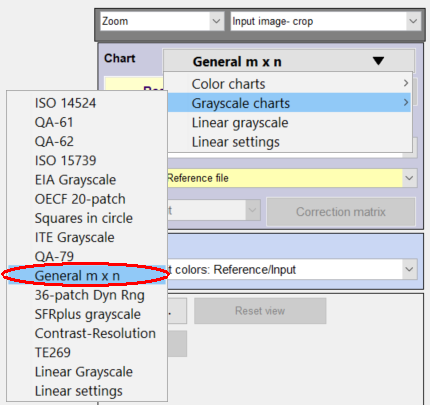 |
In the Chart dropdown menu, select Grayscale charts — General m x n. Then select the file to read. Manual region selection (coarse and fine) is required.
A density reference file is required for correct results. It can be entered using the dropdown menu to the right of Ref, shown below (highlighted in yellow).
The chart can be tested non-interactively (good for batch runs) with Color/Tone Auto. In the Color/Tone Auto section (of the classic UI), in the dropdown menu, press Grayscale charts — General m x n (identical to the Interactive version)n then select the file and select the regions. If you press Yes (not Express mode), you can make several key settings (m x n sizes and reference file). Details in Color/Tone Auto.
Density results
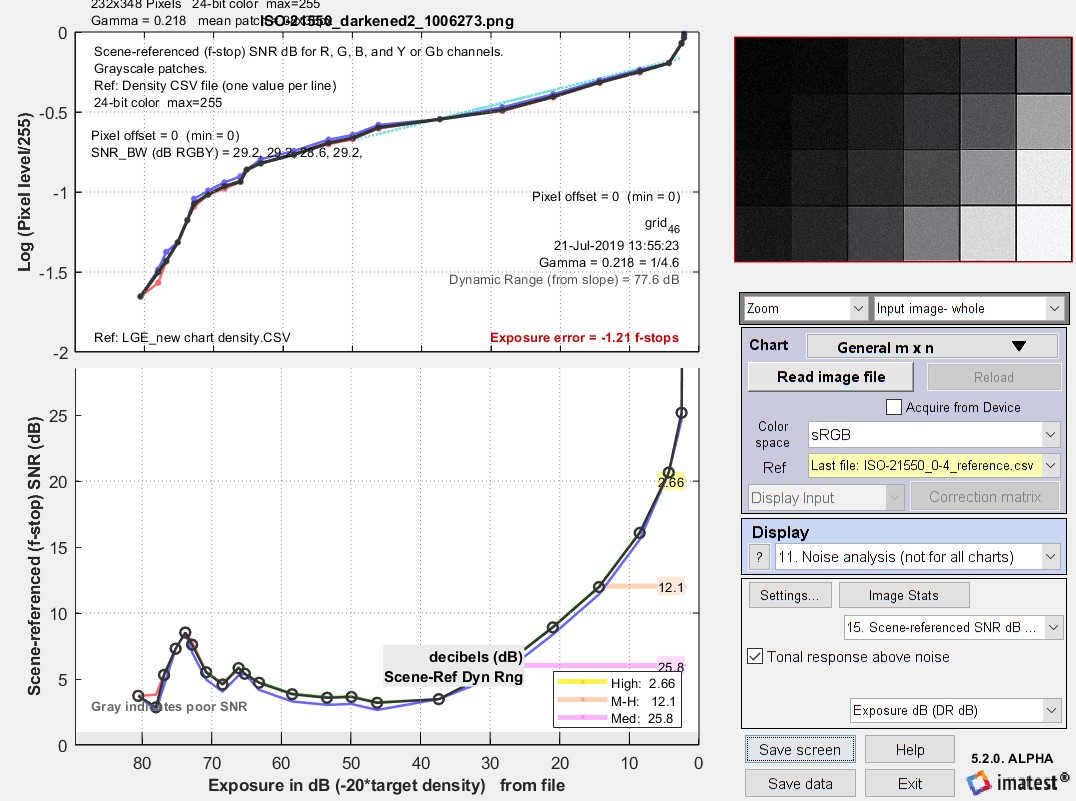
The figure below shows density response and noise. The lower plot had to be cropped slightly to remove some anomalous SNR values.
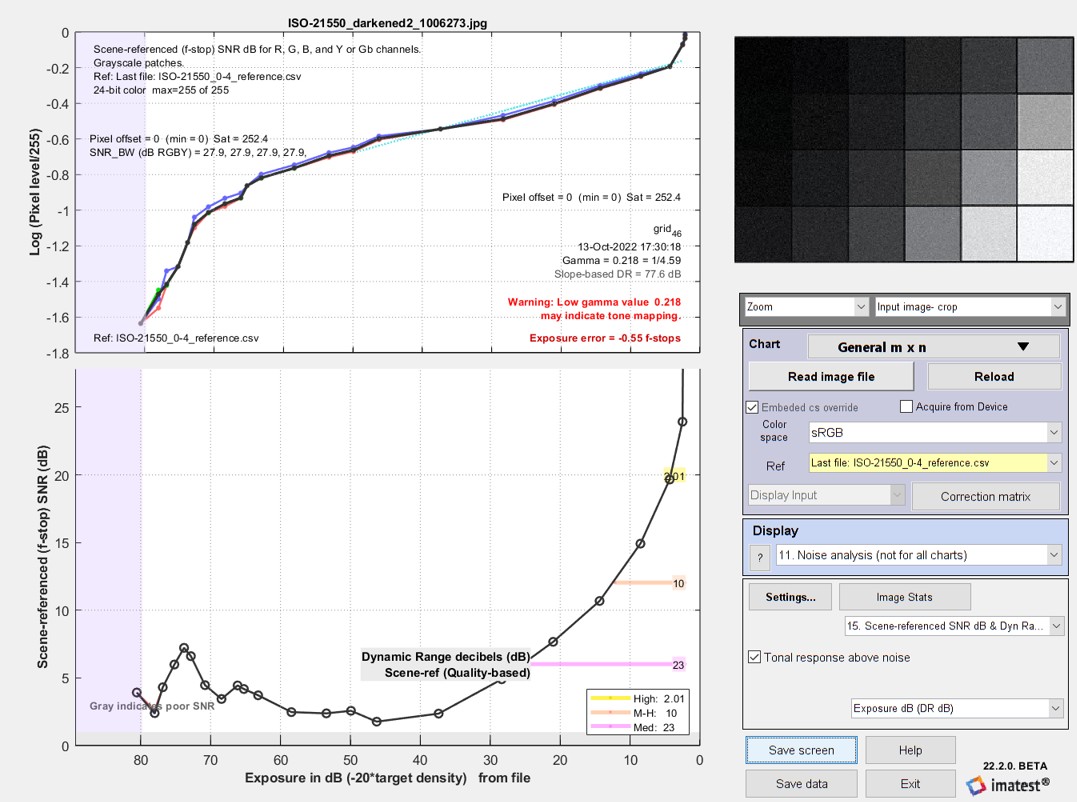
Density response and scene-referenced SNR, used to calculate Dynamic Range
Many types of noise, SNR, and Dynamic Range can be displayed using the the dropdown menu below Settings (set here to 15. Scene-referenced SNR dB). See Color/Tone/eSFR ISO Noise and Dynamic Range for details.