| Standard: | ISO 16505:2015 Road vehicles — Ergonomic and performance aspects of Camera Monitor Systems — Requirements and test procedures. |
| Technical Committee: | ISO/TC 22/SC 35 Lighting and visibility |
| Published: | 2015-05-01 |
Test Targets
ISO 16505 Test Targets are available for purchase on the Imatest Store.
Test Methods
Resolution
References ISO 12233:2014. Hyperbolic wedge features can be analyzed by the Wedge or eSFR ISO module. Slanted edge features can be analyzed by the SFR, SFRplus, eSFR ISO, SFRreg, or Chekerboard modules.
We presented a paper, “Measuring MTF with wedges: pitfalls and best practices” at the Multi-camera and Embedded Systems for Autonomous Machines session of the Electronic Imaging Conference in San Francisco on January 30, 2017. The paper focuses on difficulties with the ISO 16505 standard and how to overcome them— how to obtain good measurements despite ambiguities in the standard, which is in need of revision.
A key finding in the paper is that the primary resolution metric in ISO 16505, MTF10 derived from hyperbolic wedges, is not a reliable metric of system performance. A poor quality camera with high noise can have a good MTF10 measurement. We recommend replacing MTF10 with the minimum of {MTF10, the Nyquist frequency, and the onset of aliasing (the spatial frequency where the bar count starts decreasing)}.
According to the standard, the contrast of the hyperbolic wedge should be greater than 20:1 or 40:1 (depending on where you look), which is comparable to wedges used in the Imatest eSFR ISO chart.
The standard has some confusing and possibly erroneous statements on spatial frequency units.
- Imatest calculates spatial frequencies directly from the wedge geometry itself, and does not use the numeric markings next to the wedges in any of its calculations. These numbers are intended to be multiplied by 100 to obtain spatial frequency in Line Widths per Picture Height (LW/PH) if the image is framed so the top and bottom borders of the chart, which contain arrow marks (∇ and Δ), are at the exact edges of the frame, but charts are rarely framed this way in practice.
- The fundamental units used by Imatest to calculate spatial frequency response are cycles per pixel (C/P), where 1 cycle = 1 line pair = 2 line widths.
- Spatial frequency in Line Widths per Picture Height (LW/PH) is normally obtained by multiplying the C/P value by 2 * the Picture Height in pixels (typically the shortest dimension of the total picture).
- ISO 16505 specifies a hypothetical square region inside the image for calculating LW/PH spatial frequencies. If Lpx is the length in pixels of a side of the square, then you can use the simple equation, LW/PH = 2 * Lpx * C/P. The standard has many confusing statements involving units. This is most of what you need to know.
The units LW/PH can be selected in the settings windows, and a secondary readout of MTF10 can be selected to produce a compliant measurement.
Imatest’s view on ISO 16505ISO 16505 appears to have been developed in isolation from the ISO/TC42 technical committee (Photography). As a result of the isolation, several measurements may be inaccurate, even though they may be ISO 16505-compliant. Here are some key issues. The contrast in the slanted-edge resolution chart is much too high. High contrast can cause large measurement errors due to image saturation and clipping and make it difficult to operate within the camera’s linear region. This can result in unrealistically high MTF measurements, as described here and here. These problems are why the recommended contrast in ISO 12233 charts was set to 4:1. The slanted-edge chart is also not designed for automatic region detection. The grayscale chart is redundant. There are many well-established charts that serve the same purpose, like ISO 14524, ISO 15739, a variety of 20-patch OECF charts, the grayscale pattern in the eSFR ISO chart, and more. For this reason, we recommend the eSFR ISO chart, which measures multiple image quality factors and has automatic ROI detection, for resolution, tone, and noise measurements, unless strict ISO 16505 compliance is required. |
Magnification
The ISO 16505 requires magnification to be mapped as a function of field distance. Imatest currently computes optical distortion as a function of field distance, but does not yet convert this into a magnification output.
Camera Monitor System (CMS) sharpness spatial frequency units
The spatial frequency units for MTF (sharpness) measurements in the ISO 16505 standard are very confusing. Although we haven’t fully addressed this issue (as of May 2017) we have recently published a page on how to determine spatial frequency units for calculating the MTF of camera monitor systems. These units (both Line Widths per (effective) Picture Height) allow the sharpness of the image inside the CMS (the output of the camera/input to the monitor) to be compared directly with the image taken of the monitor by a second camera. See Camera Monitor Systems (in the Solutions section).
Aspect Ratio
The standard refers to aspect ratio across the field, and where that aspect ratio is at a minimum value. Imatest does not currently consider aspect ratio as a function of field distance and instead computes an overall aspect ratio.
Using 16505 charts with Imatest
Slanted Edges
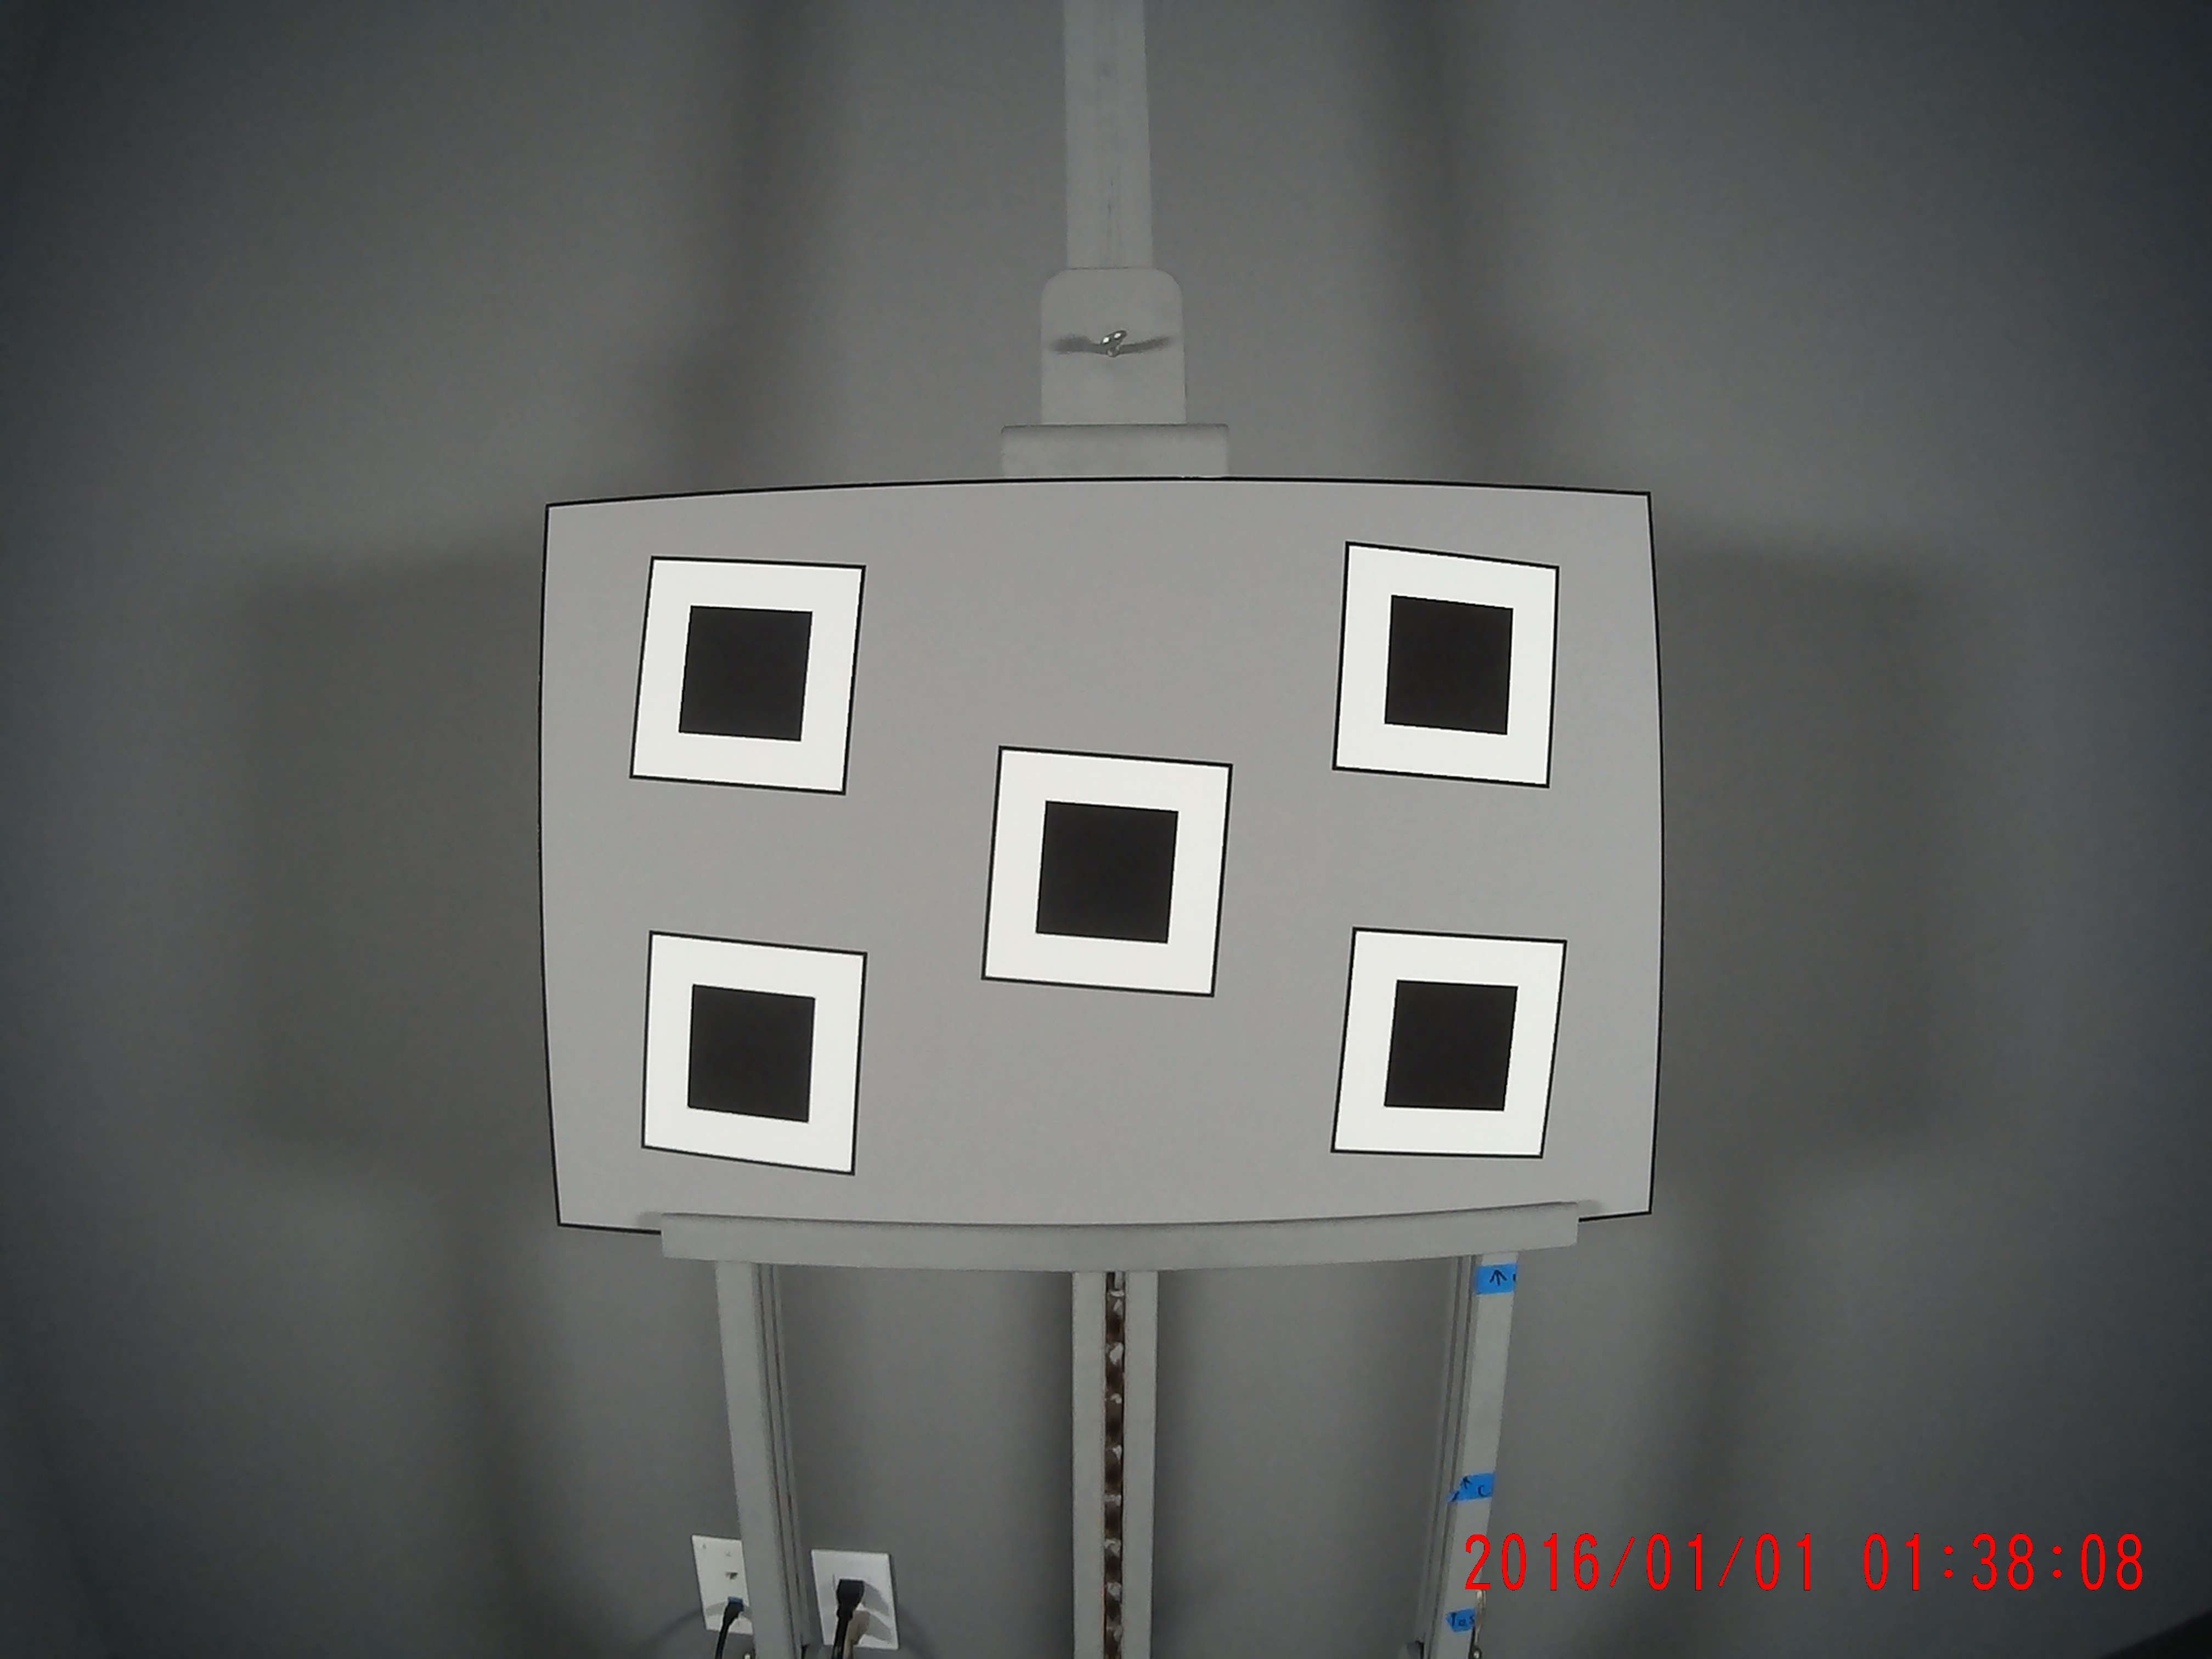
The slanted edge SFR chart (SKU: ISO-16505-SFR) as seen in 7.8.5.1 of the ISO-16505 standard is pictured above.
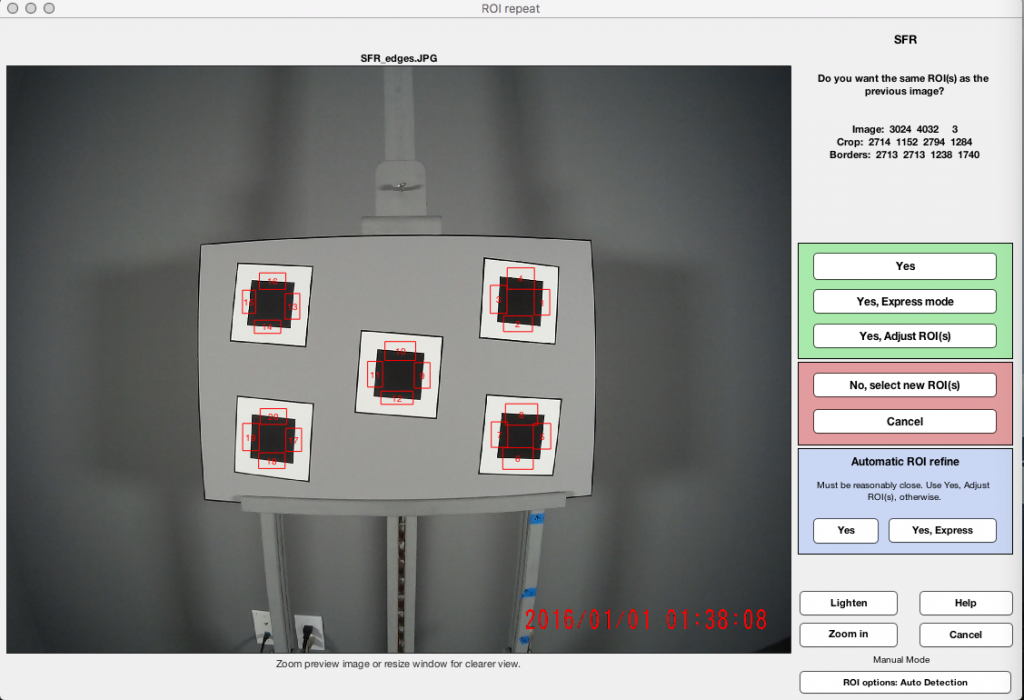
Start Imatest and select the SFR module. Select the image file, “SFR_edges.jpg” in this case. After the image is loaded, select the appropriate Regions of Interest (ROIs). This particular chart has 20 edges that can be used for a slanted-edge SFR measurement. After the initial ROI selection, Imatest will save these regions for repeat runs on our image. Left is the preview of the 20 regions we have selected.
Next we will click “Yes” to continue to the SFR Settings window. More information on the settings for SFR tests can be found in a separate post, “Using SFR part 2: Running Imatest SFR”. For this test we will make sure we measure the MTF50 as mentioned in 7.8.5.1. Once the desired settings are input, we click “OK” to begin the analysis.
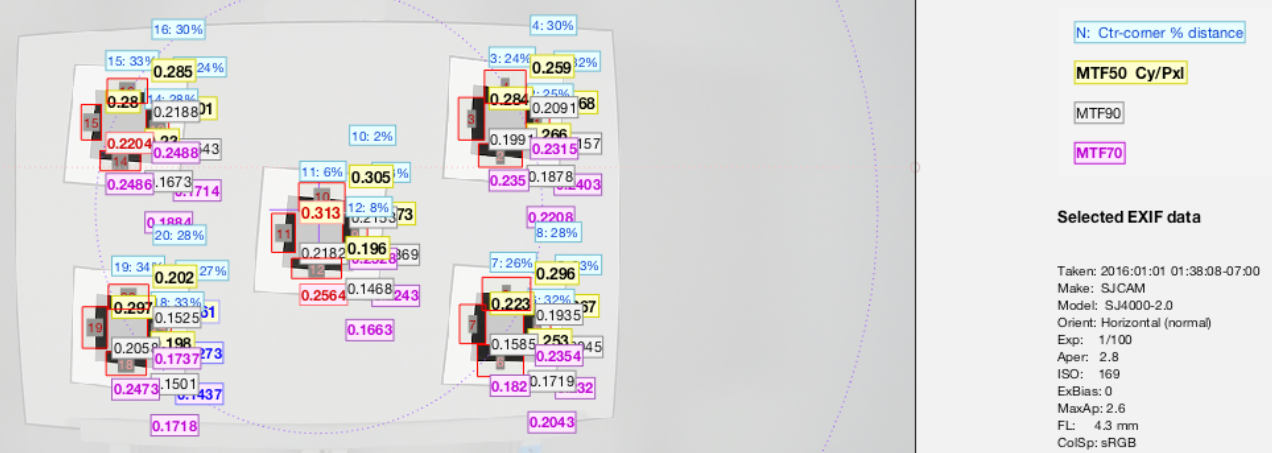 Crop of Multi-ROI results
Results will appear for each region as well as the option to save relevant results in the desired output format such as .json or .csv files. The Multi ROI results show a summary of all the regions as well as providing a weighted mean for all of the metrics as seen above.
Grayscale
|
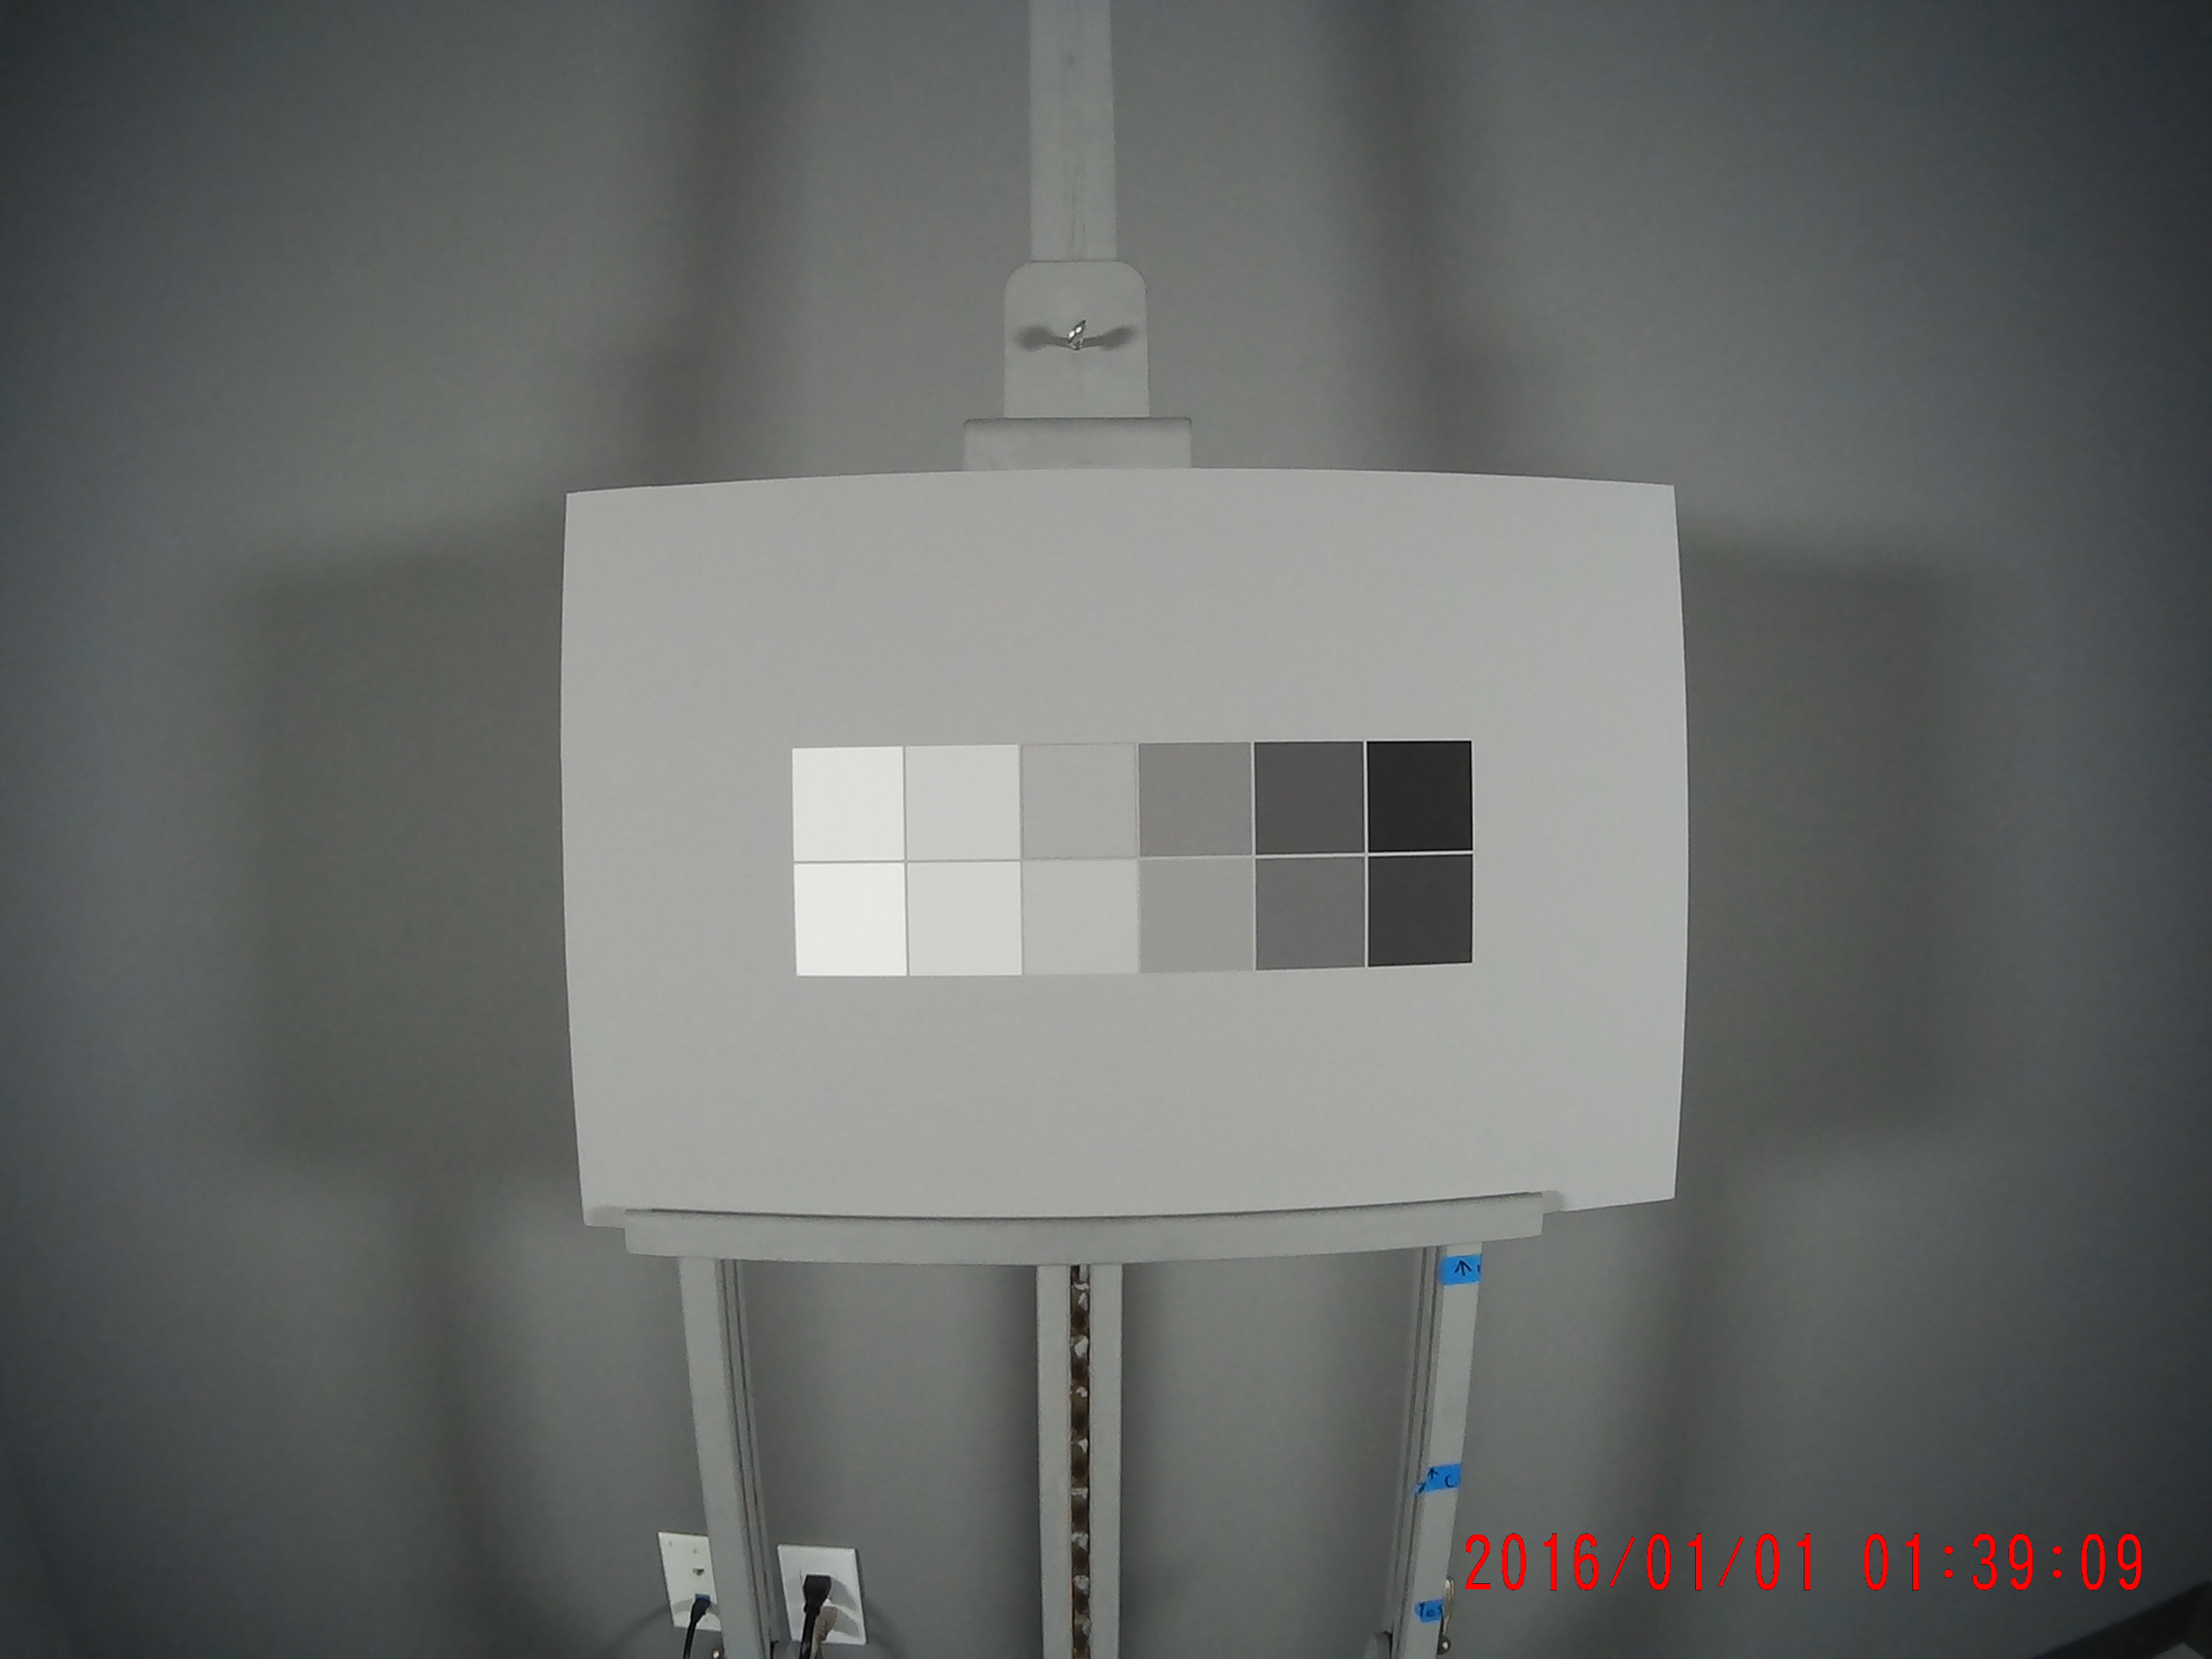
The stepchart (SKU: ISO-16505-Grayscale) can be analyzed by Imatest’s Color/Tone (Interactive or Auto).
select the grayscale image file (shown above), Imatest prompts us for a region selection. We then select a region containing all of the patches. |
Reference file The twelve lines below are the densities for the chart shown on the left, oriented so the lightest patches are on the left. Copy the twelve lines below to a text editor, then save them in a text file in a convenient location so the file can be entered in the Settings windows. .18 |
The ROI Fine Adjustment Window will appear, allowing you to make fine adjustments on the ROIs. 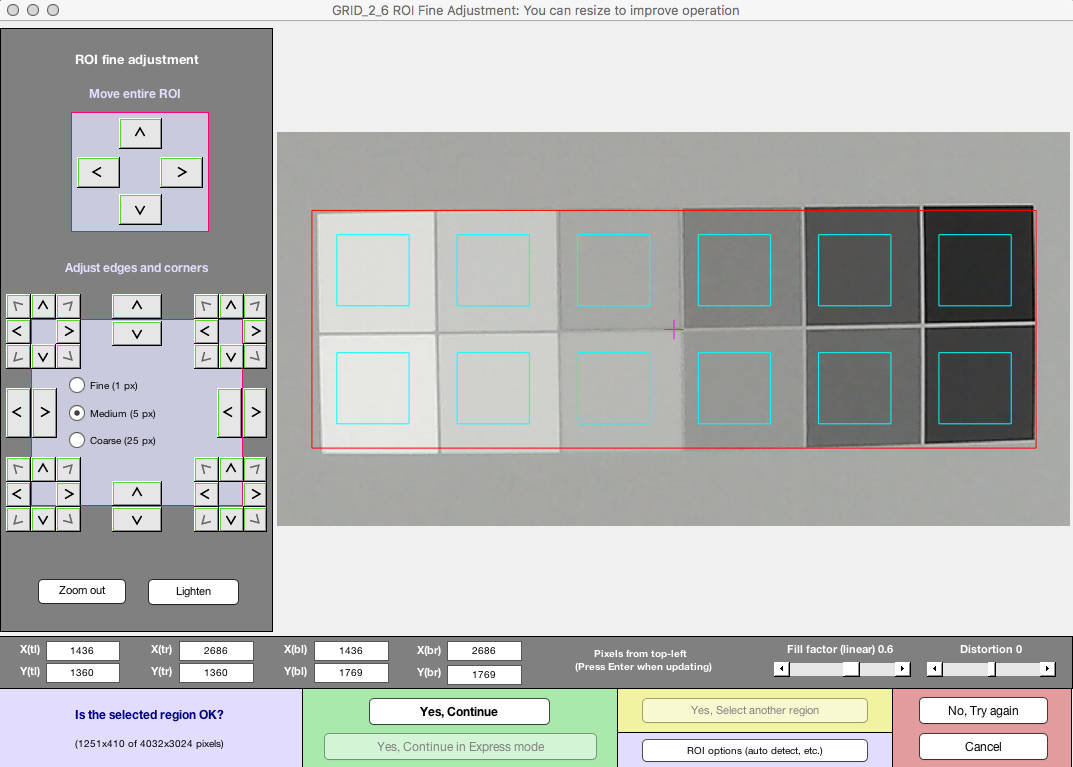
Next, click “Yes, Continue” to begin the analysis. Several figures will displayed with results determined by the settings. The results can be saved in the desired output formats. Here is an example of a result from Color/Tone Interactive.
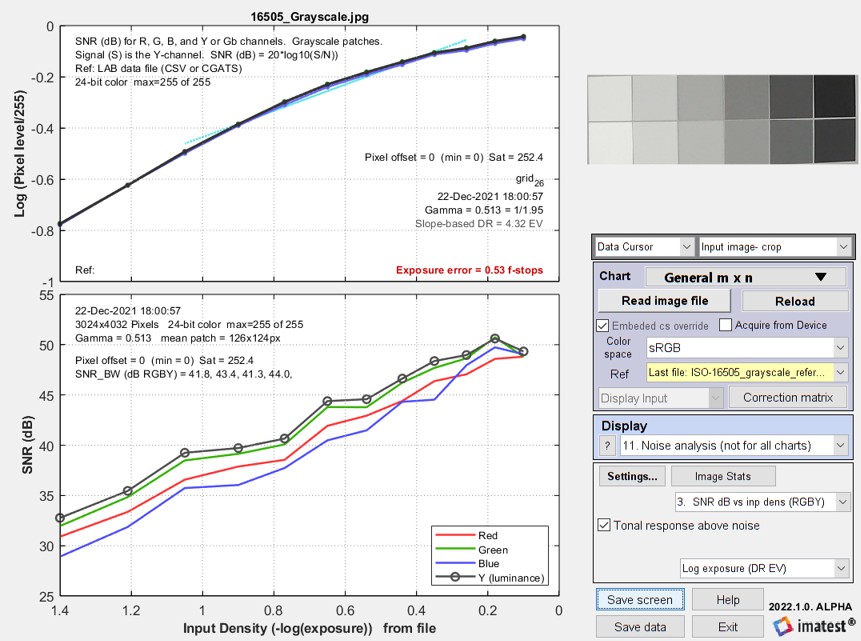 Color/Tone Interactive results showing pixel response and SNR
Checkerboard
The checkerboard (chessboard) (SKU: ISO-16505-CB) can be analysed in Imatest’s Checkerboard module. You can read more about best practices using the Checkerboard module here.
Select the Checkerboard Setup button after starting Imatest. Imatest can perform SFR measurements on all of the detected edges in the checkerboard as well as giving distortion metrics. (Note: This chart could be used to replace the Slanted Edge chart as it provides the same SFR measurement with the added distortion data).
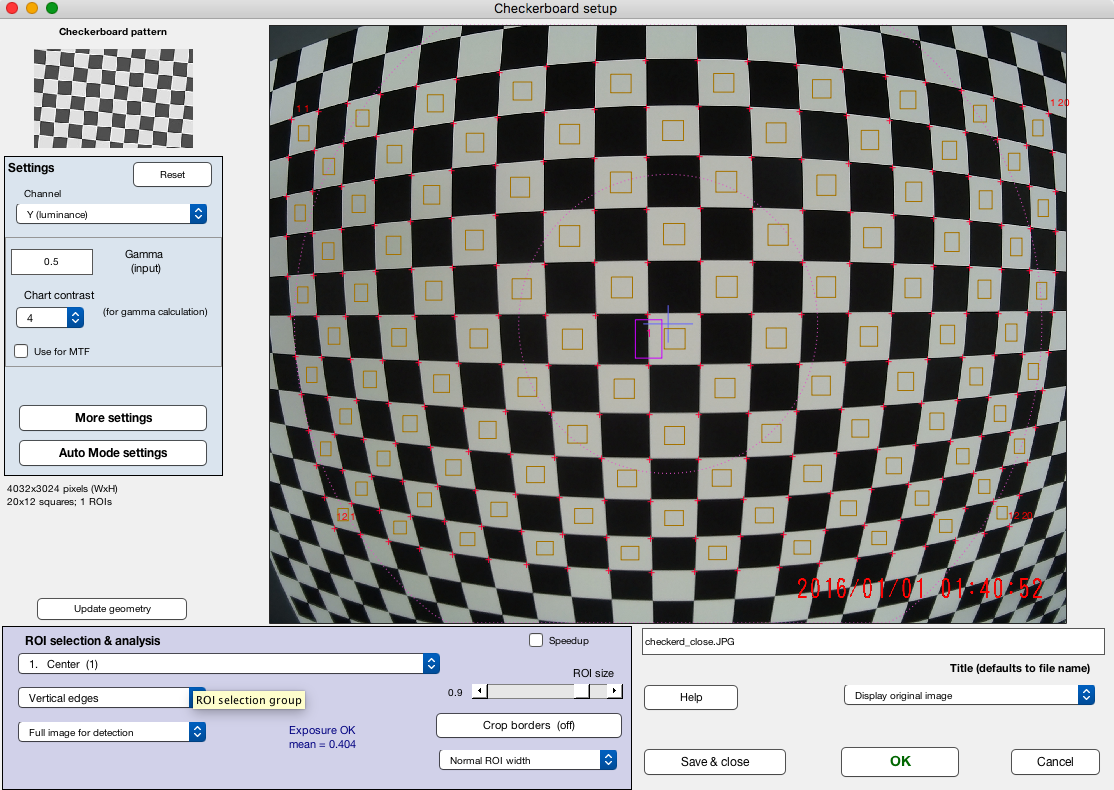
In the Setup dialog, select “1 . Center” In the ROI selection & Analysis section. This will be the quickest option for outputting the distortion information.
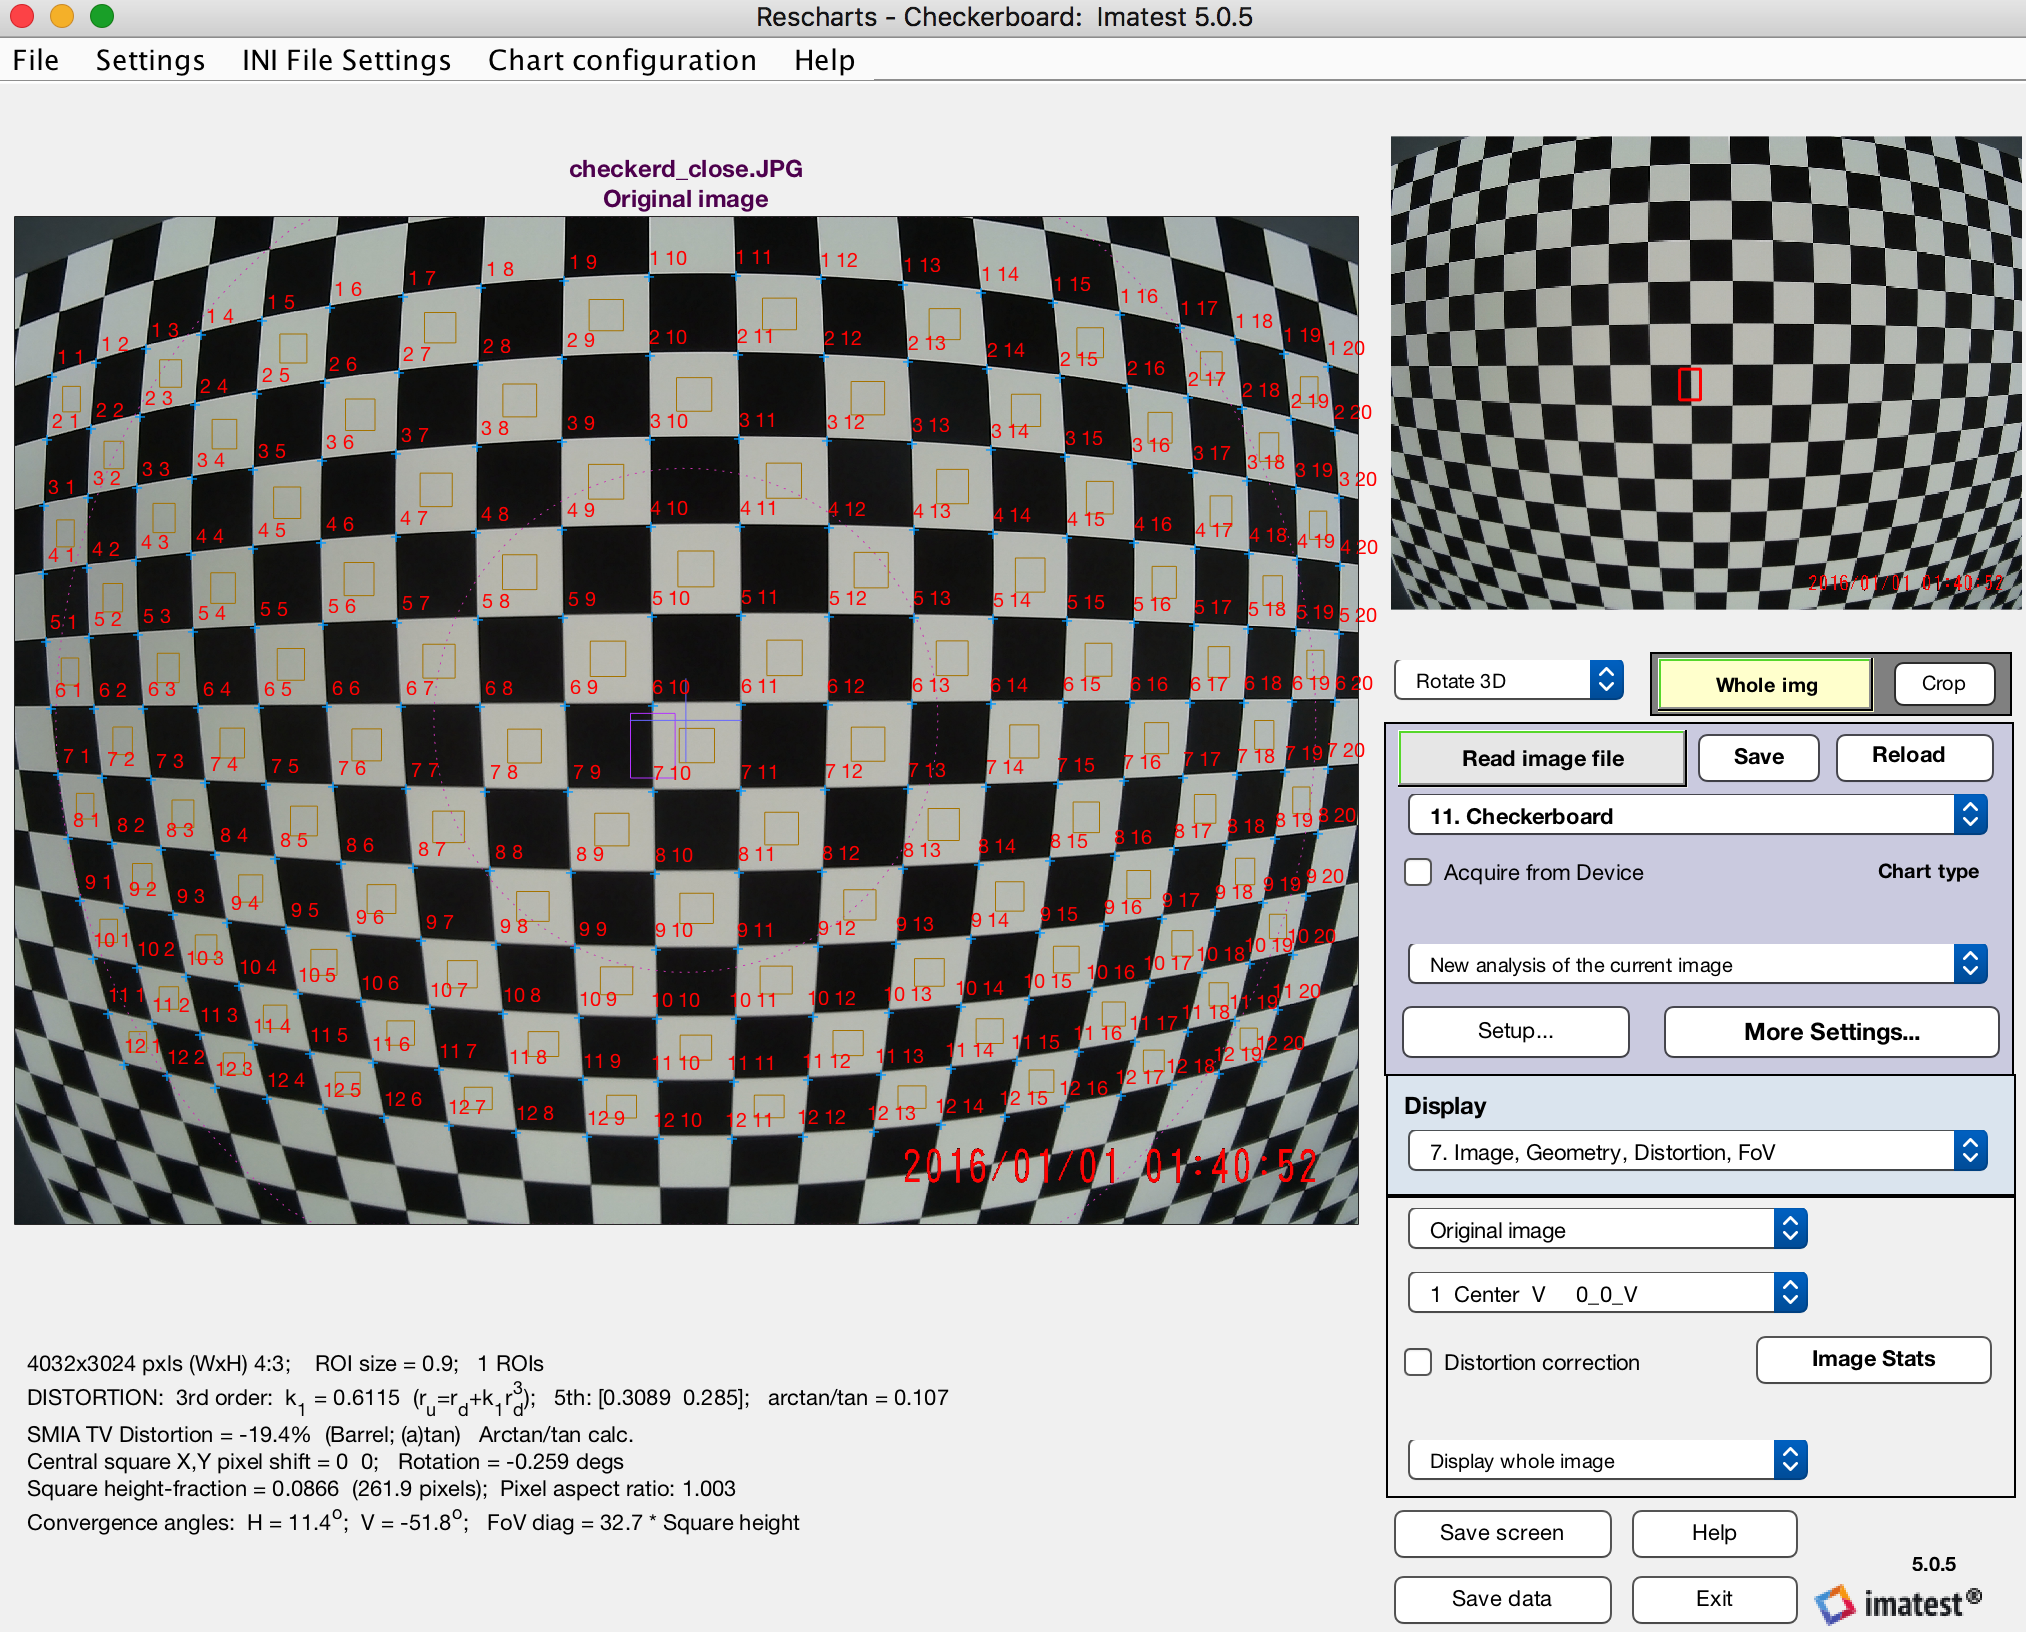
Click “OK” to begin the analysis. In the results window, select “7. Image, Geometry, Distortion, Fov” for the Display option. The relevant distortion information in the bottom left of the window. See below:
Color
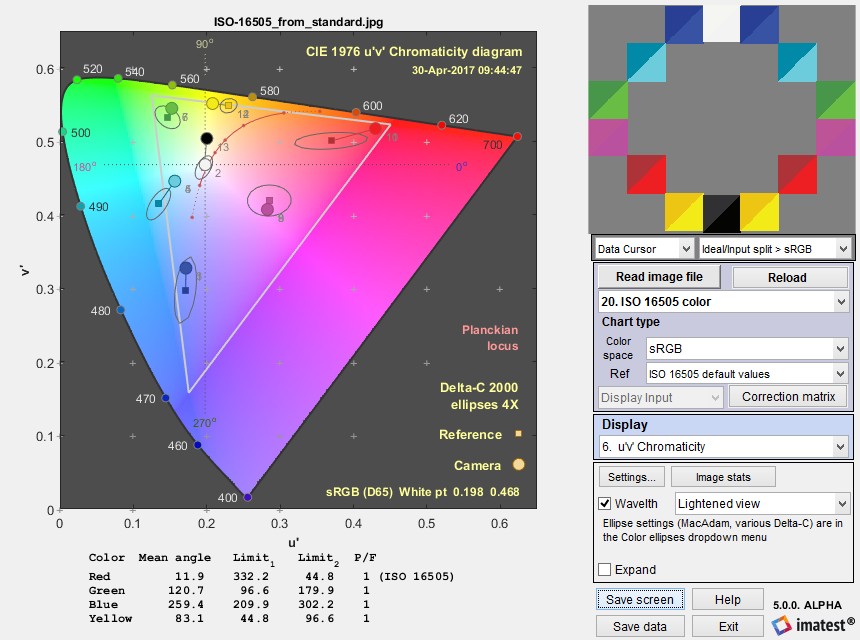
The ISO-16505 color chart can be analyzed in Multicharts and Multitest in Imatest 5.0+. The uv color angle in degrees and also the Pass/Fail limits (from section 6.9.3 and Figure 21 of the standard) and P/F indicator (0 or 1 for F or P) are displayed (only for the ISO-16505 color chart). Results are saved in the JSON and CSV output files. An example is shown on the right.
Multicharts uv results for the ISO 16505 color
chart. Click on the image to view full-sized.
Timing
There is currently no calculation of system latency produced by Imatest.