
For additional details about the initiative, see this presentation assembled by former committee chair Margaret Belska.
Imatest’s CPIQ Implementation
Imatest 4.4+ supports IEEE CPIQ P1858TM (Camera Phone Image Quality) 2016 measurements. As members of CPIQ, we are strongly committed to providing convenient CPIQ-compliant and equivalent image quality measurements.
NOTE: You should use at least Imatest 4.4.9 for the latest corrections to visual noise calculations.
This page has similar order to chapters the CPIQ Standard, “P1858TM/D1 Standard for Camera Phone Image Quality“ document. The first four chapters are 1. Overview, 2. Normative references, 3. Definitions, acronyms, and abbreviations, and 4. Test conditions and apparatus. Measurement chapters are:
5. Spatial Frequency Response (SFR)
6. Lateral Chromatic Displacement
7. Chroma Level
8. Color Uniformity
9. Local geometric distortion
10. Visual noise
11. Texture blur
12. Auto Exposure
For each of these sections we will discuss charts, measurement techniques, and (perceptual) Quality Level results. The last section on this page lists the JSON output locations for all CPIQ metrics.
Test Lab Environment
Current draft requirements (to be approved) for a IEEE certified test lab are as follows:
Charts
- Dot Pattern chart (Measures distortion and chromatic displacement)
- ESFR-ISO chart – SFR and visual noise
- Colorchecker SG – chroma level
- Spilled Coins/Dead Leaves chart – Measures texture acutance
- Blank 18% gray chart (Measures color uniformity, this could be a wall painted with an ~18% gray paint)
Lighting
All lighting must be able to achieve at least 80% uniformity across the largest chart (e.g. no more than 20% deviation from center to corner)
The following illuminants:
- 3050k Incandescent tungsten illuminant at 25 lux
- D55 illuminant at 1000 lux
- TL84 illuminant at 100 lux
Environment
- Temperature must be 23C +/- 2C
- Room should be set up to reduce reflections and prevent stray light from entering the scene. Ideally, the walls should be painted with a low-reflection, low-chroma paint such as ~18% gray or black
- Room should be light-tight so no outside light sources could affect measurements
Spatial Frequency Response (SFR) – Chapter 5
Chapter 5 of the CPIQ document describes slanted-edge SFR (MTF) measurements. It includes Acutance, which is a perceptual measurement of sharpness, derived from MTF and the human visual system’s Contrast Sensitivity Function (CSF).
For measuring SFR in compliance with CPIQ, we recommend the eSFR ISO chart. eSFR ISO has sufficient slanted-edges to map sharpness over the image surface, has a grayscale OECF chart that can be used for the Visual noise measurement, and is fully compliant with the chart requirements of the ISO 12233:2014 standard.
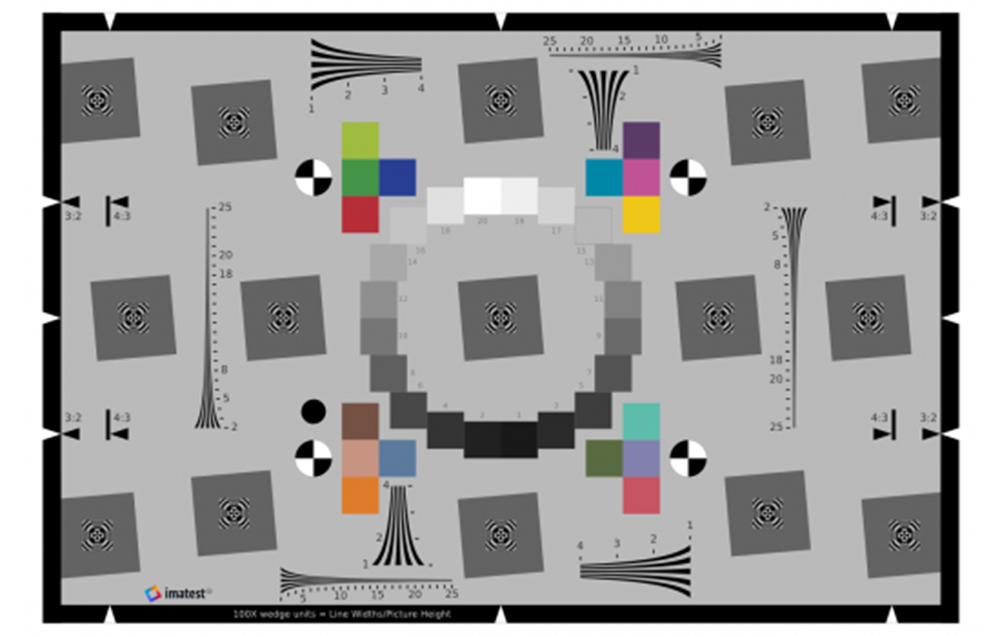 Enhanced eSFR ISO chart Enhanced eSFR ISO chart |
For CPIQ, sharpness is measured as Spatial frequency response (SFR) (also called Modulation Transfer Function (MTF)). The eSFR ISO module can be used for this purpose.
Acutance is a perceptual measurement designed to answer the question, “how sharp does the image look?” It is closely related to Subjective Quality Factor (SQF), differing only in the details of the equation. It is calculated from MTF (SFR), a model of the human visual system Contrast Sensitivity Function (CSF), and viewing conditions (image height and viewing distance). Imatest displays it in exactly the same way as SQF, which provides many of options. To obtain Acutance measurements, open eSFR ISO (or other Rescharts module), then click on the button in the Settings window (More settings in SFRplus). Click on the button to select the acutance calculation. Plot type can be SQF or Acutance (standard plot) or JND (Just Noticeable Difference: CPIQ Phase 2 equation. You’ll have to make some assumption on the viewing conditions. See SQF/Acutance for details.
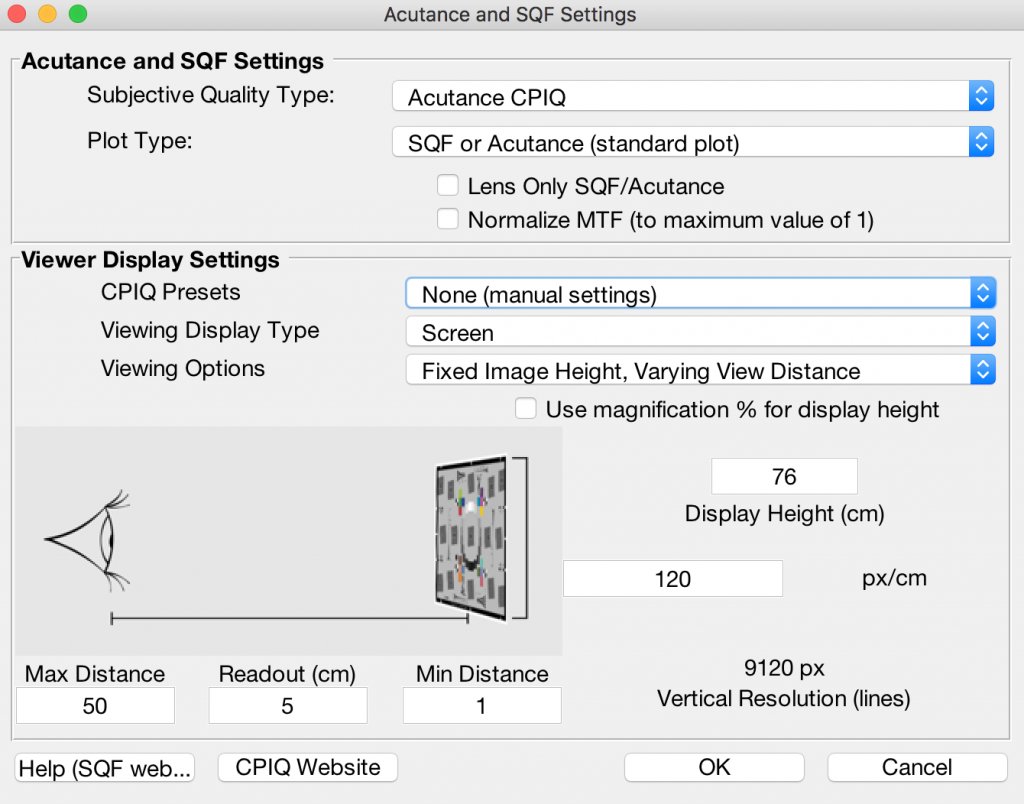
SQF/Acutance settings window
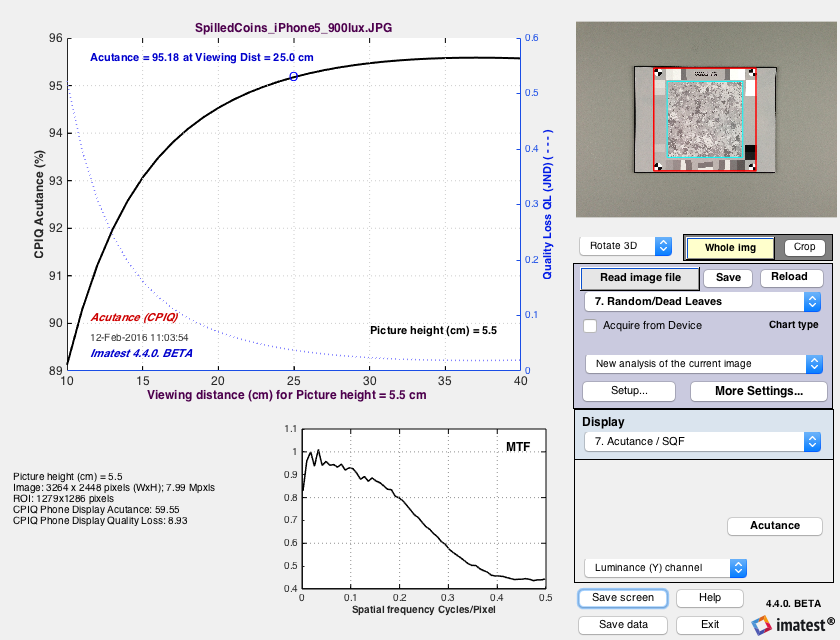
Here are results from the eSFR ISO module display #3. We have assumed that viewing distance is proportional to the square root of the print height.
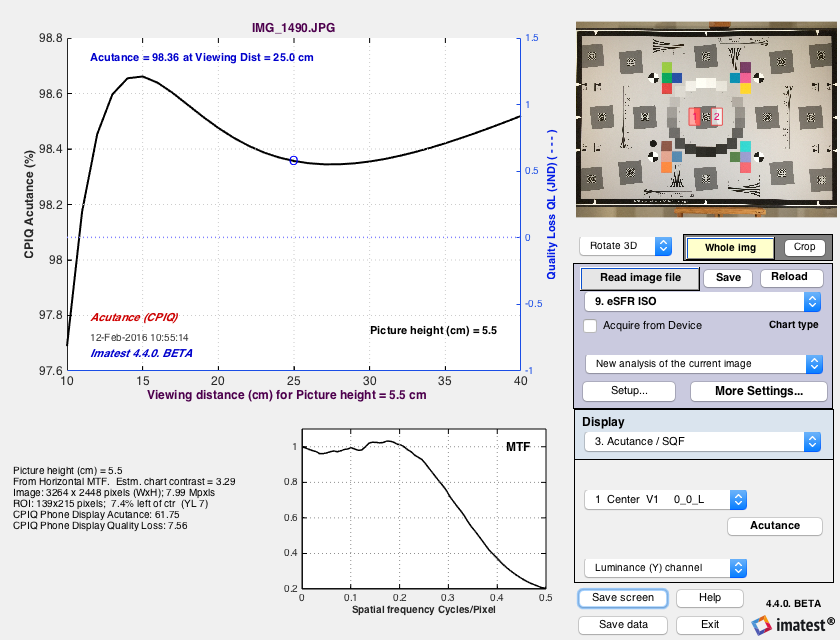
Acutance results for viewing distance = 20*sqrt(PH/10) or 25 cm, whichever is larger for Picture height from 10 to 40 cm
Lateral Chromatic Displacement – Chapter 6
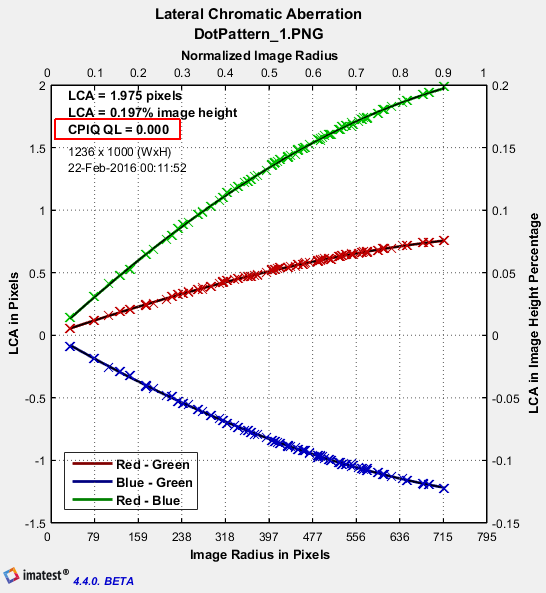
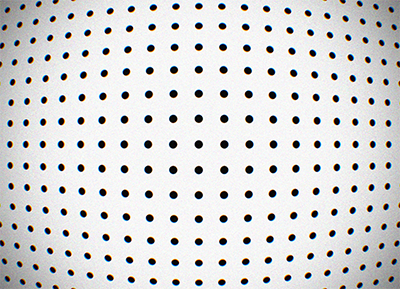
Lateral Chromatic displacement is also known as Lateral Chromatic Aberration. Often this is characterized using a tangential slanted edge, but the CPIQ standard obtains a much more detailed measurement through use of the dot pattern test chart:
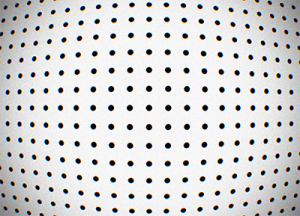 An image of the dot pattern test chart is analyzed using the dot pattern module of Imatest.
Chroma Level – Chapter 7
|
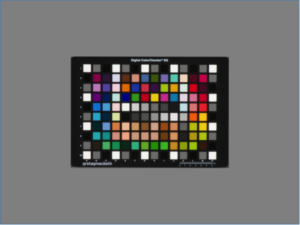
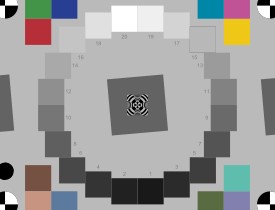
The Chroma level (Saturation) test uses the X-Rite Digital Colorchecker SG chart, shown properly framed on the right. (The chart should not fill the image. If it does, light falloff may reduce accuracy of the results.) The measurement uses only the chromatic patches: it omits the black, white, and grayscale patches near the edges and center of the chart. The Colorchecker SG is analyzed using the Color/Tone Interactive (interactive) or Color/Tone (fixed) modules. The regions selection must be manually set so that the analysis regions are properly aligned with the test chart patches.
|
 |
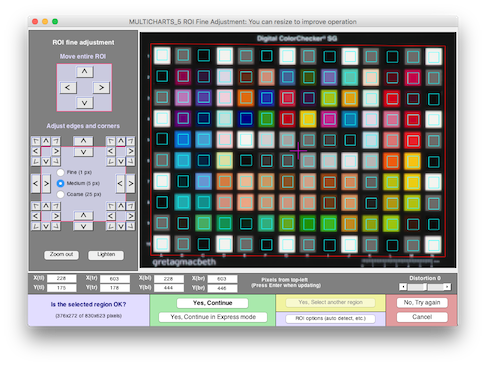 Color/Tone Interactive fine adjustment window for Colorchecker SG
The mean CPIQ chroma and quality level results are shown in the 2D a*b* plot. This figure shows a*b* values (from CIELAB color space) for patches for the 4 row x 6 column Colorchecker replica, just above the chart center (rows 2-5 from the top; columns 5-10).
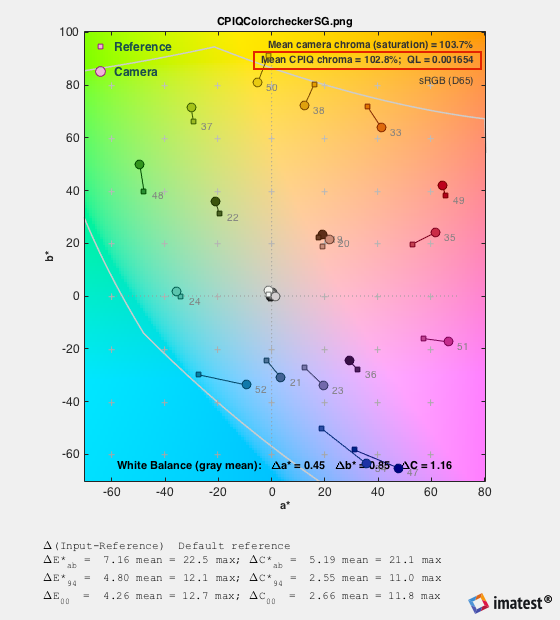 a*b* reference and camera colors for the 24-patch Colorchecker Classic replica inside the Colorchecker SG, showing the mean CPIQ Chroma metric (measured on all chromatic patches).
Color Uniformity – Chapter 8
The CPIQ color variability metric, maximum ΔC = Dc, is displayed in Uniformity, Uniformity-Interactive, and Blemish Detect when Grid size is set to 20×15 for a 4:3 aspect ratio, 24×16 for a 3:2 aspect ratio, or 32×18 for a 16:9 aspect ratio and Grid calculation is set to 2. Delta-C and Delta-E. Delta-C and Delta-E are calculated for each grid region i by comparing L*a*b* values in the region with the mean for the image as a whole). It is calculated and saved in the JSON and CSV output whenever the CPIQ calculation box is checked. Here is an example of the settings.
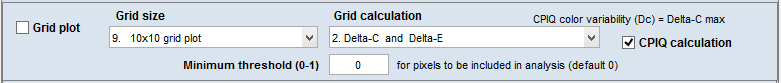 Grid plot settings for CPIQ color variability metric Dc
Here is the resulting grid plot.

Uniformity (or Uniformity-Interactive) 15×20 grid plot for ΔC and ΔE
The CPIQ color uniformity metric is displayed on the lower-right: Maximum ΔC = 2.606 is the CPIQ metric of color variability. The Quality loss associated with this metric is
QL = subjective quality loss in JNDs for color uniformity = 0; Dc ≤ 0.8636 \( = \frac{(D_c – a)}{b} – \frac{c \ln \bigl( 1 + \frac{b(D_c – a)}{c}\bigr)}{b^2}\); Dc > 0.8636
where a = 0.8636, b = 2.3952, c = 0.9771
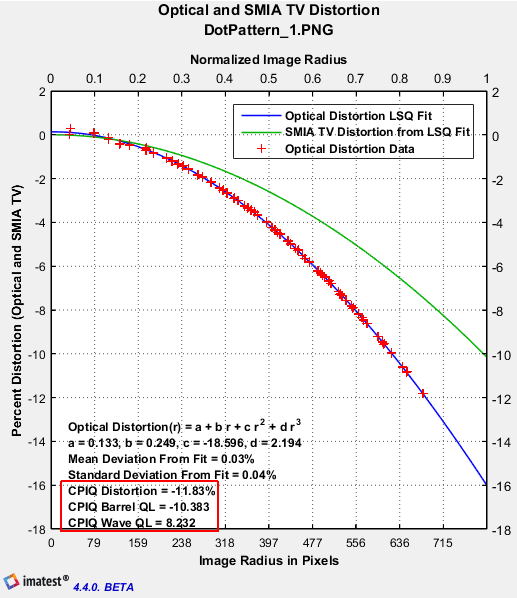
Local Geometric Distortion – Chapter 9
Lens distortion is measured by photographing a dot pattern chart and analyzing it with the Dot Pattern module.
The image on the left, below shows Lateral Chromatic Aberration as a function of image radius in pixels. The image on the right,below shows optical and SMIA TV distortion.
Visual Noise – Chapter 10
You should use at least Imatest 4.4.9 for the latest corrections to visual noise calculations.
Visual noise can be calculated from a test chart that includes a ISO 14524 radial tonal patches (step wedge). We recommend using the ISO 12233:2014 test chart which includes this feature.
The calculations can be performed by the eSFR ISO, Color/Tone Interactive, or Color/Tone modules. Details are given in Color/Tone Interactive/Color/Tone/eSFR ISO noise measurements: ISO 15739 and CPIQ Visual noise
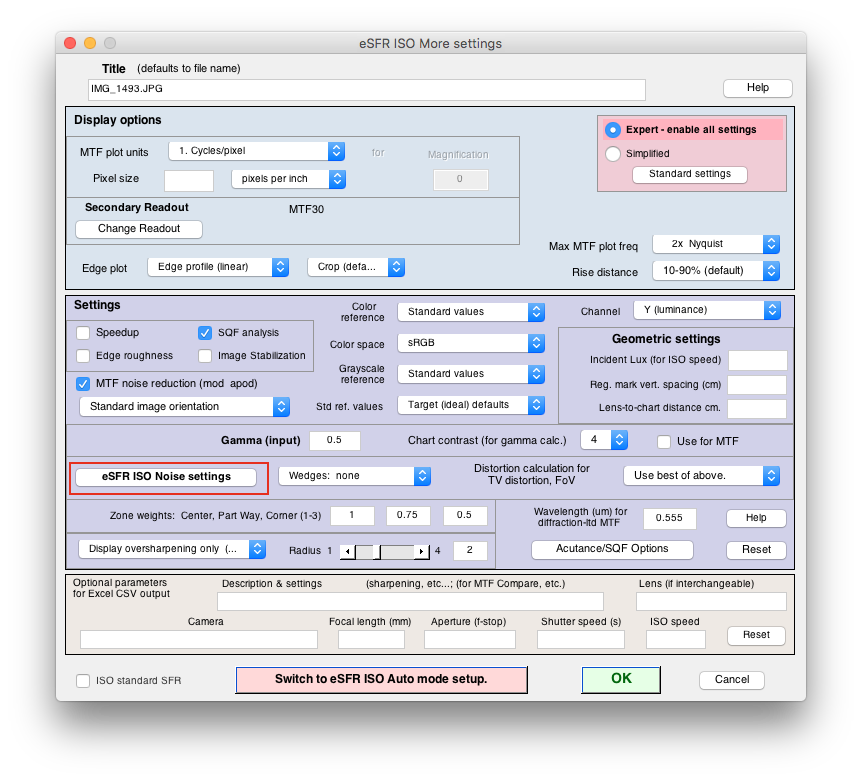
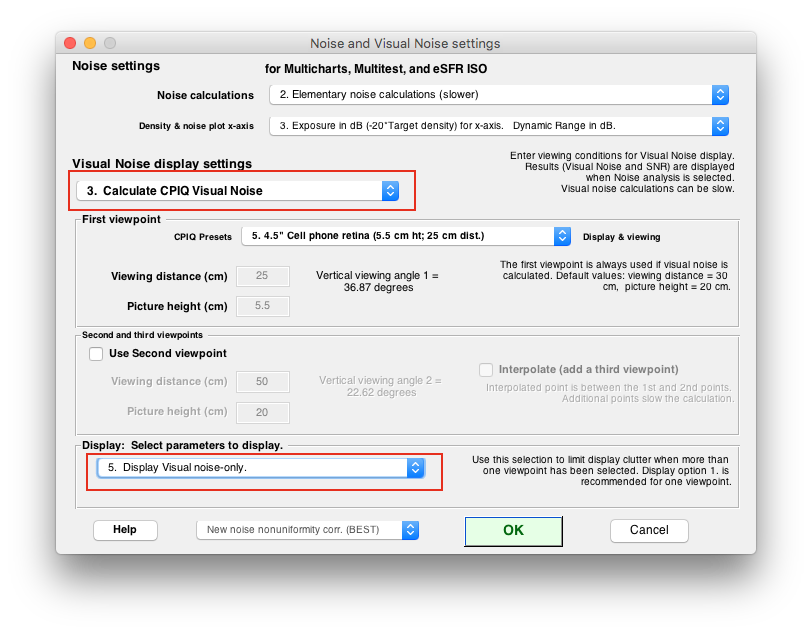
Here are the settings for the eSFR ISO module:
The displays are available
22. CPIQ Visual noise vs. input density (L*a*b*)
23. CPIQ Visual S/N vs. input density (L*a*b*)
24. CPIQ Visual SNR (dB) vs. input density (L*a*b*
Here are the results: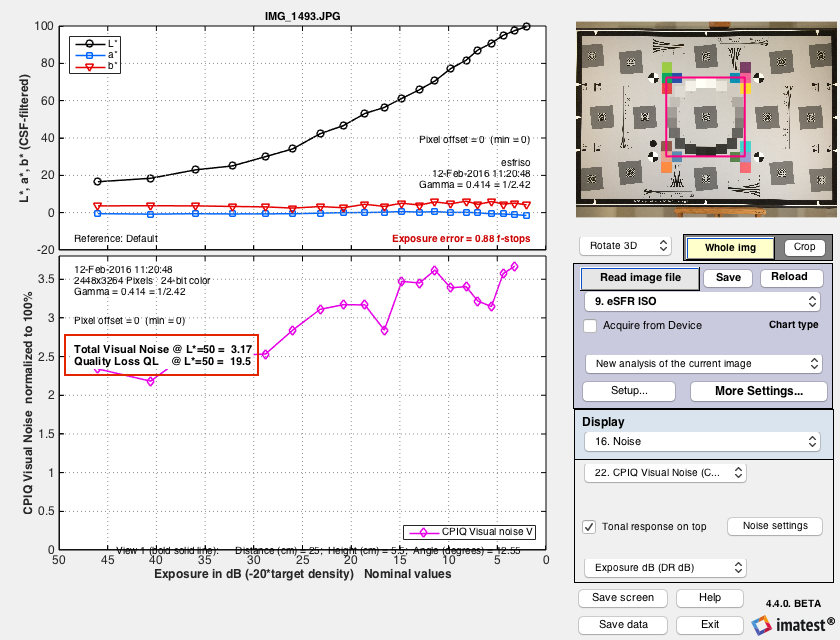
Texture Blur – Chapter 11
The CPIQ Phase 2 “Initial work on texture Metric” document calls for an analysis of the “Dead Leaves” pattern but provides little detail about how the results are to be displayed. It mentions Noise Power Spectrum (NPS), which is also called the Power Spectral Density (PSD). PSD is the square of the MTF.
Imatest has introduced a new version of the Dead Leaves chart, called the Spilled Coins chart, that has several advantages over existing Dead Leaves charts.
- It is almost perfectly scale-invariant, i.e., results do not depend on magnification, and an MTF exponent of -1 (Power Spectral Density of -2) accurately characterizes the chart.
- It is more uniform than existing charts.
- The gray areas to the left and right of the chart have the same average density as the active area, making them suitable for calculating noise PSD to be subtracted from the PSD of the central “spilled coins” area.
- It contains slanted-edges for comparing MTF calculations.
The Dead Leaves or Spilled Coins pattern is typically framed so it takes up about 1/3 of the image linearly (about 1/10 by area). This number may be vary depending on the chart design and the pixel size of the image (the pattern will require more space in low-resolution images such as VGA). More details on Random/Dead Leaves. The chart is available in several configurations from the Imatest Store.
 chart") The Imatest Spilled Coins chart (Black & White version)
The Imatest Spilled Coins chart (Black & White version)
The MTF or PSD of Dead Leaves images can be measured by the Imatest Random module (a part of Rescharts). This module was designed for random (or near-random) patterns with a 1/f spatial frequency response, which is equivalent to 1/f 2 Power Spectral Density (PSD). Such patterns are scale-invariant, i.e., its spectrum is independent of magnification; it isn’t affected by changing distance from the chart. This makes extremely convenient for measurements.
The PSD exponent of the Spilled Coins chart is different from the PSD (i.e., NPS) of the Dead Leaves target shown in Figure 4. It is -2 (i.e., scale-invariant, which is the ideal value) rather than -1.86 . We show a few results below. Full details are on Random/Dead Leaves.
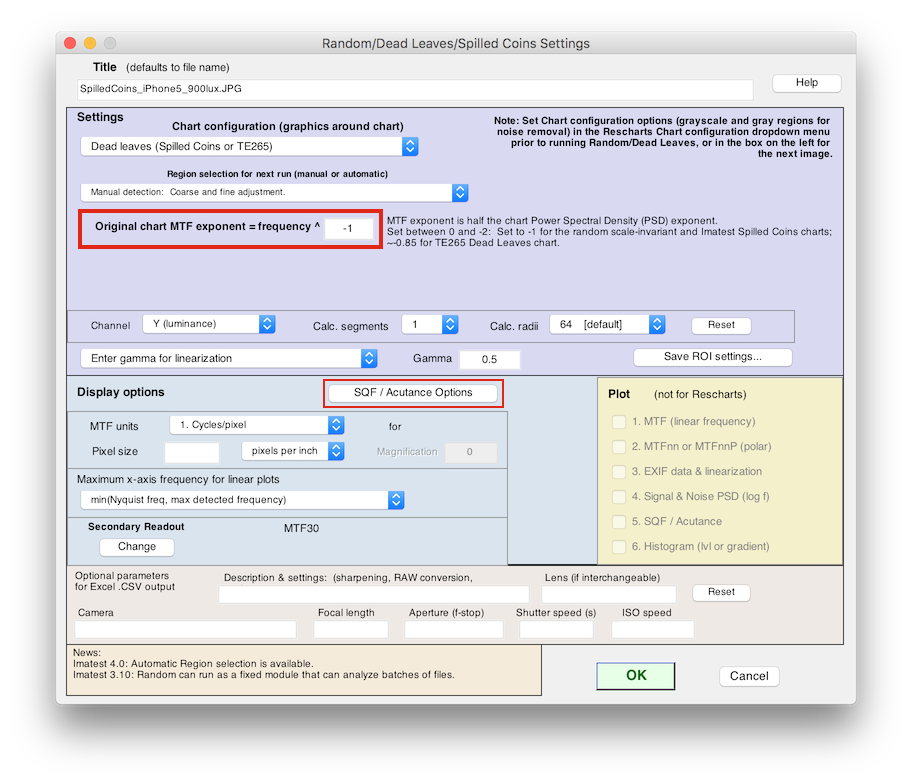
Random/Dead Leaves Settings window. Exponent set to -1 (for PSD = -2)
Results are available in plot #7:
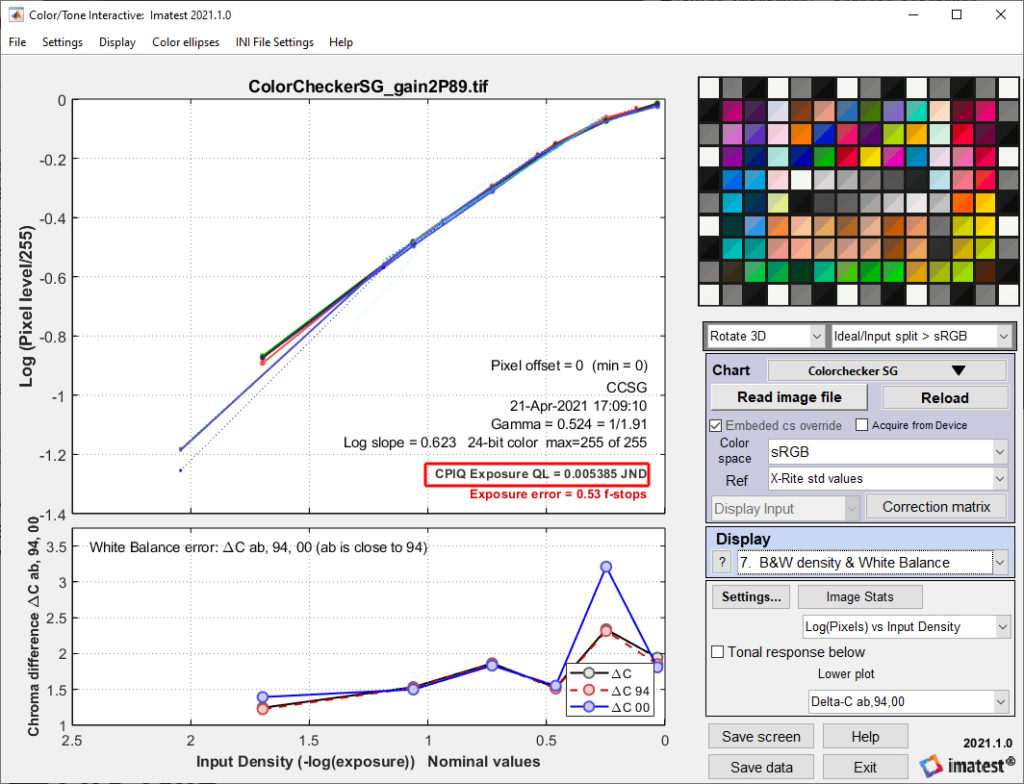
Auto Exposure – Chapter 12
CPIQ Auto exposure is in draft status. It will be added to the 2021 revision of the CPIQ Standard. You should use Imatest v2021.1 or later to perform this calculation.
Auto exposure error is based on deviation from a nominal luminance value for the neutral grey patch in an X-Rite Colorchecker SG. In a variant calculation, we can also calculate this metric from a 24-patch X-Rite Colorchecker.
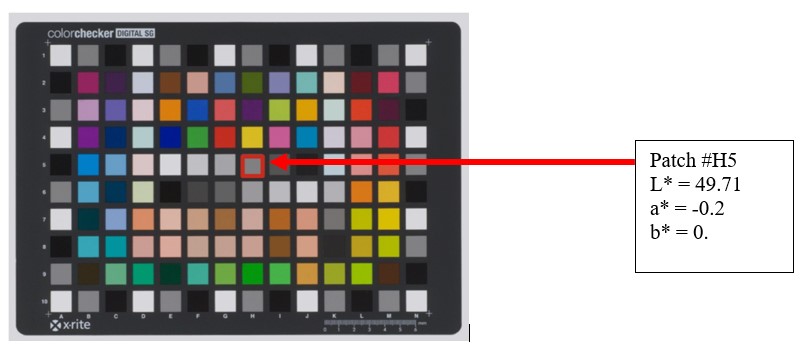
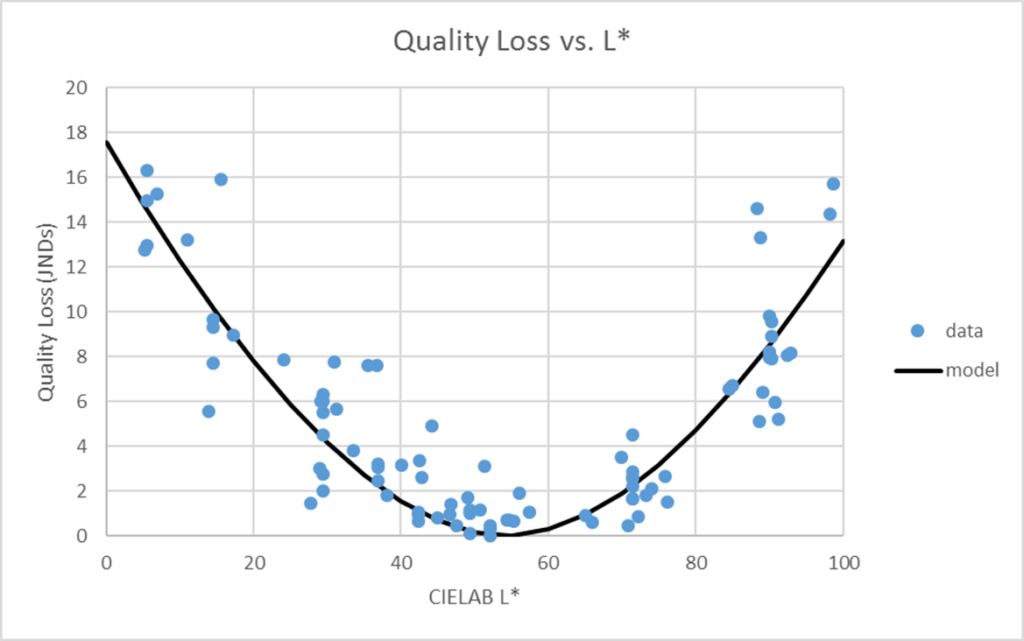
A psychophysical study of the subjective quality based on luminance level was how the following model for exposure quality loss was developed:
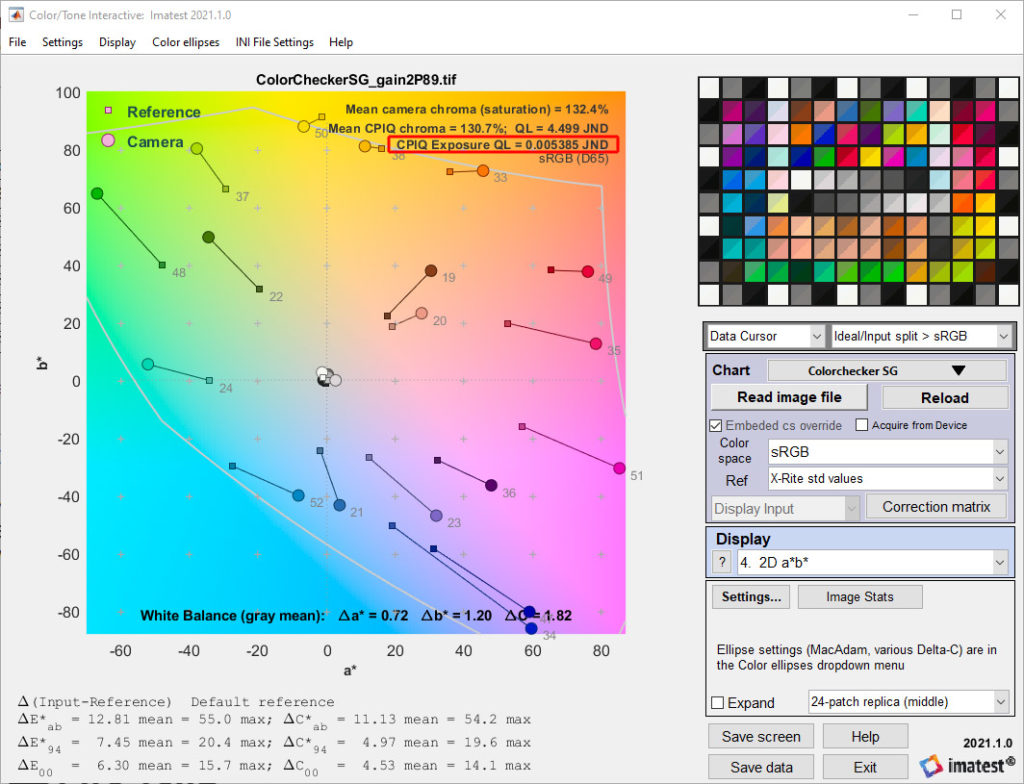
CPIQ Auto exposure is measured with the Imatest Color/Tone module, which produces a Quality Loss (QL) score in units of Just Noticeable Differences (JND).
Results are available in display #4 2D a*b:
and display #7 B&W density & White Balance:
JSON Locations
Metric |
JSON |
|
Spatial Frequency Response |
CPIQ.
|
|
Lateral Chromatic Displacement |
CPIQ.
|
|
Chroma Level |
mean_chroma_level_CPIQ_Pct: Chroma level value as a percentage CPIQ_chroma_quality_loss: JND quality loss value |
|
Color Uniformity |
Dc_max_color_nonuniformity_CPIQ: Color uniformity max difference in pixel level QL_quality_loss_color_nonuniformity_CPIQ: JND quality loss value |
|
Local Geometric Distortion |
CPIQ.
|
|
Visual Noise |
VN_CPIQ_Total_Visual_Noise_Omega_1: Total objective visual noise for first set of viewing conditions VN_CPIQ_Quality_Level_QL_1: JND quality loss for first set of viewing conditions VN_CPIQ_Total_Visual_Noise_Omega_2: Total objective visual noise for second set of viewing conditions VN_CPIQ_Quality_Level_QL_2: JND quality loss for second set of viewing conditions VN_CPIQ_Total_Visual_Noise_Omega_3: Total objective visual noise for third set of viewing conditions VN_CPIQ_Quality_Level_QL_3: JND quality loss for third set of viewing conditions |
|
Texture Blur |
CPIQ.
|
|
Auto Exposure |
CPIQ_exposure_quality_loss_JND: JND quality loss value
|