The SFRplus chart: description and how to photograph it
Slanted-edge test – Advantages – Obtain chart – Framing – No bars – Lighting
Distance – Exposure – Tips – Links
Imatest SFRplus performs highly automated measurements of several key image quality factors using a specially-designed test chart that may be purchased from the Imatest store (recommended) or printed on a high-quality inkjet printer. The user does not need to manually select Regions of Interest (ROIs).
Image quality factors include
- Sharpness, expressed as Spatial Frequency Response (SFR), also known as Modulation Transfer Function (MTF), which can be mapped over the entire image,
- Noise (limited: eSFR ISO has more detailed noise calculations),
- Lateral Chromatic Aberration,
- Distortion Details in SFRplus Distortion and Field of View measurements,
- Tonal response (with less detail than Stepchart; limited noise statistics),
- Color accuracy, when used with an SFRplus chart that contains the optional color pattern, located above the central square,
- ISO sensitivity (Saturation-based and Standard Output Sensitivity), when incident lux is entered.
SFRplus operates in two modes.
- Interactive/setup mode (run by pressing Rescharts or in the Imatest main window), which allows you to select settings and interactively examine results in detail.
| All Rescharts (Interactive/Setup) modules can read images from image files (raw and interchangeable) ♦ via direct data acquisition from a variety of devices |
- Auto mode (run by pressing in the Imatest main window), which runs automatically with no additional user input. ROIs are located automatically based on settings saved from the interactive/setup mode. This allows images with different sizes and framing to be analyzed with no change of settings. Auto mode works with large batches of files, and is especially useful for automated testing, where framing may vary from image to image.
This document introduces SFRplus and explains how to obtain and photograph the chart. Part 2 shows how to run SFRplus inside Rescharts and how to save settings for automated runs. Part 3 and Part 4 illustrates the results.
Click on any of the thumbnails below (or on the image itself, repeatedly) to explore the many capabilities of SFRplus. Note the description below the image. Results are described in more detail in Part 3 and Part 4.
The SFRplus test chart
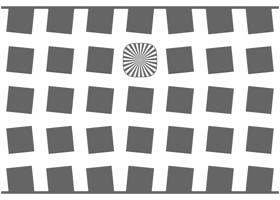
A standard SFRplus test chart (one of many configurations) is shown below.
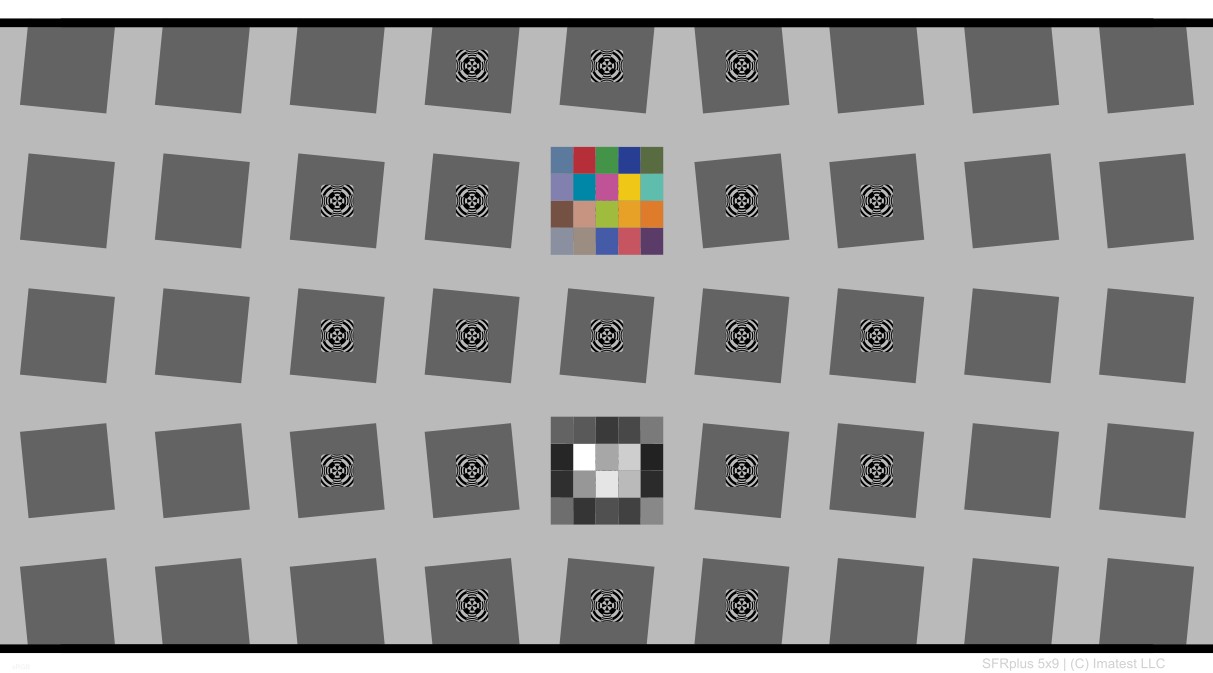
Standard SFRplus test chart: 5x9 grid, 4:1 contrast,
20-step 4x5 stepchart (0.1 density increment) and color chart
Sharpness is derived from light/dark slanted edges at the boundaries of the squares, as described in Sharpness: What is it and how is it measured? SFRplus can handle a wide range of camera aspect ratios; the left and right sides of the chart may extend beyond the frame or be well inside it.
The essential features of the SFRplus chart are
- Bars at the top and bottom used for measuring distortion and facilitating edge detection.
- A grid of slanted squares with contrasts no greater than 10:1. 4x7, 5x7, 5x9 and 7x11 (row x columns) grids are available. The tilt of the squares facilitates measurement of Lateral Chromatic Aberration using vertical edges (which are near-tangential) near the corners. This orientation also helps with the Lens-style MTF plots, which are similar to MTF displays on the Canon, Nikon, and Zeiss websites.
- The squares above and below the middle square can be used for non-spatial measurements. In the standard chart, the square below the middle is a 4x5 grayscale stepchart with density steps of 0.1 used to measure tonal response and gamma, and the square above the middle square contains either a fine star pattern (used as a focus aid; not for analysis) or a 4x5 color pattern (with 18 of the 20 colors similar to the industry-standard 24-patch color chart) for measuring color accuracy.
- Although the standard contrast is 4:1, there can be a small number of low contrast (typically 2:1) squares (an option with 10:1 contrast charts) for measuring the effects of nonlinear/nonuniform signal processing.
| Standard | Options & notes | |
|---|---|---|
| Grid | 5x9 or 5x7 | 5x9 is best suited for HDTV (16:9 aspect ratio) and DSLRs (3:2 aspect ratio). 5x7 is best suited for compact digital cameras and camera phones (4:3 aspect ratio). 4x7 and 7x11 are available on special request. |
| Contrast | 4:1 - only RECOMMENDED | 4:1 contrast is specified in the ISO 12233:2014 standard, and is generally recommended, especially for new work. May give lower MTF numbers than the 10:1 chart due to nonuniform signal processing. |
| 10:1 (primary), 2:1 (secondary) | Most squares have 10:1 contrast; a few (typically 4) have 2:1 contrast to show the effects of nonlinear/nonuniform processing. | |
| 10:1 - only (not recommended) | Contrast > 10:1 is not recommended. ≥40:1, which was used in the old ISO 12233:2000 chart, produced unreliable results because images were frequently saturated (clipped). | |
| Grayscale stepchart |
Included (below center) | Not available in chrome on glass charts |
| Focus star or Color chart (above center) |
The focus star is no longer recommended. | The focus star was used as a focus aid (not for Imatest analysis), but is not useful for charts that have focus-aid patterns in the centers of the squares. Omitted if color chart is included. |
| Optional 20-patch color chart | Replaces focus star if selected. L*a*b* values will be sent in a CSV file. 18 of the 20 patches are close to the industry-standard 24-patch test chart. | |
| Pre-distorted chart | (The standard chart is undistorted.) | Two levels of pincushion distortion distortion are available for use with fisheye (strongly barrel-distorted) lenses. Available in matte surface only. |
| Surface | Matte or semigloss | Semigloss is slightly sharper and has a more accurate grayscale in the deep tones (print densities > 1.5), but is more susceptible to glare (specular reflections), especially with wide angle lenses. Matte surface is recommended for wide angle lenses |
|


Nonlinear and nonuniform signal processing SFR (MTF) measurements are often affected by chart contrast due to nonuniform signal processing, i.e., processing that depends on the contents of neighboring pixels, and hence may vary throughout an image. Nonuniform processing is almost universal in consumer digital cameras. It improves pictorial quality but complicates measurements. You can avoid it for Imatest measurements by decoding RAW images (if available) with dcraw. It takes two primary forms.
The signal processing algorithms are proprietary; they are a part of a manufacturer's "secret sauce" for producing pleasing images. Though they vary a great deal, the following generalizations can be made.
For this reason it is sometimes useful to photograph a chart that has both relatively high and low contrast edges: 10:1 and 2:1 in the table above. Nonuniform signal processing can be analyzed in depth in the Log F-Contrast module. |
| SFRplus slanted-edge algorithm The algorithms for calculating MTF/SFR were adapted from a Matlab program, sfrmat, written by Peter Burns ( |
Obtain the chart
Summary
 Dual-contrast 5x9 SFRplus chart, 10:1 & 2:1 contrast, focus star. |
|

The standard SFRplus test chart consists of a 5x7 or 5x9 grid of squares, which may have a 4:1 contrast ratio (the current recommendation, compatible with the ISO 12233:2014 standard), a 10:1 contrast ratio, or a 10:1 contrast ratio for all but four of the squares and a 2:1 contrast ratio for the remaining four (one column off the center). A small 4x5 patch stepchart (densities in steps of 0.1 from 0.05 to 1.95) is located below the central square and a focus star (not analyzed by SFRplus) or a 20-patch color pattern is located above the center. The chart may be pre-distorted for use with fisheye (strongly barrel-distorted) lenses.
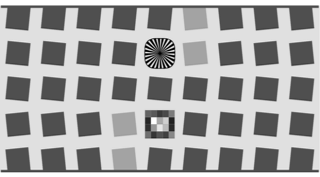
Charts can be purchased from the Imatest store in a variety of confgurations. The chart on the left below contains a color pattern (an L*a*b* reference file is included with purchase). The single-toned chart on the right below contains a star pattern, which can be used as a focus aid (not for analysis). It be produced as a chrome-on-glass transmission target in very small sizes Details here. Charts can be printed on widebody inkjet printers, but you must have fine materials, skill, and a knowledge of color management. We strongly recommend that you purchase a chart.
Charts should be mounted on 32x40 or 40 x60 inch sheets of 1/2 inch (12.5 mm) thick foam board with a spray adhesive (such as 3MTM 77 or Photo Mount) or double-sided tape (such as 3MTM #568 Positionable Mounting Adhesive). 1/2 inch foam board stays flatter than standard 1/4 or 3/8 inch foam board. PVC board is also very promising: it may be more durable and it comes in a variety of sizes.
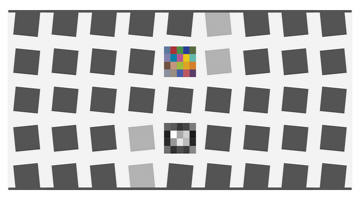 5x9 SFRplus chart with color pattern |
 Single-toned 5x7 SFRplus chart with focus star |
Photograph the chart
Framing requirements:
- There should be white space above and below the bars (used to measure distortion and locate squares) at the top and bottom of the images. The white areas should be at least 0.5% and, for best results, no more than 25% of the total image height. Ideally the white space should be ~1-6% of the image height. The chart should be vertically centered if possible, but this is not necessary for successful SFRplus runs.
- The bars may be omitted if row detection in the SFRplus setup window is set to Auto - no bars. Some care should be taken with framing since region selection acts as if there were bars at the top and bottom of the image.
- The stepchart pattern should be centered horizontally.
- The sides of the chart may extend beyond the image (as shown below) or the image may extend beyond the sides of the chart. The software is designed to accommodate a wide variety of framing and aspect ratios. Edges near the left and right boundaries will be properly located. If the sides of the chart are inside the image, you should try to minimize interfering patterns in the background that could be mistaken for chart features. Chart surroundings inside the image should be white or light gray if possible; if that's not possible you can crop the image in the SFRplus setup window.
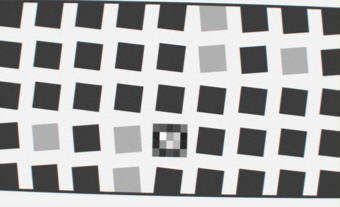
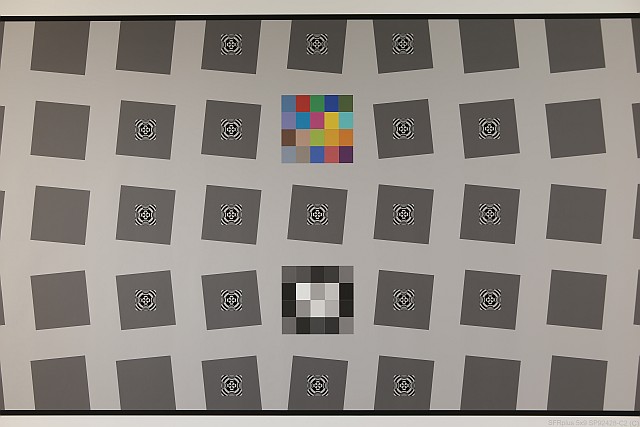 Well-framed SFRplus image
It's OK (and quite commonplace) for the sides of the chart to run off the image.
- The chart may be aligned using techniques shown in Building a Low-Cost Test Lab. SFRplus tolerates moderate misalignment: a tilt of ~2 degrees, some perspective (keystone) distortion, etc., but every effort should be made to align the chart properly. Moderate barrel or pincushion distortion (<8% SMIA) is also well tolerated, but a pre-distorted chart should be used with extreme fisheye lenses (with high barrel distortion).
- The image can be cropped (starting with) to remove interfering features near the edges, using the Crop borders button in the SFRplus setup window.
If exposure compensation is available, increasing exposure by +1 f-stop often produces a better exposure, especially on the grayscale stepchart pattern.
|
Bad framing
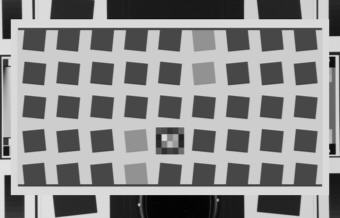 Interfering patterns near borders (Can be cropped.) |
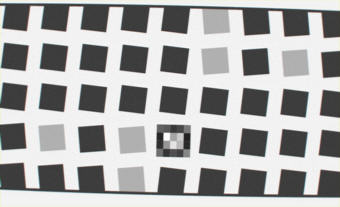
Good framing
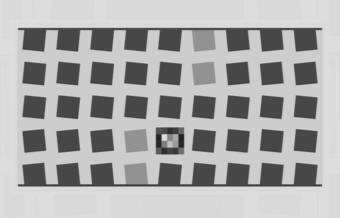 Same pattern; interfering patterns masked out (of course corners won't be measured.) |
 Missing white space above top distortion bar |
 Some tilt, distortion tolerated OK for sides of chart to run off image |
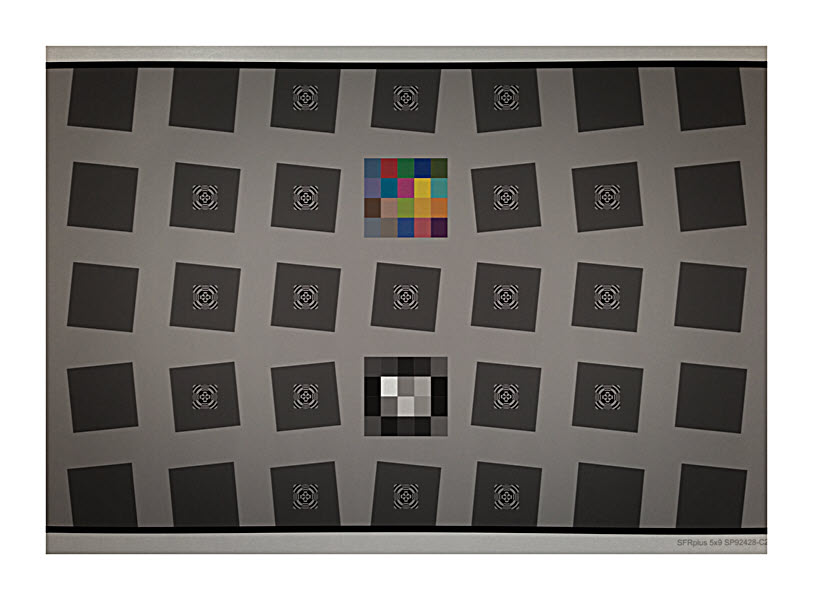 Chart mounted on a lightbox with no masking: Chart mounted on a lightbox with no masking:Chart edges mistaken for top, bottom bars |
|
|
No bars The top and bottom bars may be omitted if Auto - no bars is selected in the row detection menu in the SFRplus setup window. Region selection will behave as if the bars were located at the top and bottom of the image. For this reason, either
|

Framing and cropping SFRplus for distortion measurementsDistortion measurements are derived from the detected square locations in the center row as well as the bars at the top and bottom of the chart. If any of the squares in the center row are detected incorrectly— which can happen if there are interfering patterns just outside the chart— the distortion measurement will be incorrect. This is best handled by avoiding interfering patterns outside the chart, but can also be fixed by cropping the chart. Here is an example. |
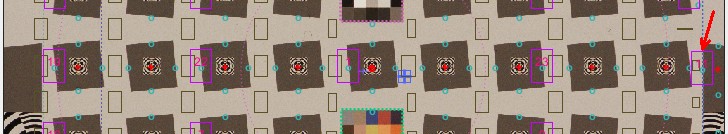 In this image interfering patterns on the right side of the image caused the right-most square to be incorrectly detected (red arrow), resulting in an error in the distortion measurement. In this image interfering patterns on the right side of the image caused the right-most square to be incorrectly detected (red arrow), resulting in an error in the distortion measurement. |
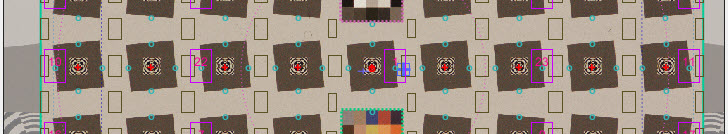 Cropping the image (the crop limits are the cyan lines near the left and right sides), corrects the detected location of the right-most square as well as the distortion measurement. Cropping the image (the crop limits are the cyan lines near the left and right sides), corrects the detected location of the right-most square as well as the distortion measurement. |
Lighting
The chart below summarizes lighting considerations. The goal is even, glare-free illumination. Lighting angles between 30 and 45 degrees are ideal in most cases. At least two lights (one on each side) is recommended; four or six is better. Avoid lighting behind the camera, which can cause glare. Check for glare and lighting uniformity before you expose. A description of recommended lighting setups can be found in The Imatest Test Lab. (We formerly recommended 4700K (near-daylight) SoLux quartz-halogen lamps, but we now recommend LED lamps, which are available with adjustable intensity and color temperature.) The BK Precision 615 Light meter (Lux meter) is an outstanding low-cost instrument (about $100 USD) for measuring the intensity and uniformity of illumination.
 Simplified lighting diagram
Distance
|
A letter-sized (8.5x11 inch) chart printed on Premium Luster paper on the Epson 2200 (a high quality pigment-based inkjet photo printer) was analyzed for MTF using the 6.3 megapixel Canon EOS-10D. There was no change when the image field was at least 22 inches (56 cm) wide— twice the length of the chart. Performance fell off slowly for smaller fields.
Choose a camera-to-target distance that gives at least this image field width. The actual distance depends on the sensor size and the focal length of the lens. The minimum image field is illustrated on the right.
Cameras with more pixels, and hence higher potential resolution, should have a larger image field width, hence printed chart width.
Distance/field width guidelines for high quality inkjet charts
|
|
|||||||||||||||||||||||||||||||||||||||||||||||||
| Image field width (in inches) > 8.8 × sqrt(megapixels) Image field width (in cm) > 22 × sqrt(megapixels) — or —There should be no more than 140 sensor pixels per inch of target or 55 sensor pixels per centimeter of the target. — or —The distance to the target should be at least 40X the focal length of the lens for 6-10 megapixel digital SLRs.(25X is the absolute minimum for 6 megapixel DSLRs; 40X leaves some margin.) For compact digital cameras, which have much smaller sensors, the distance should be at least 100X the actual focal length: the field of view is about the same as an SLR with comparable pixel count. The recommended distance is described in more detail in Chart quality and distance, below. |
||||||||||||||||||||||||||||||||||||||||||||||||||
| There is some confusion about lens focal lengths in compact digital cameras. They are often given as the "35mm-equivalent," which many photographers can relate to viewing angle. 35-105mm or 28-140mm are typical "35mm-equivalent" numbers, but they are not the true lens focal length, which is often omitted from the specs. What is given is the sensor size in 1/n inches, a confusing designation based on the outside diameter of long-obsolete vidicon tubes. It The table on the right relates the 1/ndesignation to the diagonal dimension of the sensor. True focal length = "35mm-equivalent" × (diagonal mm.) / 44.3 | ||||||||||||||||||||||||||||||||||||||||||||||||||
Exposure
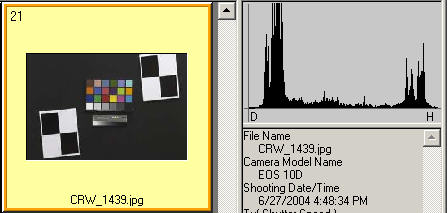
Good exposure is important for accurate SFRplus results. Neither the black nor the white regions of the chart should clip— have substantial areas that reach pixel levels 0 or 255. The best way to ensure proper exposure is to use the histogram in your digital camera. Blacks (the peaks on the left) should be above the minimum and whites (the peak(s) on the right) should be below the maximum.
The above image (taken from the Canon File Viewer Utility) is close to a perfect exposure. Some exposure compensation, typically around +1 f-stop, may be helpful.
|
Save the image as a RAW file or maximum quality JPEG. If you are using a RAW converter, convert to JPEG (maximum quality), TIFF (without LZW compression, which is not supported), or PNG. If you are using film, develop and scan it.
If the folder contains meaningless camera-generated file names such as IMG_3734.jpg, IMG_3735.jpg, etc., you can change them to meaningful names that include focal length, aperture, etc., with the View/Rename Files utility, which takes advantage of EXIF data stored in each file.
You are now ready to run Imatest SFRplus.
Links
How to Read MTF Curves by H. H. Nasse of Carl Zeiss. Excellent, thorough introduction. 33 pages long; requires patience. Has a lot of detail on the MTF curves similar to the Lens-style MTF curve in SFRplus. Even more detail in Part II.
Understanding MTF from Luminous Landscape.com has a much shorter introduction.
Understanding image sharpness and MTF A multi-part series by the author of Imatest, mostly written prior to Imatest's founding. Moderately technical.
Slanted-Edge MTF for Digital Camera and Scanner Analysis by Peter D. Burns (2000) (alternate source). An excellent introduction to the ISO 12233 slanted-edge measurement. Closely related: Diagnostics for Digital Capture using MTF by Don Williams and Peter D. Burns (2001), Applying and Extending ISO/TC42 Digital Camera Resolution Standards to Mobile Imaging Products by Don Williams and Peter D. Burns (2007) (Contains an image of an early version of the low-contrast slanted-edge test chart proposed for the revised ISO 12233 standard.)
Bob Atkins has an excellent introduction to MTF and SQF. SQF (subjective quality factor) is a measure of perceived print sharpness that incorporates the contrast sensitivity function (CSF) of the human eye. It will be added to Imatest Master in late October 2006.
How to Measure MTF and other Properties of Lenses by Optikos.
