Gamutvision main page – Gamutvision Table of Contents/Site map – Using Gamutvision – Using Gamutvision 2: Displays
Welcome – Gamutvision window – Documentation/Table of Contents/Site map
Welcome to Gamutvision
Starting in late 2022, it is a module of Imatest (Studio and Master) in the 23.1 pilot program. If there is sufficient customer interest, we may release it as a standalone product. |
|
With Gamutvision you can
|
|
Who can benefit from Gamutvision?
|
| Gamutvision was developed by Imatest LLC in early 2006. In 2016 it was released as a free program that would only work with old 32-bit versions of MATLAB. In late 2022 we updated Gamutvision to work with 64-bit computers and added it as a module to Imatest Studio and Master (in the 23.1 Pilot program). |
 |
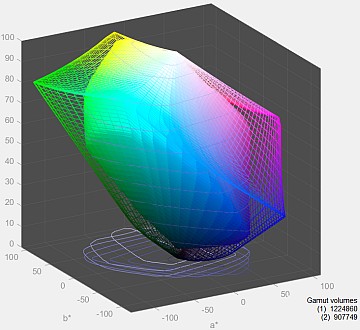
Gamutvision illustration A 3D L*a*b* Gamutvision display showing the color gamuts of
This is one of several Gamutvision displays. It can be zoomed and rotated (manually or automatically), and Saturation S can be reduced to display the gamut interior. The L*a*b* gamut volume is optionally displayed on the lower-right. |
|
The Gamutvision window
The image below illustrates the Gamutvision window.
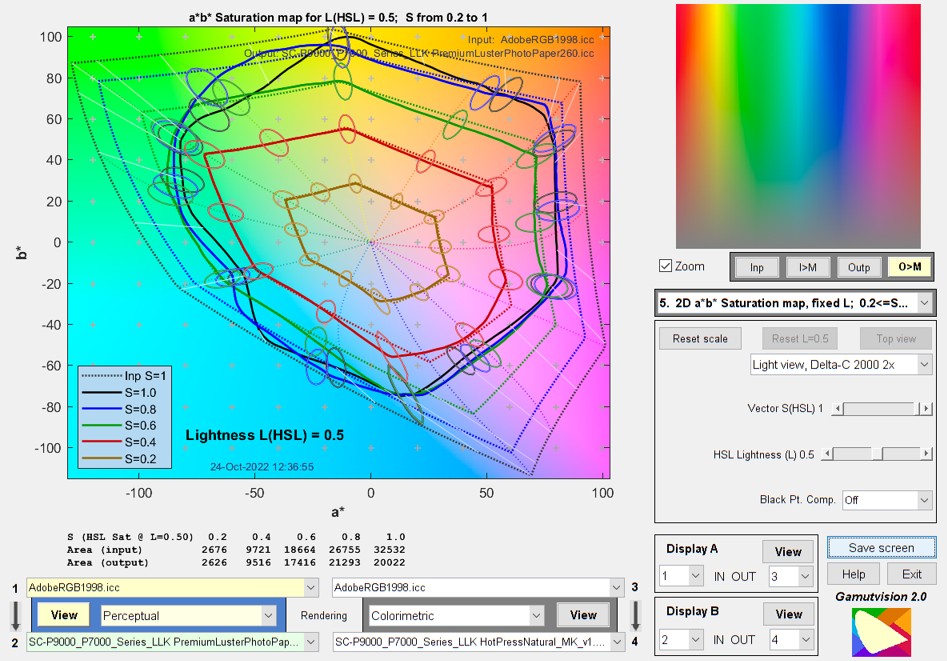
The selected input and output color spaces and rendering intent are highlighted on the lower left. Explanatory tooltips appear when the cursor is moved over buttons or controls.
The large image on the left contains a primary Gamutvision output: a 2D a*b* saturation plot of the input gamut (dashed lines) and mapped output gamut (solid lines) for L(HSL) = 0.5 (where chroma is maximum) is shown. Additional displays, such as the 3D L*a*b* gamut plot shown near the top of this page, can be selected.
The small image on the upper-right contains the input or output test image, either in its original form or mapped ( or ) to the monitor color space (usually similar to sRGB).You can use this image to compare colors of the original and the transformed images.
The above plot shows the gamut for the Adobe RGB (1998) color space (the input profile) mapped with Perceptual rendering intent to SPR2400 PremLuster BstPhoto.icc (an ICC profile for Epson R2400, Premium Luster). The gamut achieved when mapping from Adobe RGB is distinctly better than sRGB but somewhat smaller than the full printer gamut. Despite the R2400’s evident weakness in the greens, blues, and magentas, it was state-of-the-art for pigment-based printers in 2006. A comparison with the Epson 2200 (the previous generation) showed little change in color gamut and a modest increase of 0.13 in Dmax (the maximum printable density).
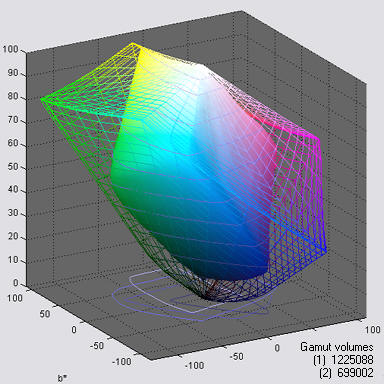
The plot below shows the 3D L*a*b* results of this gamut mapping for an actual image, going from Adobe RGB to a Hahnemuhle fine art matte paper (which has a lower gamut and Dmax (maximum print density) than luster/semigloss papers). The circles represent colors in the image file. The ends of the lines are the printed colors. The ends are somewhat obscured by the semi-transparent wireframe display of the (mapped) output color space. This display can be made transparent or opaque. It can also be rotated and zoomed.
Gamutvision Documentation/Table of Contents/Site Map
Using Gamutvision: Basic instructions and getting started
Using Gamutvision: Part 2: Displays
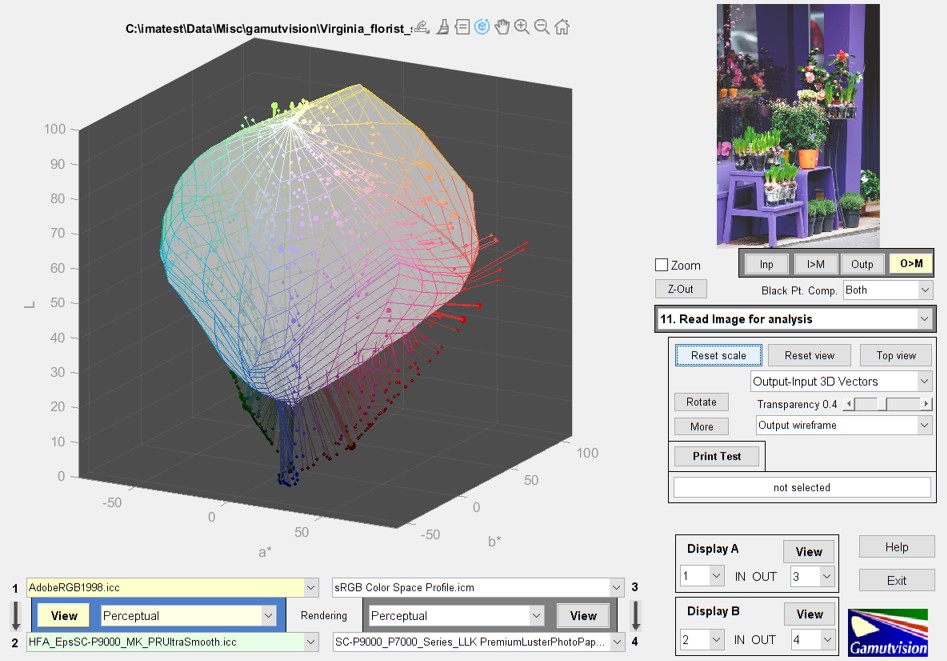
Image color analysis with Gamutvision – Analyze arbitrary images read into Gamutvision
Gamutvision examples and tutorials
These pages, which illustrate a few of Gamutvision’s many uses, will help you to get the most out of Gamutvision.
Identifying defective profiles — illustrates a popular profile with a glaring defect and points to a solution.
Black Point Compensation demystified — shows the meaning of the mysterious checkbox.
Round trips — for evaluating printer profile quality
Profile mystery: The case of the smudged pines — sheds light on a profile defect that smudges a print of pine trees.
Camera and scanner profiles — shows what happens when you convert to standard color spaces.
Printer gamuts: total and practical — shows the difference between a printer’s theoretical (i.e., maximum) color gamut and the real color gamut achieved when working with standard color spaces.
Gamutvision equations — Gamut volume, HSL & HSV, etc.
Gamutvision uses ICCTrans, the Matlab interface to the LittleCMS color management system. The ICCTrans source code is on Github. The ICCTrans manual may have disappeared from the Internet, so we’ve put it on the Imatest website. Many thanks to Ignacio Ruiz de Conejo and Marti Maria (of Hewlett-Packard Spain when ICCTrans was written) for their outstanding work.
