Summary: The physical lens-to-sensor tilt angle is difficult to measure from images, but the effects of tilt on image quality are highly measurable, and can be included in pass-fail criteria.
Introduction
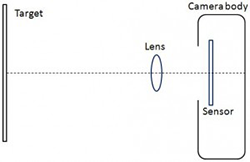
There are four planes that affect image quality in digital cameras: the test target, the lens, the sensor, and the camera body. In a perfectly-aligned camera, each of these planes will be aligned parallel to the others.
When a “tilt” measurement is specified, it is important to define which pair of planes is tilted with respect to each other. Different tilts have different effects on image quality. Two are of particular interest.
Lens-to-sensor tilt primarily affects focus plane. It has only a secondary effect on geometry. This is the tilt that is most likely to be called for in a specification. It can be expressed as tilt amplitude (amount) and direction.
Target-to-sensor tilt affects geometry (keystone distortion, which is measured by two convergence
angles in SFRplus), and also affects the focus plane.
Because of the complexity of imaging systems, it is not possible to obtain a unique tilt angle from a single image, because measurements that are affected by tilt are also affected by a number of other factors, including lens aberrations, lens manufacturing defects (other than tilt), depth of field, autofocus accuracy, and more. But it is practical and convenient to measure the effects of tilt on image quality.
Keystone distortion can be caused by both a tilt of the target with respect to the sensor and by shifts (lateral movement) of the target, lens, or sensor. Lens tilt has relatively little effect on keystone distortion. Keystone distortion can be measured by the two convergence angles (horizontal and vertical) reported by Imatest SFRplus.
The focus plane can be altered (tilted) by target-to-sensor or lens-to-sensor tilt. Lens-to-sensor tilt is used intentionally in view cameras (and in some special purpose lenses) to correct for focus shift that take place when the object plane is not parallel to the sensor plane. This procedure takes advantage of the Scheimpflug principle.
Errors in the focus plane can be measured in Imatest SFRplus, which maps sharpness over the image plane. Unfortunately, focus plane tilt is difficult to diagnose when the target is focused (correctly) at the center of the image, and sharpness drops off symmetrically around the center. In this case, focus plane errors can only be determined by changing the lens focus and looking at the MTF asymmetry.
The point where the image of a flat field, measured by Imatest Uniformity or Blemish, is brightest (the “optical center”) is strongly affected by lens tilt.
In the remainder of this report we look at how Imatest reports image quality parameters that are affected by tilts—primarily by lens tilt.
Keystone distortion and other geometric results
Several geometrical distortions, some of which are affected by tilt (mostly target-to-sensor tilt) are shown in the image and Geometry plot in Imatest SFRplus.
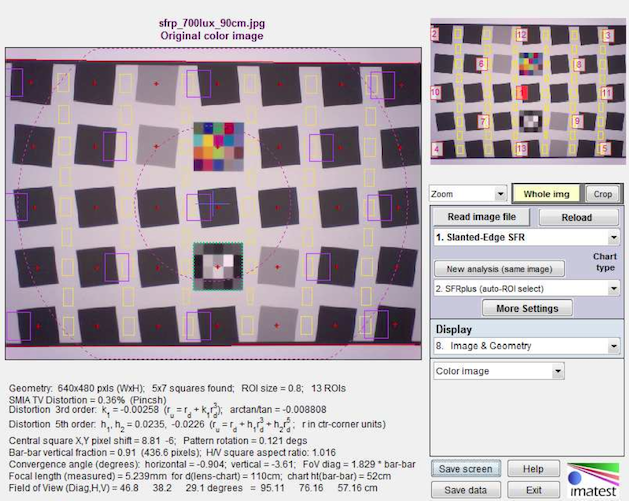
Imatest SFRplus Image & Geometry display
Several geometrical parameters are displayed in this window (and written to the CSV, XML, and JSON output files).
- Distortion: -1.02% (barrel distortion). The 3rd order and arctan/tan coefficients can be used for distortion correction. Measured from the top and bottom bars.
- Decentering (Central square x,y pixel shift): [1.43 23 pixels] The distance in pixels between the center of the SFRplus chart and the center of the image.
- Pattern rotation: -0.361 degrees. Measured from the top and bottom bars.
- Field of view: This requires that the pixel spacing (or pitch), chart bar-to-bar distance, and lens focal length be entered. Diagonal, Horizontal, and Vertical fields are displayed.
- Convergence angles: These are measurements of keystone distortion. They are affected by either a tilt or a shift (offset) between the chart and sensor. For the horizontal convergence, the angles are normalized to represent lines that would intersect the top and bottom of the image
(left and right for vertical convergence). 0 is the ideal value. The vertical convergence angle of -3.61 degrees in the above image is plainly visible: the upper squares have more horizontal separation than the lower ones.

The horizontal convergence angle is also quite visible in the bars.
Sharpness uniformity
Lens-to-sensor tilt strongly is strongly correlated with sharpness nonuniformity, which is measured when several regions of the SFRplus chart are selected for analysis (9 is a good compromise between speed and detail; the setting, 5. Center, corners, L R T B (9) is the recommended selection). If the lens is focused off the center, this nonuniformity is easy to see, but if the lens is (correctly) focused at the image sensor, sharpness loss due to tilt cannot be reliably distinguished from optical sharpness loss (due to lens design limitations and manufacturing tolerances).
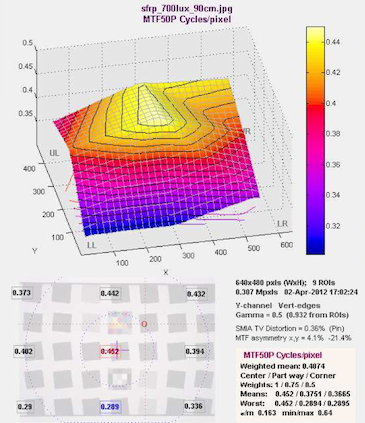
The plot below shows clear signs of lens tilt: it is sharpest around the upper-right and least sharp in the lower left, as measured by MTF50P (the spatial frequency where contrast falls to 50% of its peak value). This is reflected in the MTF asymmetry x,y = 4.1%, -22.3%. These numbers are, however, not reliable. Asymmetry changes strongly with lens focus; it would be zero or reversed if focus were changed. But lens tils always increases the spread between maximum and minimum MTF50P.
For measuring sharpness non-uniformity, which is the primary image quality degradation caused by tilt, the measurement should involve the minimum value of MTF50P. Pass fail criteria could be based on minimum MTF50P, 0.289 in the figure below.
- The ratio of the minimum to the maximum MTF50P, 0.64 in the figure below.
- The ratio of the minimum to the weighted mean MTF50P. 0.289/0.4074, below.
All of these metrics include the minimum MTF50P. Any of them would be suitable.
Optical center (from Uniformity or Blemish)
When Uniformity or Blemish are run an “optical center” (brightest point in the smoothed image) is calculated. This measure is strongly correlated with lens-to-sensor tilt.
Summary
Although it’s neither easy nor practical to measure tilt angles from test chart images, the image quality factors that are degraded by tilts can be conveniently measured. These include
| Convergence angles, which measure keystone distortion |
Strongly affected to target-to-sensor misalignment. Only weakly affected by lens tilt. |
| Sharpness (MTF50 or MTF50P) uniformity, measured by the ratio of the minimum to the maximum values. | Affected by all misalignments |
| Optical center (based on brightness) | Affected by misalignments and by lens manufacturing quality. Difficult to correlate with specific misalignments. |
