December 2012 Newsletter

Imatest 3.9 Released

36-Patch Dynamic RangeNew features include:

  • Support for high-speed manufacturing testing in the Imatest IT version
  • Flat screen display testing via an improved Blemish Detect module
  • Dynamic range testing with our new high precision transmissive 36 patch chart
  • More robust SFRplus automated region detection, and improved Field of View and geometrical measurements

(more…)

Read More

Selecting SFR edge regions based on field distance

Some customers need to select regions based on a specified center-to-corner distance. This can be done using an Edge ID file (enhanced to be an Edge ID/Zone selection file in Imatest 5.0+), which is available in SFRplus, eSFR ISO, and Checkerboard. The box below contains concise instructions for using these files.

Edge ID/Zone selection file usage

An Edge ID/Zone selection file contains a list of identifiers for slanted edge ROI locations and selection zones, one per line, similar to lists in CSV and JSON output files. There are two types of data line: for individual ROIs and for ROI selection zones. It allows you to freely select edges or zones.

This window opens when you click
 Read EdgeID/Zone selection file. Click to view full size.

Click Read EdgeID file to read the file. Then click OK.

Individual edge ROI selection lines:  The format is  Column_Row_Side,  where

  • Column is the column number (x) relative to the center, e.g., -3, 0, 3, etc.
  • Row is the row number (y) relative to the center, e.g., -2, 0, 2, etc. NOTE: Row number increases in a downward direction, e.g., -1 is ABOVE center, etc.
  • Side is L, R, T, or B  (Left, Right, Top, or Bottom) (SFRplus and eSFR ISO modules). Use H or V (instead of L, R, T, B) for the Checkerboard module-only.
  • The final field from the results files ( _C, _E, etc. for Corner, Edge, etc.) is omitted.

Example: -2_1_L selects the left edge of the square two columns left of center and one row below center.

Zone selection lines (Imatest 5.0+):  The format is Z ii nn or S ii nn, where

  • Z denotes zone for edge selection based on % center-corner distance.
  • S denotes zone for edge selection based on % center-side distance.
  • ii is the minimum % distance. nn is the maximum % distance.

Example:  Z 60 80 selects all edges with centers between 60 and 80% of the way between the image center and the corner. Several zones can be selected.

A recent enhancement to Imatest Master 4.5 makes it easier to view the exact center-to-corner distance of each selected region in the Multi-ROI summary, shown below, using the Display ctr-corner % only setting in Imatest 4.5 (lower right).

Multi-region display with Display ctr-corner % only (and Plot Vertical-only)

In Imatest 5.0+ another selection— Display ctr-corner & EdgeID (shown on the right)— makes it even easier to relate center-to-corner location to Edge ID.

For SFRplus, it’s very important to note that

  • the center-to-corner % distance of an edge is proportional to the bar-bar height % (the top of the top bar – the bottom of the bottom bar in % of the image height) for an image with a fixed aspect ratio (3:2 for the above image, shown just to the right of (WxH).
  • The center-to-corner % distance of the edge is inversely proportional to the camera-to-chart distance.

For example, the Edge 3_2_R (Column 3, Row 2 (below the center), Right edge) is located at 74.8% of the center-to-corner distance. Moving the chart away from the camera reduces this number.

Another example (from a different image), let’s say that we want the two edges on the lower-right be located at an average distance of 70% of the center-to-corner distance. The current average is (81.9+83.8)/2 = 82.85%. The image would have to be framed (by backing away from it or using a smaller chart) so the bar-to-bar height was 89.6*70/82.85 = 75.7% (of the image height).

Another option is available if you can’t get the exact distances. The squares in rows 2 and 4 can be shifted slightly to the left or right of their nominal positions. This does not require a change in the software. (This cannot be done with rows 1, 3, and 5 without affecting the vertical convergence angle measurement.).

Read More

SFRplus – Selecting regions based on Center-to-corner distance

Some customers need to select regions based on specified center-to-corner distance. The objective of this is to match up the test region to to the lens specifications.

Imatest Master allows one to view the exact center-to-corner distance of each region in the Multi-ROI summary, shown below, using the Display ctr-corner % only setting (lower right).

It’s very important to note that the center-to-corner % distance of an edge is proportional to the bar-bar height % (the top of the top bar – the bottom of the bottom bar in % of the image height) for an image with a fixed aspect ratio (3:2 for the above image, shown just to the right of (WxH).

For example, the Edge 3_2_R (Column 3, Row 2 (relative to the center), Right edge) is always 82.1/89.6 = 0.9163 of the bat-to-bar height.

Another example, let’s say that we want the two edges on the lower-right be located at an average distance of 70% of the center-to-corner distance. The current average is (81.9+83.8)/2 = 82.85%. The image would have to be framed (by backing away from it or using a smaller chart) so the bar-to-bar height was 89.6*70/82.85 = 75.7% (of the image height).

Another option is available if you can’t get the exact distances. The squares in rows 2 and 4 can be shifted slightly to the left or right of their nominal positions. This does not require a change in the software. (This cannot be done with rows 1, 3, and 5 without affecting the vertical convergence angle measurement.).

Read More

SFRplus Quadrants

The chart corner quadrants are defined as follows:

Quadrants of the SFRplus chart

In the table below, the center square is Row 0, Column 0 (R0,C0), and Row number R increases from top to bottom. Note that some squares are not included in a quadrant. Chart quadrants are detected automatically; no changes to the input (Edge ID file, etc.) are needed.

Region Row R, Column C
Center -1 ≤ R ≤ 1; -1 ≤ C ≤ 1
UL R ≤ -1; C ≤ -2
LL R ≥  1; C ≤ -2
UR R ≤ -1; C ≥  2
LR R ≥  1; C ≥  2

Quadrant results

Imatest SFRplus calculates the mean, minimum, and maximum of each quadrant (Center, UL, UR, LL, LR) and the location of the lowest minimum and highest maximum,

then calculates the minimum of the means and the difference between the maximum and minimum of the means.

Here are some results from the JSON output for secondary readouts and quadrants.

“secondary_readout_1”: “MTF @ .25 C/P = “,
“secondary_1_results”: [0.423,0.402,0.343,0.327,0.557,0.582,0.327,0.316,0.381,0.37,0.356,0.344,0.401,0.358,0.551,0.566,
    
0.413,0.378,0.355,0.361],
“secondary_1_min_max_ratio”: [0.748],
“secondary_2_results”   [0.762,0.761,0.663,0.642,0.829,0.834,0.627,0.654,0.773,0.765,0.644,0.673,0.715,0.691,0.827,0.823,
     0.683,0.689,0.675,0.635],
“secondary_2_min_max_ratio”: [0.81], 
“quadrants”: “Center, UR, LR, UL, LL; min and max excludes Center.”,    quadrants corresponding to results below.
“secondary_1_quadrant_mean”: [0.5642,0.3577,0.3564,0.3807,0.3692], mean MTF@ 0.25C/P for each quadrant.
“secondary_1_quadrant_min”: [0.5512,0.3267,0.3162,0.3432,0.3274], minimum MTF@ 0.25C/P for each quadrant.
“secondary_1_quadrant_min_location”: “LR”,  location of above minimum.
“secondary_1_quadrant_max”: [0.5823,0.4019,0.3779,0.4229,0.4129], maximum MTF@ 0.25C/P for each quadrant.
“secondary_1_quadrant_max_location”: “UL”, location of above maximum.
“secondary_2_quadrant_mean”: [0.8281,0.692,0.6856,0.6959,0.6895], mean MTF@ 0.125C/P for each quadrant.
“secondary_2_quadrant_min”: [0.8227,0.6423,0.6351,0.644,0.6267], minimum MTF@ 0.125C/P for each quadrant.
“secondary_2_quadrant_min_location”: “LR”, location of above minimum.
“secondary_2_quadrant_max”: [0.8338,0.7611,0.765,0.7621,0.7734], maximum MTF@ 0.125C/P for each quadrant.
“secondary_2_quadrant_max_location”: “UL”, location of above minimum.
 

Pass/fail results

To obtain pass/fail results for quadrants and saturation, the lines shown in boldface below (all optional) should be added to the pass/fail ini file. Comments shown in red are not a part of the file.

[sfrplus]

Secondary_readout_1_outer_quadrant_delta_max = .15 
    the maximum difference between the highest and lowest mean values of the corner quadrants (UL, UR, LL, LR)
    for
secondary readout 1 (MTF @ 0.25 C/P, i.e., Nyquist/2).
Secondary_readout_1_outer_quadrant_mean_min_min = .25
     the minimum of the mean values of the corner quadrants (the smallest of the four means) for secondary readout 1.
Secondary_readout_2_outer_quadrant_delta_max = .15
    the maximum difference between the highest and lowest mean values of the corner quadrants (UL, UR, LL, LR)
    for secondary readout  2 (MTF @ 0.125 C/P, i.e., Nyquist/2).
Secondary_readout_2_outer_quadrant_mean_min_min = .6
     the minimum of the mean values of the corner quadrants (the smallest of the four means) for secondary readout 1.
Chart_mean_pixel_level_bounds = .3 .8|
     The lower and upper bounds of the chart mean normalized pixel level (for the central 1/9 = 1/3 X 1/3 linearly) of the chart.
Low_pixel_saturation_fraction_max = .3

High_pixel_saturation_fraction_max = .3

Chart_radial_pixel_shift_max = 15

Mirrored_chart = 1
Bayer_decode = 1
Horizontal_bars_OK_min = 1
All_Edge_IDs_detected = 1
Stepchart_expected_detected = 1
Color_expected_detected = 1

 Here is the corresponding JSON pass/fail result, with many lines omitted.

   “passfail”: {
            “Secondary_readout_1_outer_quadrant_delta_max”: [0.16],
            “Secondary_readout_1_outer_quadrant_name”: “MTF @ 0.125 C/P”,
            “Secondary_readout_1_outer_quadrant_delta”: [0.1527219409],
            “Secondary_readout_1_outer_quadrant_delta_passed”: [1],
            “Secondary_readout_1_outer_quadrant_mean_min_min”: [0.5],
            “Secondary_readout_1_outer_quadrant_mean_min”: [0.5324737485],
            “Secondary_readout_1_outer_quadrant_mean_min_passed”: [1],
            “Secondary_readout_2_outer_quadrant_delta_max”: [0.2],
            “Secondary_readout_2_outer_quadrant_name”: “MTF @ 0.125 C/P”,
            “Secondary_readout_2_outer_quadrant_delta”: [0.1801956371],
            “Secondary_readout_2_outer_quadrant_delta_passed”: [1],
            “Secondary_readout_2_outer_quadrant_mean_min_min”: [0.2],
            “Secondary_readout_2_outer_quadrant_mean_min”: [0.2393977739],
            “Secondary_readout_2_outer_quadrant_mean_min_passed”: [1]

        }

Read More

Slanted-Edge SFR Saturation

The following (Rescharts) SFRplus results shows the edge (unnormalized) and MTF results for one region near the center of the image that has the green channel saturated. (We deliberated boosted the image to saturate it.) The green channel is very clearly saturated, but luminance doesn’t quite reach saturation because of the low level of the blue channel. Note the sharp corner where the green channel reaches saturation. This corner has quite a lot of high frequency energy that is responsible for the high MTF of the green channel: MTF50 = 435 LW/PH, about 15-20% higher than the other channels.

SFRplus results showing how saturated green channel (red arrow illustrates onset) affects MTF

Measuring the impact of saturation is not easy because information is actually lost in the saturated region, i.e., you can’t tell exactly what you’d have gotten if the system were linear, and it’s difficult to make a reliable estimate of the corner sharpening caused by saturation, which is responsible for the MTF boost. So the metric we’ve chosen is

  • the fraction of the average edge above 0.99 (99% of the maximum value) for the edge with the largest fraction, or
  • the fraction of the average edge below 0.02 (2% of the maximum value) for the edge with the largest fraction.

These are about the best numbers I’ve been able to come up with to measure the severity of clipping, and I believe they are usable for pass/fail criteria. (the pass/fail threshold would be somewhere between 0.3 and 0.7).

Results

Here are results from the JSON output.

“sat_description”: “extreme edge max, edge min, fractions >.95, >.98, >.99, <.05, <.02″,

This is a description of the results in satsumall (saturation summary for all regions), below.

  1. The maximum value for all edges (20 in this analysis) for all colors (R, G, B, Y, where it can never be in the Y-channel because Y = 0.3*R + 0.59*G + 0.11*B.
  2. The minimum value for all edges.
  3. The largest fraction of pixels above the center value ((max+min)/2) for all edge regions and all colors where the pixel level is above 0.95 of the maximum pixel level (255 for 8-bit systems).
  4. The largest fraction of pixels above the center value where the pixel level is above 0.98 of the maximum.
  5. The largest fraction of pixels above the center value where the pixel level is above 0.99 of the maximum.
  6. The largest fraction of pixels below the center value where the pixel level is above 0.05 of the maximum.
  7. The largest fraction of pixels below the center value where the pixel level is above 0.02 of the maximum.

“satsumall”: [1,0.0636,0.978,0.967,0.967,0,0],

These are the actual results, showing no low saturation and strong high saturation (e.g., 0.978 (97.8%) of the pixels above the center value are above 0.95 (95%) of the maximum value.

“mean_pixel_level_ctr_9th”: [0.7530514761],

This is the mean relative pixel level (fraction of the maximum level) for the central ninth (by area; 1/3 X 1/3 length) of the image. It is used in the SFR Setup window to indicate underexposure (when < 0.3) or overexposure (when > 0.8). These numbers would not necessarily be used for pass/fail.

Pass/fail results

To obtain pass/fail results for quadrants and saturation, the lines shown in boldface below (all optional) should be added to the pass/fail ini file. Comments shown in red are not a part of the file.

[sfrplus]

Chart_mean_pixel_level_bounds = .3 .8|
The lower and upper bounds of the chart mean normalized pixel level (for the central 1/9 = 1/3 X 1/3 linearly) of the chart.
Low_pixel_saturation_fraction_max = .3

High_pixel_saturation_fraction_max = .3

Chart_radial_pixel_shift_max = 15

Here is the corresponding JSON pass/fail result, with many lines omitted.

“passfail”: {

            “High_pixel_saturation_fraction_max”: [0.3],
            “High_pixel_saturation_fraction”: [0.967032967],
            “High_pixel_saturation_fraction_passed”: [0],
            “Low_pixel_saturation_fraction_max”: [0.3],
            “Low_pixel_saturation_fraction”: [0],
            “Low_pixel_saturation_fraction_passed”: [1],
            “Chart_mean_pixel_level_bounds”: [0.3,0.8],
            “Chart_mean_pixel_level”: [0.7530514761],
            “Chart_mean_pixel_level_passed”: [1],

           …
        }

 
Read More

Measuring the Effects of Tilt

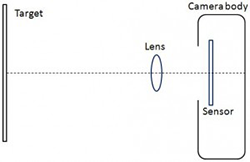
Summary: The physical lens-to-sensor tilt angle is difficult to measure from images, but the effects of tilt on image quality are highly measurable, and can be included in pass-fail criteria.

(more…)

Read More