Author: Henry Koren
2025 Year In Review
In 2025, Imatest continued the evolution of our image quality testing capabilities with significant advancements across software, hardware & charts. […]
Camera performance simulator based on information theory
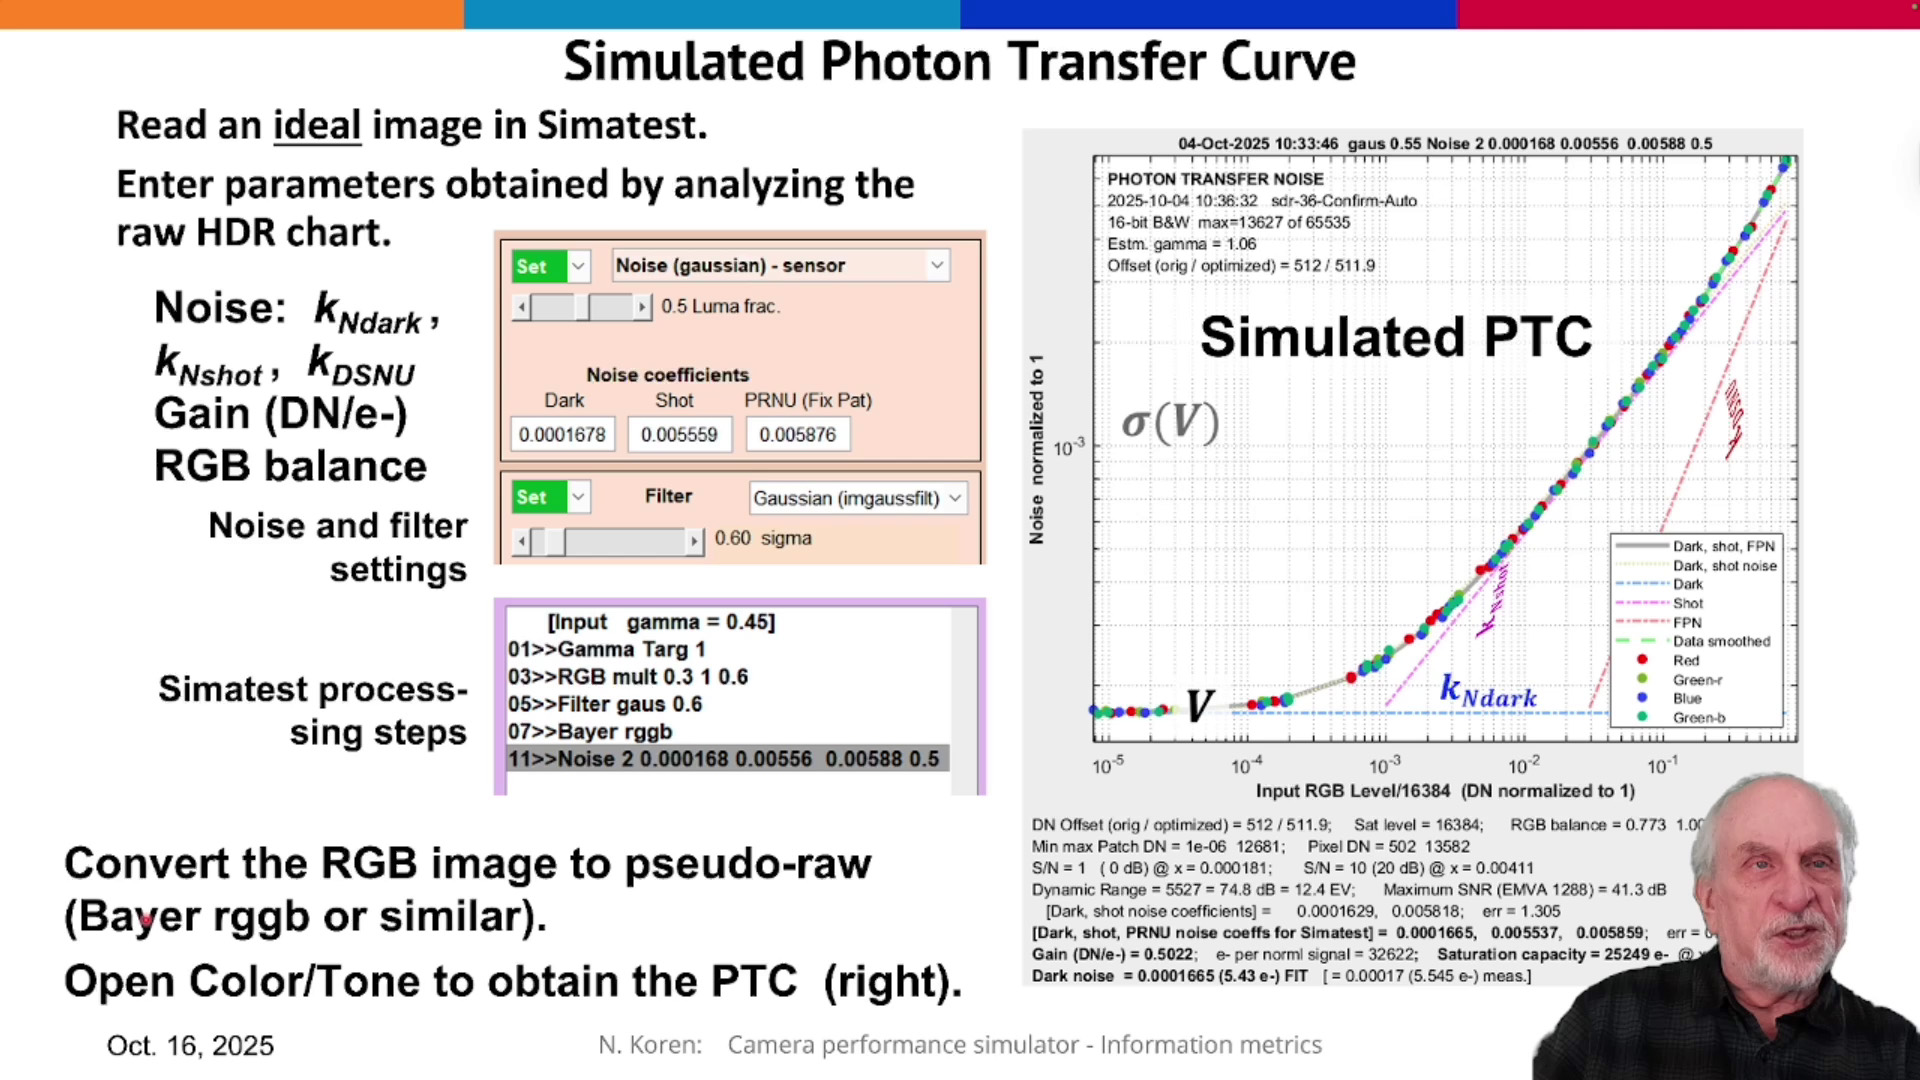
Norman Koren describes a camera performance simulator that includes an image sensor noise model with parameters derived from either dynamic range test chart measurements or EMVA 1288 results. The simulator includes lens degradations and the effects of Image Signal Processing (ISP). Results can be analyzed for standard image quality metrics such as sharpness and noise, or new metrics, derived from information theory, that provide an improved prediction of machine vision system performance.
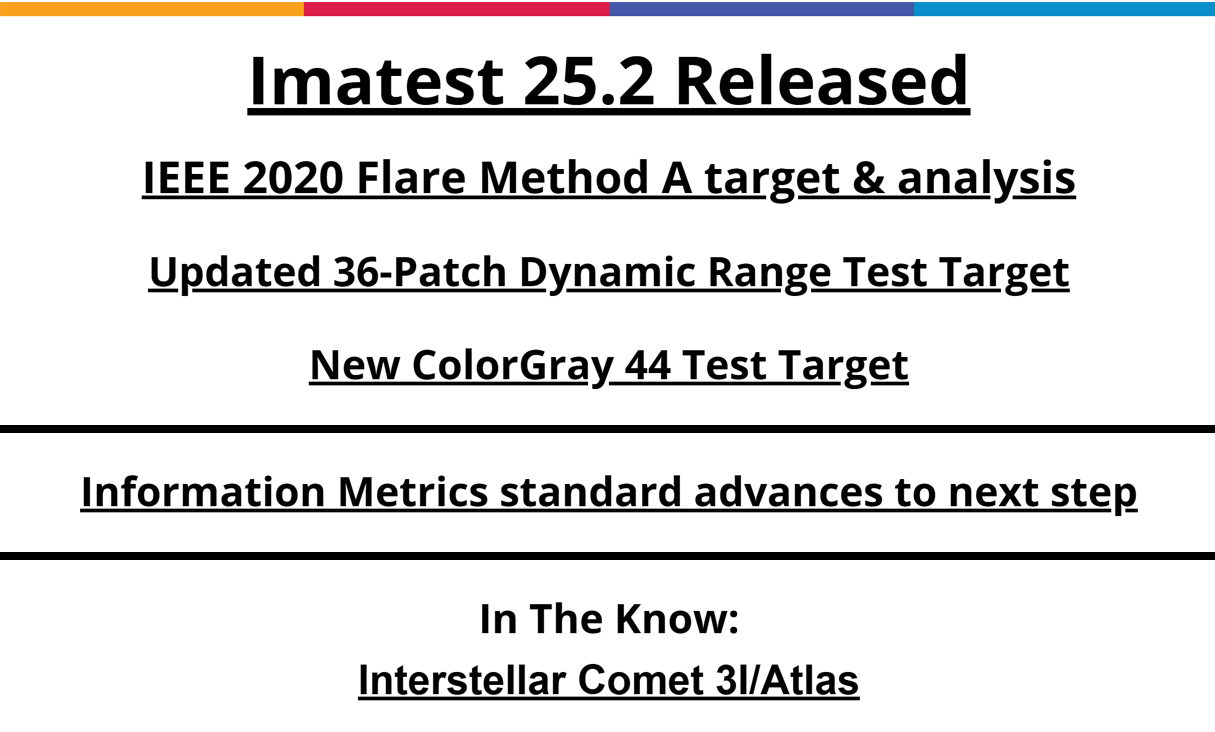
Imatest Release Version 25.2
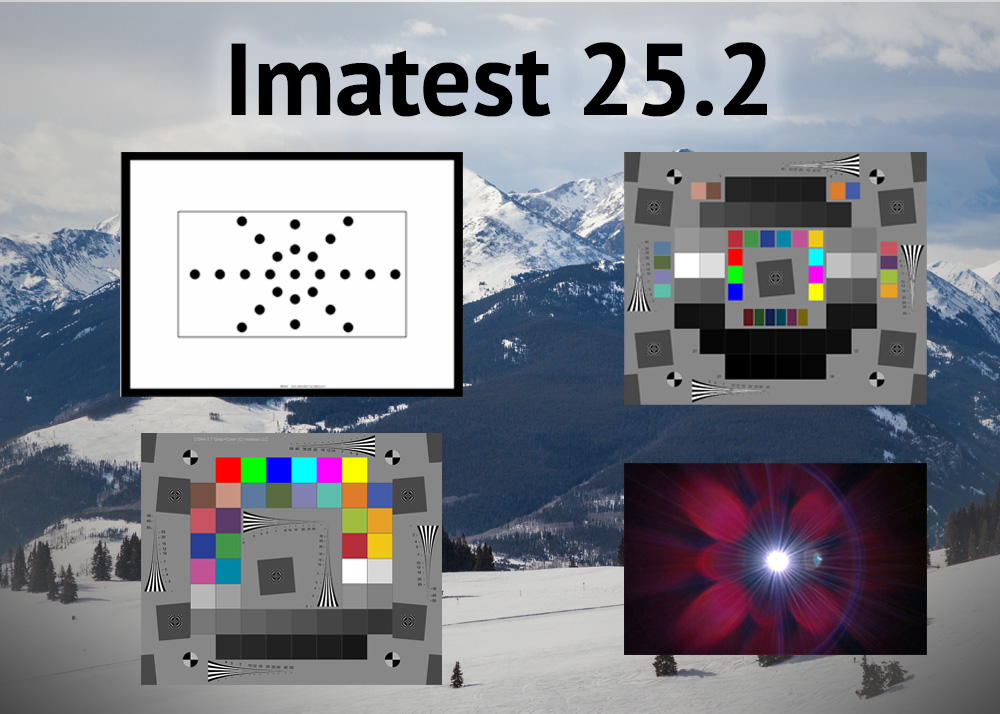
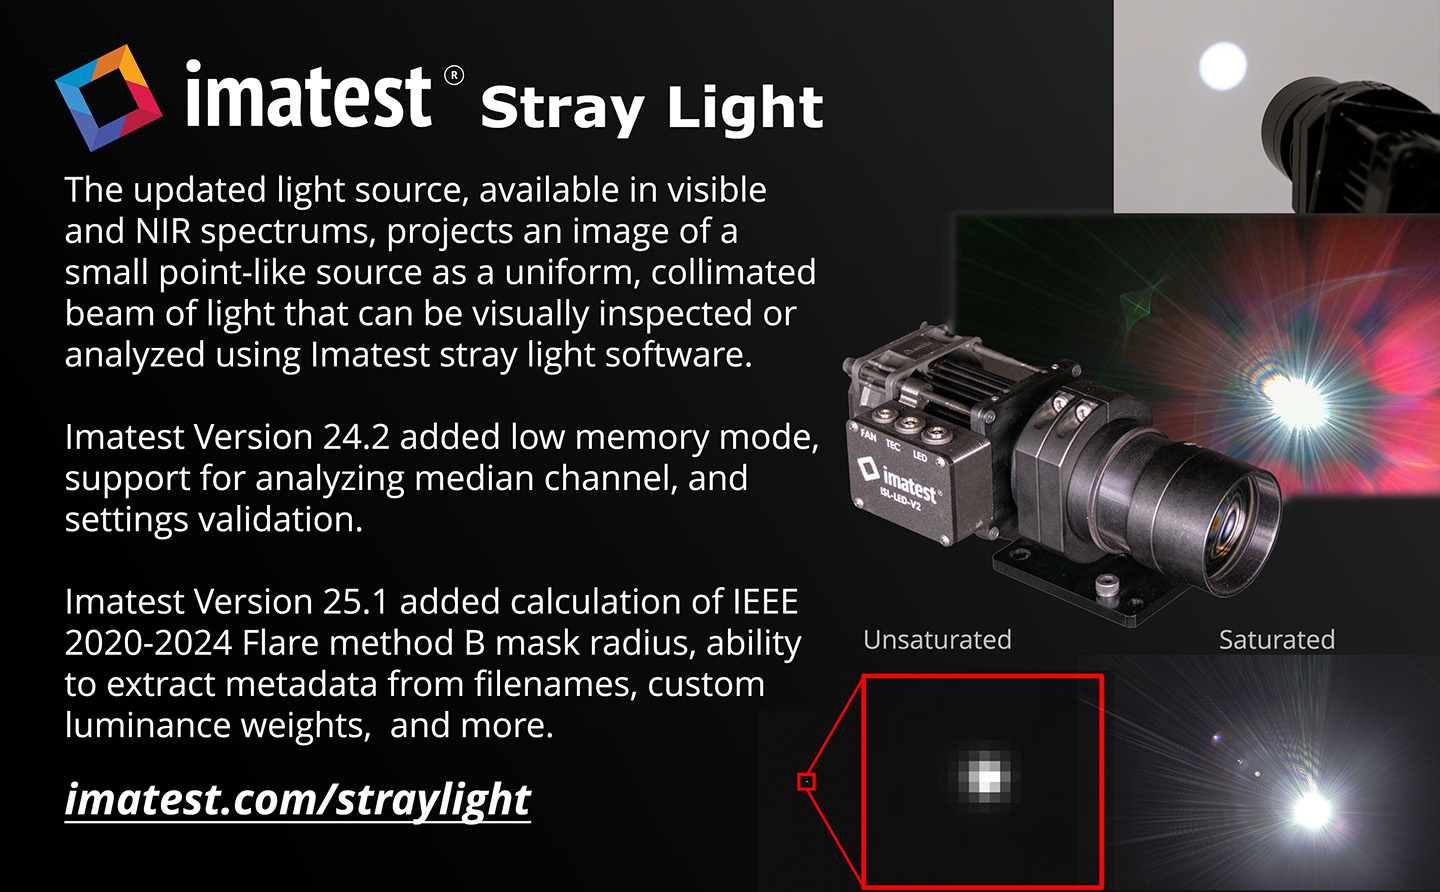
Support for IEEE 2020 Flare Method A, updated 36 Patch Dynamic Range, new ColorGray-44 target, Stray Light (Flare) Enhancements
Gamma Scientific RS-9
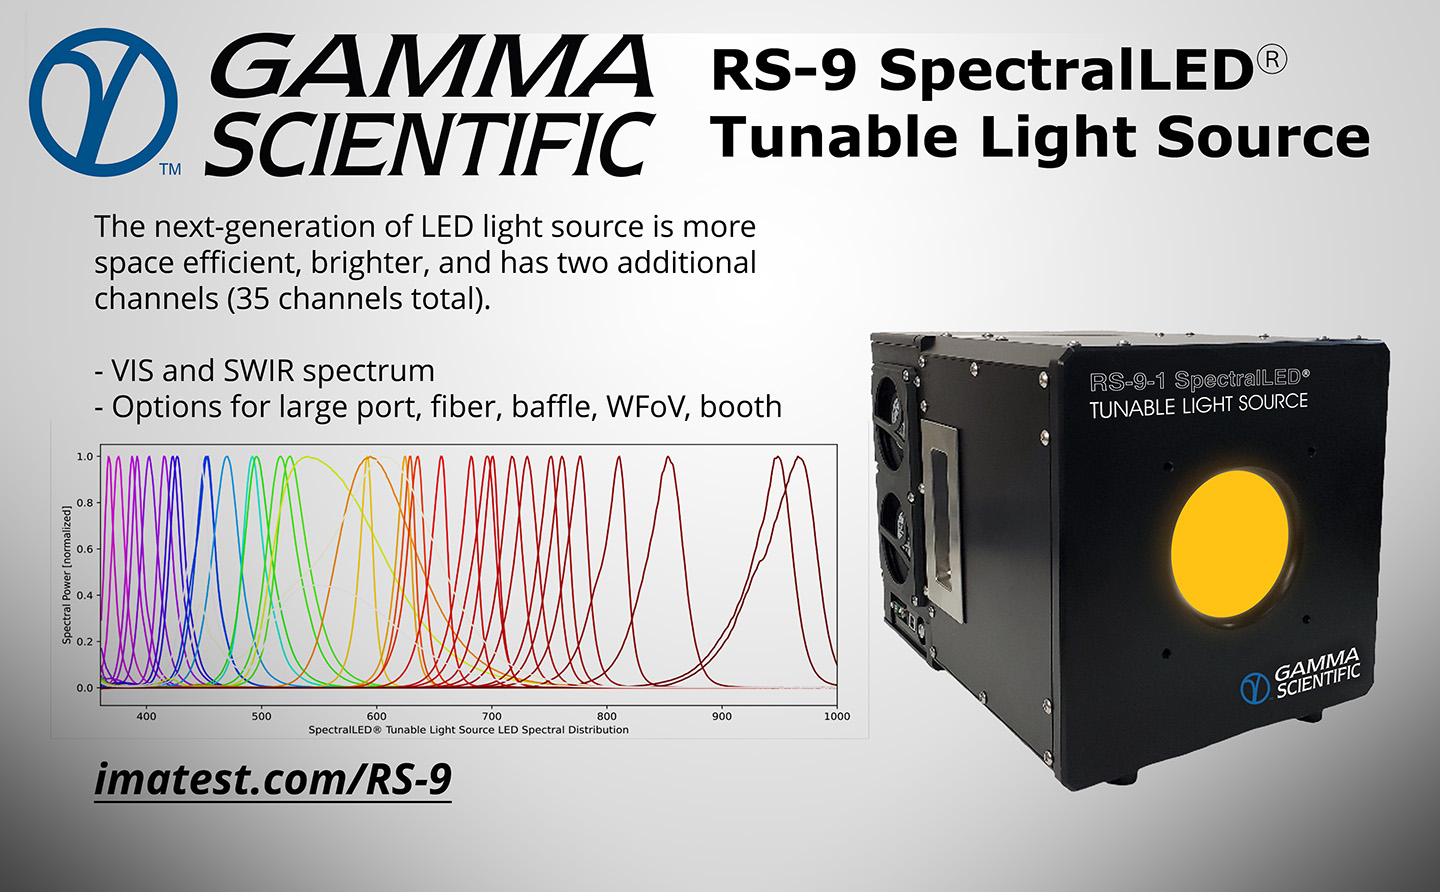
Gamma Scientific’s tunable light source has been upgraded to be more compact & brighter.
View Our Updated Brochure
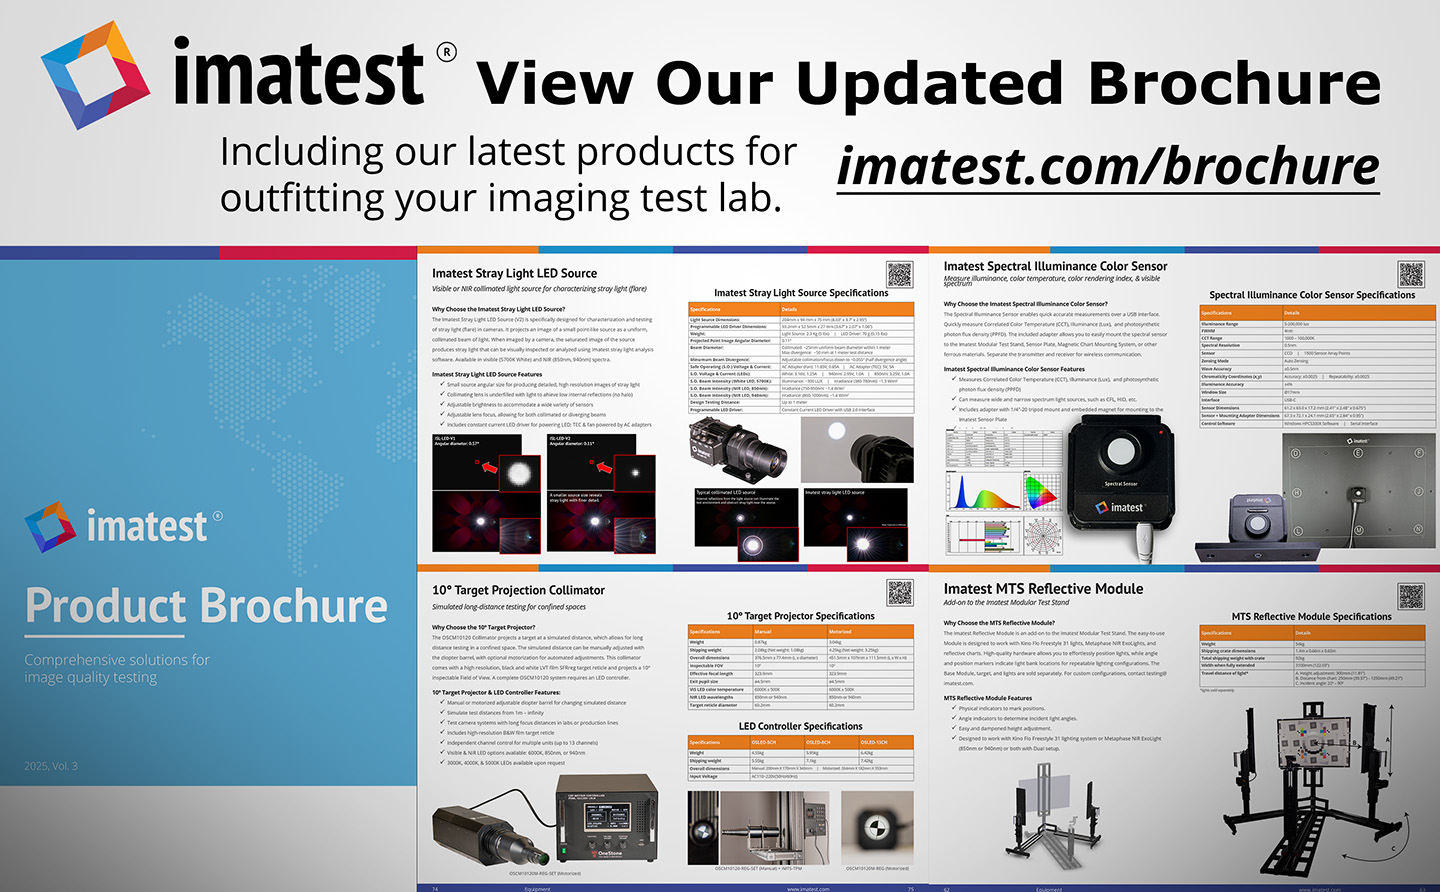
View Imatest’s updated 2025 Product Brochure