Imatest at Electronic Imaging 2023


Imatest is excited to attend Electronic Imaging 2023 in San Francisco, California! For the first time in three years, the conference will take place in-person January 15-19th. Imatest will have a strong presence, with several of our engineers giving talks and presentations. You can also check out our booth to talk with one of our expert engineers and watch a demo of our new stray light (flare) fixture. Click the drop-downs below to learn more about Imatest’s involvement (events listed in chronological order):

Monday, January 16, 2023, 10:40AM – Image Quality and Systems Performance (IQSP) Conference

The global impact of camera phones is multi-faceted, influencing technological advances, user interface design, cloud storage, and image sharing methodologies.  The sheer volume of camera phone ownership has dwarfed the existing number of digital still cameras as the camera phone market segment grew from tens of millions in early acceptance years in Japan to annual global sales volumes of over 1 billion for nearly 10 years and counting.  This has enabled and pushed forward revolutionary image quality advancement of the incorporated cameras in the multifunctional devices, progressing from 0.11MP image sensors with 2-inch displays in 1999 to current maximums of 200 MP sensors and 8-inch foldable displays.  This overview will provide example images and image quality metrics showing the progression over the past twenty years.  Content will also highlight significant technological advancements impacting image quality attributes such as resolution, low light performance, dynamic range, zoom, and bokeh.

Monday, January 16, 2023, 11:20AM – Image Quality and Systems Performance (IQSP) Conference

We describe a new calculation of camera information capacity, C, derived from standard 4:1 contrast ratio slanted edges, that takes advantage of an overlooked capability of the slanted edge that allows the variance and hence the noise of the edge to be calculated in addition to the mean. The average signal and noise power derived from the edge can be entered into the Shannon-Hartley equation to calculate the information capacity of the 4:1 edge signal, C[4]. Since C[4] is highly sensitive to exposure, we have developed a more consistent metric, C[max], derived from the maximum allowed signal in the file, making it an excellent approximation of the camera’s maximum information capacity. Information capacities C[4] and C[max] are excellent figures of merit for system performance because they combine the effects of MTF and noise. They have great potential for predicting the performance of Machine Vision and Artificial Intelligence systems. They are easy to calculate, requiring no extra effort beyond the standard slanted-edge MTF calculation.

Tuesday, January 17, 2023, 12:00PM – Autonomous Vehicles and Machines (AVM) Conference

Stray light (also called flare) is any light that reaches the detector (i.e., the image sensor) other than through the designed optical path. Depending on the mechanism causing stray light, it can introduce phantom objects (ghosts) within the scene, reduce contrast over portions of the image, and effectively reduce system dynamic range. These factors can adversely affect the application performance of the camera and, therefore, stray light measurement is to be included in the upcoming IEEE-P2020 standard for measuring automotive image quality. The stray light of a camera can be measured by capturing images of a bright light source positioned at different angles in (or outside of) the camera’s field of view and then processing those captured images into metric images with associated summary statistics. However, the setup and light source can have a significant impact on the measurement. In this paper, we present lessons learned and various technical elements to consider for stray light (flare) testing of digital imaging systems. These elements include the radiometric (e.g., brightness) and geometric (e.g., size) qualities of the light source and setup. Results are to be presented at the conference.

Wednesday, January 18, 2023, 5:30PM to 7PM – Imaging Sensors and Systems 2023 Interactive Papers Session

The EMVA 1288 Standard offers a unified method for the objective measurement and analysis of specification parameters for image sensors, particularly those used in the computer vision industry. Models for both linear and non-linear sensor responses are presented in the version 4.0 release of the standard, and are applied in the characterization of a commercial DSLR camera sensor. From image capture to analysis, this paper details the equipment, methodologies, and analyses used in the implementation of the latest standard in a controlled lab setting, serving as both a proof of concept and an evaluation of the presentation and comprehensibility of the standard from a user perspective. Measurements and analyses are made to quantify linearity, sensitivity, noise, nonuniformity, and dark current of the chosen sensor, according to the methods laid out in the EMVA 1288 standard. This paper details the realistic implementation of these processes in a controlled lab environment and discusses potential flaws and difficulties in the standard, as well as complications introduced by nonideal experimental variables.

Main Exhibit

Tuesday and Wednesday, January 17 and 18, 2023, Daytime

Imatest LLC, Thad Baringer

Learn more about the Imatest Stray Light (Flare) Fixture


Demonstration Session

Tuesday, January 18, 2023, 5:30-7PM 

Imatest LLC, Jackson Knappen, Meg Borek

The highly-popular symposium demonstration sessions provide authors with an additional opportunity to showcase their work.

Read More

Imatest Customer Profile: K. Tina Agnes Ruth

Mia

What do you do for work?


Tina

I am an Imaging engineer at E-con Systems. At E-con Systems we design and develop embedded cameras for several markets like industrial, retail, and medical domains. My role is to tune the Image Quality parameters and validate it against the standards available for specific target applications.

Mia

How long have you been using Imatest?


Tina

Our association with Imatest dates way back to 2008 where we had purchased our first Imatest Master license. We started using it for some of our customer projects back then. We then took it mainstream to validate all our camera products and it would be fitting to say that we have seen Imatest through its full evolution to what it is today.

Mia

What feature in the software do you find yourself using the most, or is your favorite?


Tina

We use Color accuracy, eSFR ISO, Uniformity and Stepchart modules quite frequently since they form the basis of our products’ IQ reports. One favorite feature that stands out is the multi-image mode which helps us to average the performance across multiple hardware’s of the same Image sensor.

Mia

Are you able to give a brief description of what you use it for?


Tina

Imatest has become an integral part of our product development process. As I mentioned, our products carter a wide variety of applications which require flexibility in terms of the parameters we tune and validate the IQ for. The latest eSFR ISO charts and the modular test stand has helped reduce the hassle of maintaining multiple charts and equipment. With shorter turnaround times for this IQ validation, at each step in our design process we can see the impact in IQ performance. The reports we generate are widely accepted across all the markets and act as true value add for our products.

Mia

Do you have any tips for new Imatest users?

Tina

The interactive models in Imatest i.e., color/tone interactive and Rescharts are great for beginners. These help the user build a better understanding of different possible outcomes and visualize the results better.


Thank you to Tina for participating!

Read More

Imatest Customer Profile: Russell Bondi

Mia

Could you go into detail about what you do for work?

Russ

Yes, I’m an image quality engineer at Skydio. I design, build, and then tune camera systems.

Russ

How long have you been using Imatest for?

Russ

I’ve been using Imatest for probably three years.

Mia

How did you find Imatest, or how did you get your start using it?

Russ

We worked with a fantastic vendor who did a lot of camera characterizations for us, and the output results were all Imatest–that kind of caught my eye. I enjoyed the analysis tools, and the data outputs were super helpful and easy to digest. I started picking it up and using it as well. A lot of it was through them and then our own team developed the tools. Basically, we saw a vendor, we liked what we saw, and we started to use it ourselves.

Mia

Great, well we’re happy to have you as a customer. Could you give a brief description of what you use it for?

Russ

Yes. We work with a lot of different types of customers that have different requirements, so understanding and measuring camera performance is a key part of what we do. Someone can come to us and say “Hey, we have a spec where we’re trying to see a dime at 2 meters” We can do that subjectively with images, but then we want to tie that back to a number and a specific measurement for designing our next generation of cameras. We’ll find out what camera can see the dime, we then measure it on Imatest charts using your software to analyze it, and come up with an objective number.

Russ

We can also determine how we are doing in regards to noise performance by measuring on your charts across the entire length of the project. When we first get our cameras, before they’re tuned, we measure the noise, the color, pretty much measure everything. Then on a weekly basis, we’ll measure it again, making sure that we’re not regressing and that we’re moving forward with improvement. So overall, we use it for a lot of different things. Some hardware stuff, and then also software stuff.

Mia

It seems like you’re using a lot of different kinds of modules in the software for different purposes. Is there any feature in the software that you find yourself using the most?

Russ

Feature in the software? There’s a multi ROI section basically where we can fill the field view with the target and get multiple points on the field. We can measure different portions of the lens, not just the center, but the corners or the edges to capture how sharp they are. This tool shows us multiple spatial frequencies that allow us to understand how we’re performing. We can look at MTF20 and MTF50 in the same space. Understanding the effective resolution of our models is important to us, so it’s really a handy tool.

Mia

Yeah, for sure. I haven’t heard anybody say that– it’s a great feature. It’s very helpful being able to pinpoint on the image what you want to actually analyze.

Russ

Another feature in the same module are “heat maps” that we use to show active alignments or centering our lens and the sensor. What that chart does is show where your peak focus is, and sometimes if your active alignment wasn’t done correctly, it’s not actually in the center, it’s actually off left a little bit, it allows us to create a feedback loop with our vendors.

Mia

Yeah, for sure. Do you have any tips for new Imatest users?

Russ

Yeah, we really enjoy using Imatest. We like how easy it is to get set up. There’s a lot of different ways to review the information, and not every test is the same. Being able to have a drop down menu with multiple ways to view it and then multiple metrics is super helpful. So if someone’s getting just starting on images, it’s really helpful to load some stuff in and go through each section and try to understand and digest what you’re seeing. Taking a day to go through the drop downs and familiarize yourself and using Imatest documentation to come full circle.

Mia

Definitely. That’s how I started using Imatest. I just started loading random charts in and fooling around with it. 

Mia

Thanks so much for doing this. It was really cool to hear from you.

Russ

All right. Thank you so much.

Read More

Fixed versus Interactive modules

Imatest has two types of analysis module: Fixed (in the left-most column of the Imatest main window) and Interactive (in the second column).
 
  • Fixed modules require all settings to be entered prior to running the analysis. Stored settings are read from imatest-v2.ini and can be changed by user input. Batches of images can be run. Results are displayed as figures and can be saved as image (usually PNG), CSV, XML, and JSON files. In most cases we recommend running an interactive analysis prior to running  fixed analyses. 
  • Interactive modules are run from Graphic User Interfaces (GUIs) that allow results to be queried and modified after the analysis has been run. This allows you to explore results in great depth. Results can be saved as image (usually PNG), CSV, XML, and JSON files.

Classic GUI:  Fixed modules (first column), Interactive modules and postprocessors (second column)

New GUI:  Use toggle below analysis thumbnail to select Interactive or Fixed – Auto (batch) mode.


Fixed vs. Interactive module summary

Fixed
Interactive
Usually run after settings have been made and tested in interactive mode. It’s generally best to run in Interactive mode first — to explore results in depth and make sure calculations are properly set up.
Graphic results in Figures allow limited manipulation (zooming or rotation for 3D images). Graphic results displayed in GUI windows allow a high degree of manipulation: You can change calculation and display settings and you can select any available display. You can analyzed results in great depth.
Batches of files can be run. Only a single file can be analyzed (one exception: several files can be combined (signal-averaged) to improve signal-to-noise ratio (SNR)).
Most are available as Industrial Testing (IT) modules (EXE or DLL programs that can run in production/quality control environments). Not directly available in IT.
Images must be read from files. They cannot be directly acquired. Images can be read from files or acquired directly from devices (development boards from Aptina, Omnivision and others as well as devices supported by the Matlab Image Acquisition toolbox). Directly-acquired images can be continuously refreshed in realtime.


Most (but not all) Imatest modules have corresponding Fixed and Interactive versions.
Corresponding Interactive and Fixed modules
Interactive module
Fixed module
Notes
Rescharts

Interactive interface for several sharpness modules.

SFRplus Setup

eSFR ISO Setup

SFRreg Setup

Checkerboard Setup

All settings must be made in Rescharts ([module name] Setup). When run in Auto mode, these four modules are highly automated (with automated region detection based on criteria set in Rescharts), requiring no user input.
SFR Fixed SFR can analyze several regions (ROIs); Rescharts SFR can only analyze a single region.
Random/Dead Leaves  
Log F-Contrast  
Star  
Wedge  
Focus Score Plus Obtain a relative sharpness measurement from regions of arbitrary images. Most useful with direct image acquisition, typically with realtime focusing.
Color/Tone Interactive

Analyze a large variety of color and grayscale charts.

Color/Tone Auto Can analyze a large variety of color charts, including the Colorchecker 24-patch and SG, the DSC Labs ChromaduMonde, the IT8.7, and many others (all charts supported by Multicharts). Much more versatile than the older (fixed-only) Colorcheck module, which worked with the 24-patch Colorchecker only.
Can analyze a large variety of grayscale charts, including the Q-13/Q-14, ISO-14524, ISO-15739, Imatest 36-patch Dynamic Range chart, and many more. Much more versatile than the older (fixed-only) Stepchart module.
Flatfield Interactive Flatfield Settings made in either module are used by the other. Blemish Detect capability is included.


Example

Here are results from eSFR ISO run in the Rescharts interface (eSFR ISO Setup). While the Rescharts interface is active, you can select any of twenty different displays from the Display dropdown menu on the right/ Display settings can be selected by the nearby buttons (dropdown menus, checkboxes, sliders, etc.). Most of these settings are used to control the display in the fixed run (eSFR Auto) shown below. See full instructions in Using eSFR ISO

eSFR ISO 3D Plot in Rescharts interactive mode (eSFR ISO Setup)

Here are similar results from a fixed eSFR ISO run. Very little can be done to manipulate this plot, but by pressing Tools, Rotate 3D, you can rotate the view. The advantage of the fixed modules is that you can run images (including large batches of images) quickly, without fussing with the settings (which you’ve already done in the interactive run).

eSFR ISO 3D Plot in Fixed mode (eSFR ISO Auso)

Read More

Imatest releases new Version 22.2

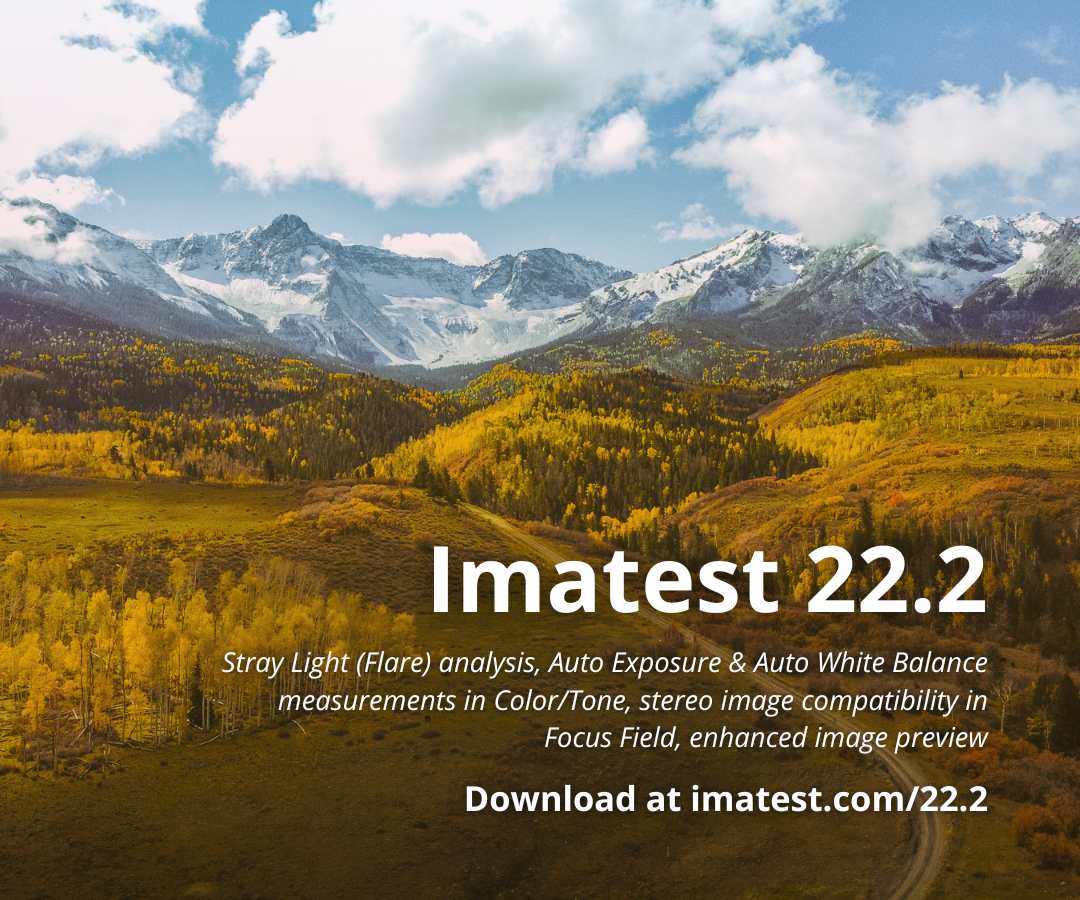
11 October 2022, Boulder, CO. Imatest releases version 22.2 with new updates and features including Stray Light (Flare) Analysis, Auto Exposure and Auto White Balance measurements in Color/Tone, Compare two images for 3D (stereo imaging) compatibility in Focus Field, and Enhanced image preview. 

Read More

Imatest Customer Profile: Pawel Achtel, ACS

This month, we have a very special customer profile. We had the chance to chat with Pawel Achtel, a cinematographer for the Avatar movies. Check out what he has to say and how he uses Imatest:

Mia

What do you do for work?

Pawel

That’s a tough question because I do a lot for my work. I’m a cinematographer, but also I’m a scientist and inventor. Within cinematography, I not only film images, but I also edit images that I produce. So it’s very difficult to pigeonhole me.

Mia

Is it just you doing everything?

Pawel

Not everything. We’ve got a few teams actually doing different things with the development of cameras. It was just too much for me to do everything and just not possible to do it in such short period of time. It’s definitely a team effort.

Mia

Very cool. How long have you been using Imatest?

Pawel

probably about 20 years. I still have a version that I run on Windows XP virtual machine–so it’s more than since Windows XP.

Mia

Wow, I don’t hear that a lot. You’ve been using it since the beginning, because we’ve been around for about 20 years now.

Pawel

Yes!

Mia

What feature do you find yourself using the most? Perhaps one that you gravitate towards for your work, or one that you found works really well for what you’re doing?

Pawel

So with the work that I do, I’m a little bit obsessed about image sharpness. I’ve been using the MTF and SFR sort of workflow. That’s 90% of what I use Imatest for.

Mia

That one’s definitely good for sharpness. Do you have an example or a use case?

Pawel

There are several use cases, but I do a lot of filming underwater. A limiting factor to image quality is the glass, or the optics. Not many people know that we’re only getting about standard definition quality through just a flat piece of glass simply because of the chromatic aberrations, distortions, astigmatism, and all sorts of other problems associated with it. With the new digital cameras, there’s obviously a big disparity between what glass can produce and what the camera can record. For almost a decade, I’ve been trying to get that optical sharpness up. The only way to do it is to compare it, and in order to compare it, you need to quantify it. I’ve collected a large number of underwater submersible lenses, which are lenses that are designed to produce sharp pictures underwater, but they don’t produce sharp pictures on land. I have inventory of well above 100 lenses. For every lens, I shoot several SFR charts and measure sharpness in the center, mid-frame, edge and corners. This is to be able to cherry pick the lenses.

Pawel

I do a lot of modifications to adapt the lenses for digital sensors, and again, the best way to make those modifications is to be able to test whether you’re actually improving or whether you’re making things worse. All those lenses have MTF charts for many points in a frame, and I can pick up the lens that I think performs best in particular circumstances. So I’ve been using those workflows a lot more recently. I have a test lens that’s extremely sharp–a Sigma 135mm lens. I use that lens as a baseline to compare different digital services and measure the MTF of the actual sensor. That’s only in the center of the frame because the sensor is uniform and the lens performs best in the center of the frame. Those are two main areas that I’ve been using it for.

Mia

Yeah, well, that’s really cool to hear. Cool to hear you are using Sigma lenses too, at least for your baseline test. Those are my favorite.

Pawel

It’s a lens that I actually have. I also have been using a lot of ARRI signature price recently, but they are expensive lenses; they also could be used as a baseline. I just don’t have access to them every day.

Mia

Awesome. How did you get started in imaging science or imaging in general? I know that you said you’re a cinematographer, but you’re also a scientist, engineer, and inventor. What sparked your interest?

Pawel

I’ve been lucky. I had very good general education and I studied, actually, civil engineering, but with a very solid background in physics that allows me to pretty much do anything. With the interest more like a hobby, photographing and filming things sort of turned into a profession that was very much based in science.

Mia

Yeah, I definitely agree. I started out just photography as a hobby, and now here I am. I delved into the scientific aspect of it. It’s really awesome.

Pawel

It’s much easier to turn scientists into very good photographers or cinematographer than teach cinematography with all the math and physics behind it.

Mia

I think especially if you already have that scientific background, it might be easy to translate or throw the artistic aspect into it.

Mia

How did you find Imatest?

Pawel

As I said, I always wanted to improve things. It’s a sort of driver that keeps me going. As I said, if you want to improve something, you need to be able to compare it–you can’t compare it unless you can quantify it. I was on a lookout for ways of analyzing images and at the time there was not much else other than Imatest. Now there are some other packages that claim to do a lot of things that Imatest does, but they’re just not as robust. I think having that history and ability to improve things over time makes it a clearer choice.

Mia

For sure. Maybe I’m biased because I work here and I use it, but yeah, Norman and Henry Koren are so smart and they know so much about image quality. I can understand why it is pretty robust and we’re always looking for ways to improve.

Mia

Are there any other challenges that you faced with image quality testing related to your work?

Pawel

Well, recently with the development of this new camera, we found that we can produce really high resolution images. What I mean by that is we can produce 260 megapixel motion picture, which is 18.7K by 14K resolution. To be able to analyze those quickly and efficiently is certainly a challenge. In the past, I needed to crop to smaller size and analyze bit by bit because it’s quite large.

Mia

Wow, that’s huge!

Mia

That’s all the questions that I have. I know you worked on the new Avatar movie, which is so spectacular.

Pawel

Actually, I had to analyze more than 40 lenses. Every single lens was put on an underwater optical bench with an SFR chart on it. I would shoot several tests and bring them into Imatest to analyze. Those lenses were not just cherry picked for their sharpness, but also for uniformity across the frame. Also, because Avatar was actually shot in 3D underwater, I needed to match those lenses. The two lenses that I actually matched have very similar characteristics, but mirrored because the lenses go on a beam splitter. One lens shoots through a half mirror and one lens bounces off a half mirror, creating two separate images. In order to match those lenses, you’re actually looking for mirrored characteristics in those lenses, but no lens is perfectly symmetrical. I’ve got the lenses in a special box labelled Avatar in case they want to shoot more in the water.

Mia

like I said, it’s really spectacular. I remember seeing the first movie and thinking, “oh, my gosh, this is so beautiful,” and now there’s another coming out. I can imagine it’s going to be very cool.

Pawel

There’s never been a film shot in such way before. The team used, which was my invention, a submersible beam splitter. Prior to this, people were using beam splitters that were housed in underwater enclosure. This is completely different. This beam splitter is completely flooded, and the reason is because it avoids any glass in between. So, there is no limit in resolution. There’s also absolutely no distortions through it, so what you’ll see is images that are completely different. When we first saw those images on set we were like, “Is that underwater? Is that on land?” It just looks unreal. It was underwater, but there’s no distortion. And the peripheral vision is so sharp, crisp, and vivid that is so immersive and just creates this very unique experience.

Mia

I’m very excited to see it, and everybody at Imatest is also excited. We’re happy to be able to work with you and to be able to help with anything. Thank you so much for meeting with me. It’s been a pleasure!

Pawel

Thanks, Mia. Nice talking to you.

Read More

Imatest wins Best Validation Simulation Tool award at AutoSens Brussels 2022

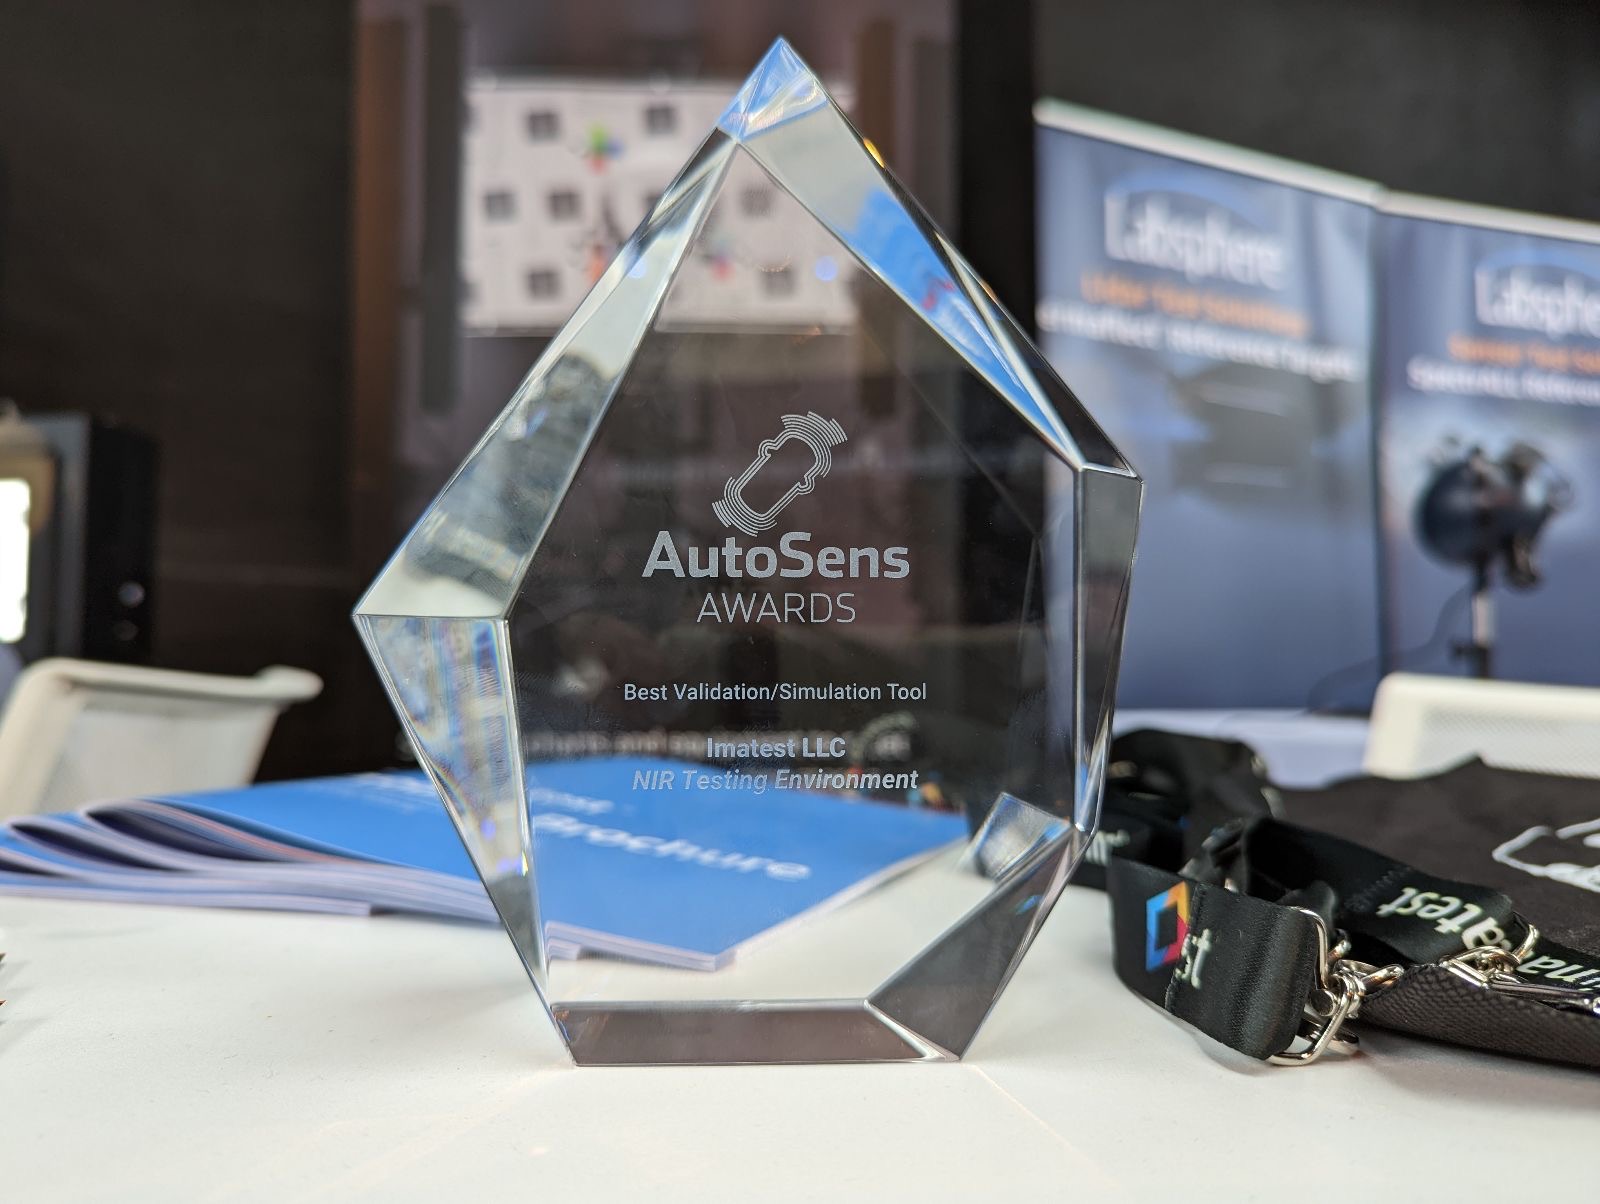
Imatest is excited to announce we were awarded Best Validation Simulation Tool for our software and charts at AutoSens Brussels 2022. These awards celebrate the best and brightest working at the cutting-edge of innovation in ADAS and autonomous vehicle technology. View the full list of winners here: https://auto-sens.com/events/awards/

Read More

Imatest Releases Stray Light (Flare) Analysis with Upcoming Version 22.2

September 13th, 2022, Brussels, Belgium, and Boulder, CO. Imatest announced at AutoSens Brussels the release of its new stray light (flare) testing solution, available with Imatest version 22.2. 


Stray light, also known as flare, is any light that reaches the detector (i.e., the image sensor) other than through the designed optical path. Stray light can be thought of as systematic, scene-dependent optical noise. Depending on the mechanism causing the stray light, it can produce phantom objects within the scene (i.e., ghosts/ghosting), reduce contrast over portions of the image (e.g., veiling glare), and effectively reduce system dynamic range. These factors can adversely affect the application performance of the camera in a wide variety of applications including automotive, security, machine vision, and consumer electronics, and is addressed in the upcoming IEEE P2020 standard. The Imatest stray light testing setup allows users to measure stray light for imaging systems.

(more…)

Read More

Imatest Customer Profile: Fabrizio Ghetti

Mia: What do you do for work?

Fabrizio: My job is now video expert in Italian R&D department of Avaya. I lead the video lab that evaluates and measures the image quality of Avaya and Konftel equipment. I started evaluating video conferencing imaging 35 years ago when the Italian company Aethra pioneered the study of still image transmission in telecommunications and, at that time, mobile phones were completely different from the smartphones we use today. The camera we used in the beginning to capture images on computers had very big dimensions and a completely different technology, because both displays and cameras used cathode ray tubes to view and capture images. I have since remained responsible for assessing the quality and specification of videoconferencing imaging and have worked as the head of the video lab for Aethra, Radvision, Konftel and Avaya. In these years, I traveled to Asia among manufacturers of cameras and optics of different types, evaluating the different methods of video testing of the various laboratories.

Mia: As somebody who works with video, that’s really cool to hear. I work with video on the other side of it with production for Imatest marketing. It’s amazing to hear just how far imaging goes.

Fabrizio: Yes, being one of the pioneers, I have seen a lot of technology pass in front of me. We started from the NTSC Signal standard for the US or PAL/SECAM for Europe, to the present 4K, and now in the video communication market we are starting to use even higher resolutions with image sensors up to 50 MPixel, while the technology of mobile phones begin to use 200 MPixel image sensors. Even though I have seen a lot of technology, the concept of image quality remains the same and Imatest remains an important part of my work.

Mia: How long have you been using Imatest software?

Fabrizio: I think I started to use Imatest in 2013. I remember the version 3.10. When I started using Imatest, I not only abandoned the use of the other methods, but I used it with our subcontractors because it’s a good reference. It is important to align the two labs remotely and locally.

Mia: Awesome. Next question: what feature in the software do you find yourself using the most?

Fabrizio: I use a lot of parts of Imatest, but mainly we can say that I concentrate my activity on resolution. So SFR; the test for measuring resolution on your screen and also geometry of the image, the angle of view, and the distortion. The next step is to evaluate the exposure using the step chart. For example, for control of the brightness, contrast, or the color checker to evaluate color occurrences using different illumination types. Of course I also use the Imatest Lightbox to use the lens shading correction so the compensation of the reduction of illumination in the corner. And with this one I can also check the dynamic range. I use the 36 patch low dynamic range chart to evaluate the wide dynamic range. So this is mainly what I use normally.

Mia: Yeah. You’re pretty much using a lot of our charts, especially some good ones to cover all your needs. Well, it’s been really great speaking to you and thank you for all of your insight in the industry regarding video. It’s always very special to be able to interact with customers and hear just how much they’re making an impact in the industry. Thank you very much.

Fabrizio: I wish you a very nice day and good luck in all of your activities. Thank you for your time.


Update: As of November 2022, Fabrizio is now working at Jabra, working in video communications for the R&D department.

Read More

Renew expired support through year-end and save 40%

Maintaining current support on your Imatest license provides access to all new version releases and priority technical assistance from our team of experts. If you have a license with expired Support, renew in through year-end at the In-Support rate and save 40% off the After Expiry renewal price. Take advantage of this offer to access our latest release and all updates for one year. Or transition to a Subscription license and save 30% off the annual subscription price.

Learn more about our newest software features and updates: www.imatest.com/micro_site/imatest_updates/

Read More

Imatest Customer Profile: Naveen Koul

Mia: The first question is what do you do for work?

Naveen: I’m an image quality engineer. I work mainly on tuning and image quality verification and validation. At present, I’m associated with Nuro.

Mia: How long have you been using Imatest?

Naveen: I have been using Imatest since around 2008.

Mia: Wow, awesome. What feature in the software do you find yourself using the most, or one that you usually gravitate towards?

Naveen: I have mostly used all the features across Imatest. But some features I use are the high dynamic range and noise ones, which are very interesting features Imatest has. Apart from all image quality features, Imatest provides a lot of data in the CSV files and the JSON files, which is quite useful.

Mia: For sure. Do you have any tips for people who are just beginning to use Imatest?

Naveen: Yeah, there’s a lot of very good documentation Imatest provides. Also, I’ve seen a lot of video lectures on YouTube for a beginner to start with and understand the tool well. I will advise, there is a lot of stuff in the CSV and the JSON files which does not get displayed on the images. That is really great data to look at that gives a lot of information about the image quality other than what the output saved images is.

Mia: Yeah, that’s a great bit of information. I make the videos for Imatest that you see on YouTube or on our website, so it’s good to hear they’re helpful. That’s a great idea for a video; showing people how to interpret the JSON files. Thank you so much for doing this!

Naveen: Sure. Thank you.

Read More

Imatest Internal Photo Contest Winners

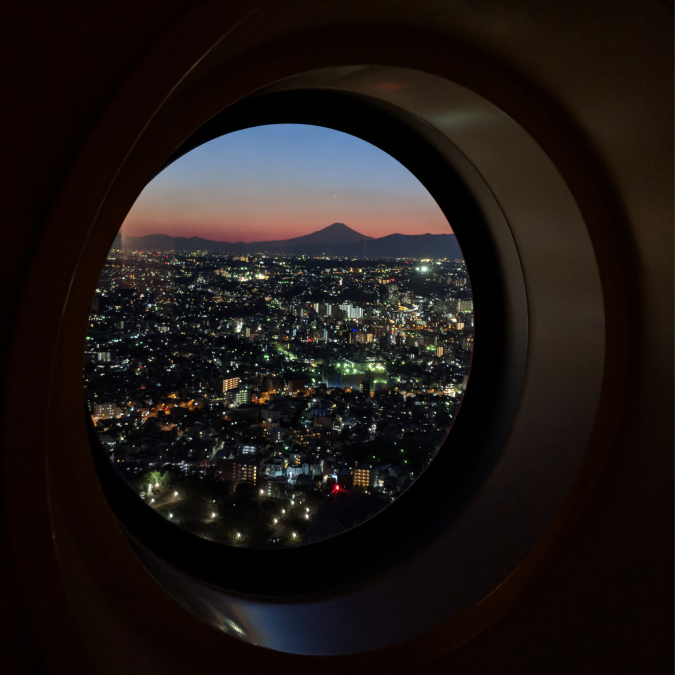
We are happy to showcase the winners of our internal photo contest. Judged by Nasim Mansurov of photographylife.com, our team submitted over 150 images across 5 different categories. Congratulations to our winners!

Best in Show: Jonathan Phillips

(more…)

Read More

Imatest announces new Target Generator Library

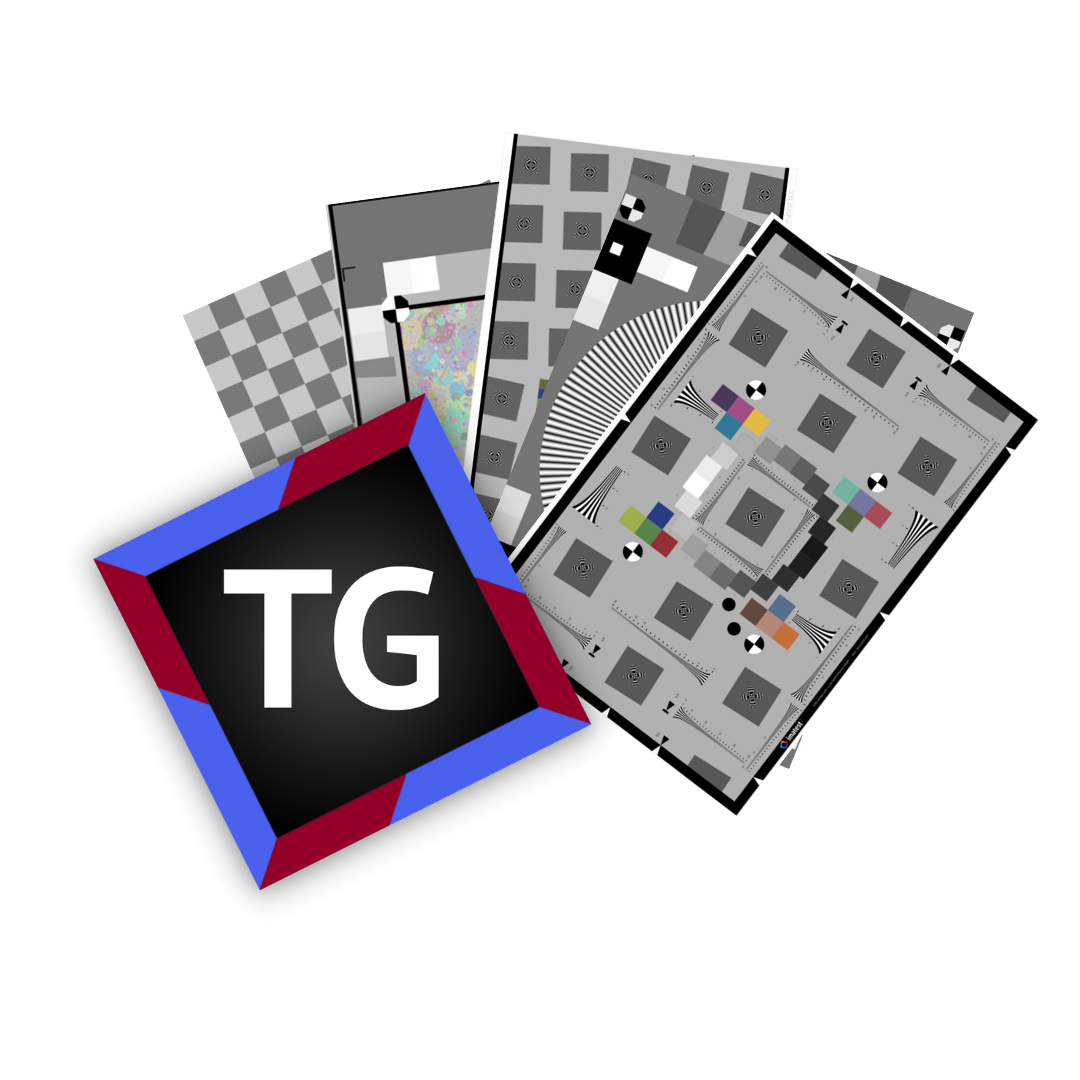
We are happy to announce the release of the new Target Generator Library today. The Imatest Target Generator is free software that will facilitate rapid, iterative lens and camera design by enabling simulations that can help a designer make better informed decisions about what components are appropriate  in advance of costly prototyping phases.


The new Imatest Target Generator provides virtual chart solutions. Quantitative and qualitative results from applying ray tracing, noise effects, and image signal processing to virtual charts aid engineers in communicating the impact of various lens and camera design parameters. Image quality deficiencies can be observed and mitigated using a virtual chart during the simulation phase. Virtual charts can aid engineers in comparing and resolving discrepancies between designs and builds. (more…)

Read More

Correlating the Performance of Computer Vision Algorithms with Objective Image Quality Metrics

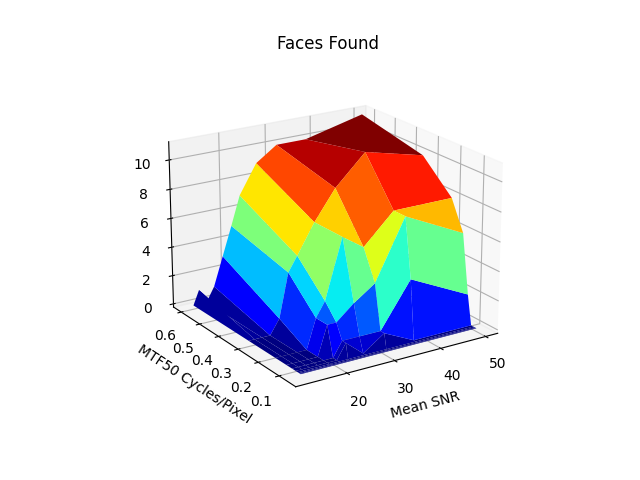
by Henry Koren

1. Why care about the quality of your cameras?

The task of computer vision (CV) involves analyzing a stream of images from an imaging device. Some simple applications such as object counting may be less dependent on good camera quality. But for more advanced CV applications where there is limited control of lighting & distance, the quality of your overall vision system will depend on the quality of your camera system. This is increasingly important when an error made by the vision system could lead to a decision that impacts safety. Along with proper optimization of a CV model, ensuring that that model is fed by imagery from a high-quality camera system is critical to maximizing your system’s performance.
(more…)

Read More

Imatest announces new partnership with Edmund Optics

Imatest is proud to announce a new partnership with Edmund Optics.

The partnership will enable customers to seamlessly buy Imatest software and charts via Edmund Optics’ website, and will help both Imatest and Edmund Optics customers develop quality optical systems.

(more…)

Read More

Detecting traffic lights with RCCB sensors

RCCB (Red-Clear-Clear-Blue) sensors are widely used in the automotive industry because their sensitivity and Signal-to-Noise Ratio (SNR) is better than conventional Bayer (RGGB) sensors. But the improved sensitivity comes at a price: reduced color discrimination, which can make it difficult to distinguish traffic light colors.

We have seen an image where the red and yellow colors were indistinguishable. We have determined that the cause was saturation in the Red channel. We don’t know whether this happened during image capture or image processing: it might have been caused by a Color Correction Matrix (CCM) that attempted to replicate normal RGB colors.

We present a simple set of equations for optimal discrimination between Red, Yellow, and Green lights.

Nomenclature and assumptions

Y is for Yellow, rather than the usual Luminance channel.

C stands for Clear (R+G+B), rather than Cyan.

We assume that the channel has been white balanced (the R and B channels multiplied by a coefficient) so that R = G = B is neutral gray or white.

For the equations to be valid, none of the channels (R, C, or B) can be saturated — either during image capture or after image processing. This was not the case in the image we saw where red and yellow were indistinguishable. The red channel was saturated, which caused it to be weaker than expected in relation to the green channel, leading to the detection failure.

Color channel equations

The Red (R) and Blue (B) channels are derived directly from the image sensor, likely with a multiplier (coefficient) for white balance.

Green (G) and Yellow (Y) are derived from equations:

G = C – R – B

Y = R + G = R + C – R – B = C – B

Single color (detection) channel equations

Generally, a single-color channel (i.e., a detectable color) is the color value minus the values of the other channels. Here are the equations for the three channels needed for traffic light detection.

Rdet = R – G – B = R – C + R + B = 2×R – C

Gdet = G – R – B = C – 2×R – 2×B

Ydet = G+R-B – |G-R| = C – R – B + R – B – |C-R-B-R| = C-2×B – |C-B-2×R|

The detected color is the one from the largest value of {Rdet, Gdet, Bdet}.

Some caveats

  • These equations have not been checked by my (NLK’s) colleagues and they have not been tested experimentally.
  • They do not work if any of the channels are saturated. Avoiding saturation can be difficult with standard sensors where the light is much brighter than the surrounding scene.
  • If a realistic result is needed (typically for human vision), it should be passed through a separate channel (often with a CCM applied).
Read More

Imatest Customer Profile – Dr. Brian Deegan

Imatest is happy to introduce customer profiles! Each month, we will interview one of our Imatest users to share why they use the software and create a sense of community among our users. Interested in being featured? Reach out to mia@imatest.com.


The first customer profile is Dr. Brian Deegan. Based in Ireland, Brian is a long-time user who has utilized the Imatest software across multiple disciplines. Read more about our interview with Brian:


Mia: How long have you been using Imatest?

Brian: It must be ten years now at this stage. I started at Valeo in 2011 and have used it throughout my entire career there. I started in university this year and I’m still using it.

Mia: Awesome. And you’re still using it now that you’re at the university?

Brian: Yeah, not as much and not as much directly, but one of the PhD students here is using it as part of this project.

Mia: That’s very cool. Segueing into the next question, what do you do for work?

Brian: I used to work for Valeo vision systems and that’s how Norman [Koren], Henry [Koren], and the team would know me. I was working in automotive image quality, so everything from simple backup cameras to surround view cameras, mirror replacement cameras, cameras for autonomous driving; everything to do with that. In my career I was primarily responsible for, I suppose, image quality, assessment tuning and optimization. So, everything from measuring the sharpness and noise performance of the cameras to trying to get the best image quality for reviewing, machine vision, and performance; that kind of thing.

Mia: What feature in the software do you find yourself using the most or kind of what’s been your favorite feature, if that’s the avenue you want to take it in?

Brian: Yeah, sure. The most common ones that I’ve used would have been the SFR test for measuring the sharpness of the cameras. I’ve used that quite a bit. The step chart tools for measuring color accuracy with the color checker charts as well. I’ve also used the uniformity measurement quite a bit for measuring the color and shading uniformity of lenses. So, those that have been the ones that I’ve used most commonly. There are other ones I’ve used as well for measuring aliasing using the wedge targets, and I use some of the newer ones for the ISO-16505 standard. I do use some of the dynamic range measurements and some of the CPIQ measurements–less often, but I do use those too.

Mia: Well that’s very cool. It seems like you got to cover a lot of the software.

Brian: Yeah. I know that you mentioned features that that I liked: I like the chart order feature. So obviously yours is everywhere, Imatest manufacturers test targets. But every now and again it’s nice to just print off a chart, quick and dirty, for doing quick tests. The chart order function has proved very useful over the years. Another one that’s nice—it’s basically an image quality simulator where you can simulate different MTF curves for illustration and demonstration purposes.

Mia: Cool, thank you. Being that you’re in the image quality industry directly, is there any direction you’d kind of like to see Imatest go?

Brian: Not particularly as such. In terms of image quality assessment, there’s only a handful of companies that are involved, and Imatest is one of the leaders in the area. I’ve given feedback over the years as time has gone by. But you know, a team like Norman and Henry, and even Paul Romanczyk, they go to the standards meetings and are heavily involved. Whatever is going on in the industry, Imatest has had people that are either at the conferences or involved with the standards. So I think in terms of the developments that are going on in the industry, it’s safe to say Imatest has a reasonable, good finger on the pulse from that point of view. In terms of features and stuff like that, I suppose a couple of years ago I would have said that Imatest weren’t as good as some of the competitors in terms of some of the hardware, Imatest was more refined for targets and software. However, that gap has closed in the last few years.


Thank you to Brian for his valuable feedback and participation!

Read More

Imatest Releases Version 22.1

Imatest Version 22.1 introduces new features including Automatic Chart Identification, Internationalization, ISO 12233 Standards Support, Sagittal/Tangential MTF Plot Updates, and more. (more…)

Read More

Imatest partners with SphereOptics

Imatest is proud to announce our new authorized reseller with SphereOptics. Based in Germany, SphereOptics is a major supplier of technical equipment for the photonics industry. To learn more about our other partnerships and resellers, visit our about page.

Read More

Scene-referenced noise and SNR for Dynamic Range measurements

The problem in the post on Dynamic Range (DR), DR is defined as the range of exposure, i.e., scene (object) brightness, over which a camera responds with good contrast and good Signal-to-Noise Ratio (SNR). The basic problem is that brightness noise, which is used to calculate scene SNR, cannot be measured directly. The scene SNR must be derived from measurable quantities (the signal S, typically measured in pixels, and noise, which we call \(N_{pixels}\)).

The math In most interchangeable image files, the signal S (typically in units of pixel level) is not linearly related to the scene (or object) luminance. S is a function of scene luminance Lscene, i.e.,

\(\displaystyle S = f_{encoding}(L_{scene})\)

Interchangeable image files are designed to be displayed by applying a gamma curve to S.

\(\displaystyle L_{display} = k\ S^{display\ gamma}\)     where display gamma is often 2.2.

For the widely used sRGB color space, gamma deviates slightly from 2.2.

Although fencoding sometimes approximates \(L^{1/(display\ gamma)}\), it is typically more complex, with a “shoulder” region (a region of reduced slope) in the highlights to help improve pictorial quality by minimizing highlight “burnout”.

Now suppose there is a perturbation \(\Delta L_{scene}\) in the scene luminance, i.e., noise \(N_{scene}\). The change in signal S, ΔS, caused by this noise is 

\(\displaystyle \Delta S = \Delta L_{scene} \times \frac{dS}{dL_{scene} } = \ \text{pixel noise} = N_{pixels} = N_{scene} \times \frac{dS}{dL_{scene} }\)

The standard Signal-to-Noise Ratio (SNR) for signal S, corresponding to Lscene is

\(\displaystyle SNR_{standard} = \frac{S}{\Delta S} = \frac{S}{N_{pixels}} \)

SNRstandard is often a poor representation of scene appearance because it is strongly affected by the slope of S with respect to Lscene ( \(dS/dL_{scene}\)), which is often not constant over the range of L. For example, the slope is reduced in the “shoulder” region. A low value of the slope will result in a high value of SNRstandard that doesn’t represent the scene. 

To remedy this situation we define a scene-referenced noise, Nscene-ref, that gives the same SNR as the scene itself: SNRscene = Lscene / Nscene. The resulting SNR = SNRscene-ref  is a much better representation of the scene appearance. 

\(\displaystyle N_{scene-ref} = \frac{N_{pixels}}{dS/dL_{scene}} \times \frac{S}{L_{scene}}\)

\(\displaystyle SNR_{scene-ref} = \frac{S}{N_{scene-ref}} = \frac{L_{scene}}{N_{pixels}/(dS/dL_{scene})} = \frac{L_{scene}}{N_{scene}} = SNR_{scene} \)

SNRscene-ref  = SNRscene is a key part of dynamic range (DR) calculations, where DR is limited by the range of illumination where SNRscene-ref  is greater than a set of specified values ({10, 4, 1, 1} = {20, 12, 6, 0 dB}, which correspond to “high”, “medium-high’, “medium”, and “low” quality levels. (We have found these indications to be somewhat optimistic.)

\(\log_{10}(S)\) as a function of\(\text{Exposure in dB} = -20 \times \log_{10}(L_{scene}/L_{max})\)is displayed in Color/Tone and Stepchart results. (Color/Tone is generally recommended because it has more results and operates in both interactive and fixed, batch-capable modes). \(dS/dL_{scene}\) is derived from the data used to create this plot, which has to be smoothed (modestly — not aggressively) for good results. Results from the JPEG file (the camera also outputs raw) are shown because they illustrate the “shoulder” — the region of reduced slope in the highlights. 

Panasonic G3, ISO 160, in-camera JPEG, run with Color/Tone Auto (Multitest). Note the “shoulder.”
The horizontal bars in the lower plot show the range of exposure for SNRscene-ref = 20, 12, and 6dB.


The human vision perspective:
F-stop noise and scene (or scene-referenced) SNR

f-stop noiseThe human eye responds to relative luminance differences. That’s why we think of exposure in terms of zonesf-stops, or EV (exposure value), where a change of one unit corresponds to a factor of 2 change in exposure. The eye’s relative sensitivity is expressed by the Weber-Fechner law,

     Δ≈ 0.01 L  –or–  ΔL/L ≈ 0.01

where ΔL is the smallest luminance difference the eye can distinguish. This equation is approximate. Effective ΔL tends to be larger in dark areas of scenes and prints due to visual interference (flare light) from bright areas.

When light is encoded by a camera into pixel levels, the scene contrast is usually altered, as explained in Gamma, Tonal Response, and related concepts. Low contrast encoding would tend to have lower noise (and better Signal-to-Noise Ratio, SNR) than higher contrast cameras. Because dynamic range is based on the scene, we need to remove the camera’s encoding. The result is called scene-referenced noise or SNR with units proportional to the luminance level.

Expressing noise in relative luminance units, such as f-stops, corresponds more closely to the eye’s response than standard pixel or voltage units. Noise in f-stops = Nf-stop is obtained by dividing the noise in pixel level units by the number of pixel levels per f-stop. (We use “f-stop” rather than “zone” or “EV” out of habit; any are OK.) Note that 1 f-stop = 0.301 Optical density units = 6.02dB (decibels) = log2(luminance).

Nf-stop is the scene noise in (logarithmic) units of f-stops, and must be distinguished from linear scene noise, Nscene, which has the same linear units as scene luminance Lscene. For signal in pixels = S,

     \(\displaystyle \text{F-stop noise } = N_{f-stop} = \frac{N_{pixels}}{dS/d(\text{f-stop})} =  \frac{N_{pixels}}{dS/d(\log_2 ( L_{scene})}\)

     \(\displaystyle\text{Using   }\ \frac{d(\log_a(x))}{dx} = \frac{1}{x \ln (a)} \ ; \ \ \ \ \ d(\log_a(x)) = \frac{dx}{x \ln(a)} \)

     \(\displaystyle N_{f-stop} = \frac{N_{pixels}}{dS/dL_{scene} \times \ln(2) \times L_{scene}} ≅  \frac{N_{pixels}}{dS/dL_{scene} \times L_{scene}} \)

where Npixels is the measured noise in pixels and \(d(\text{pixel})/d(\text{f-stop})\) is the derivative of the signal (pixel level) with respect to scene luminance (exposure) measured in f-stops = log2(luminance)

ln(2) = 0.6931 has been dropped to maintain backwards compatibility with older Imatest calculations. Noting that luminance (exposure) is the signal level of the scene,

     \(\displaystyle \text{Scene noise} = N_{scene} = \frac{N_{pixels}}{dS/dL_{scene}} ≅ N_{f-stop} \times L_{scene} \) 

The key to these calculations is that the scene-referenced Signal-to-Noise Ratio, calculated from the measured signal S and noise Npixels must be the same as the scene SNR, which is based on Nscene, which cannot be measured directly.

     \(\displaystyle \text{Scene Signal-to-Noise Ratio} = SNR_{scene} = \frac{L_{scene}}{N_{scene}} = \frac{1}{N_{f-stop}} = \text{Scene-referenced SNR} = SNR_{scene-ref} \)

the equation for Scene-referenced noise, \(N_{scene-ref}\), which enables \(SNR_{scene-ref} = SNR_{scene}\) to be calculated directly from \(S/N_{pixels}\)  is given above.

Displays in Stepchart, Color/Tone Interactive, and Color/Tone Auto offer a choice between f-stop noise or Scene-referenced SNR (expressed as a ratio or in dB). Note that SNRscene-ref decreases as the slope of the tonal response curve decreases (often the result of flare light in dark patches).

The above-right image illustrates how the pixel spacing between f-stops (and hence d(pixel)/d(f-stop)) decreases with decreasing brightness. This causes f-stop noise to increase with decreasing brightness, visible in the figures above.

Since f-stop noise and scene-referenced SNR are functions of scene luminance, largely independent of image signal processing and fogging from flare light, they are an excellent indicators of real-world camera performance. They are the basis of Imatest Dynamic Range measurements.


Read More