This post is a guide to selecting test charts for the Imatest Color/Tone module. It describes general properties for all charts, then specific properties of each chart, including recommended uses, advantages and disadvantages.
|
Using Color/Tone Interactive (formerly Multicharts) – Interactive analysis of color & grayscale test charts Using Color/Tone Auto – Fixed (batch-capable) analysis of color & grayscale test charts Simatest: Overview – Concise introduction to Simatest: Imatest’s Camera/Image Signal Processing (ISP) simulator Image Sensor Noise – measurement and modeling – using raw files for image sensor Dynamic Range and Simatest Dynamic Range – a general introduction with links to Imatest modules that calculate it. |
General chart properties
Introduction – Chart list – Layout – Numbering – Media/materials – Reference values and files
| Color charts Imatest recommended Neutral Not recommended | ||||
| Colorchecker & variants | IT8.7 | ColorGray-44 | Colorchecker SG | ChromaDuMonde 28 |
| SFRplus 20-patch | UTT | Spyder Checkr | SMPTE/Hale bars | TE226 |
| General m x n | DreamCatcher 48 | ColorGauge 6×5 | RezChecker 6×7 | DR36+Color |
| eSFR color & grayscale | ISO 16505 color | |||
| Monochrome (B&W) charts Imatest recommended Neutral Not recommended | ||||
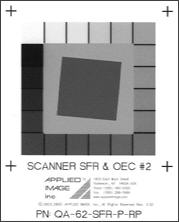
| ISO-14524 (ST-52) | QA-61 | QA-62 | ISO 15739 | EIA Grayscale |
| OECF 20-patch | Squares in circle | ITE Grayscale | QA-79 | General m x n |
| 36-Patch Dyn Rng | SFRplus grayscale | Contrast-Resolution | TE269 | Linear grayscale |
Introduction
|
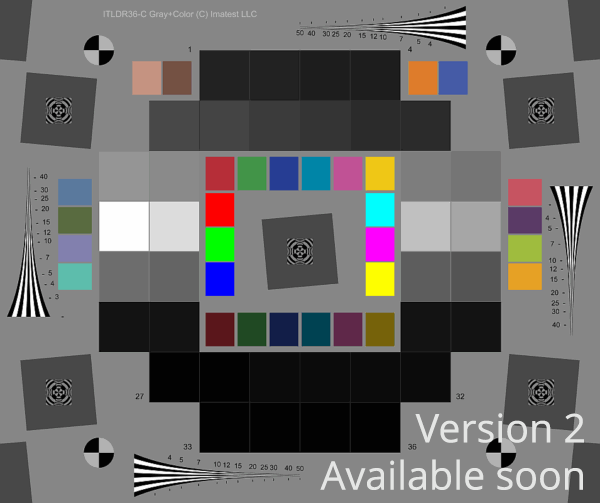
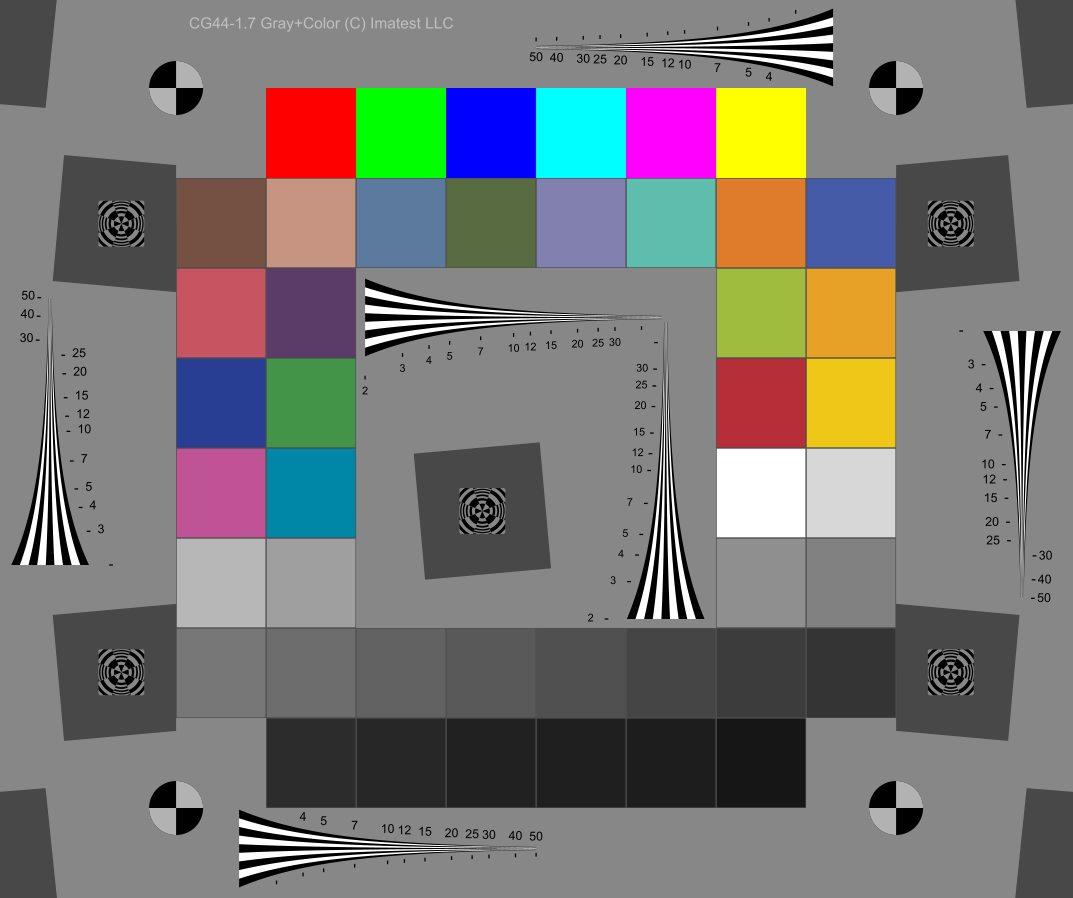
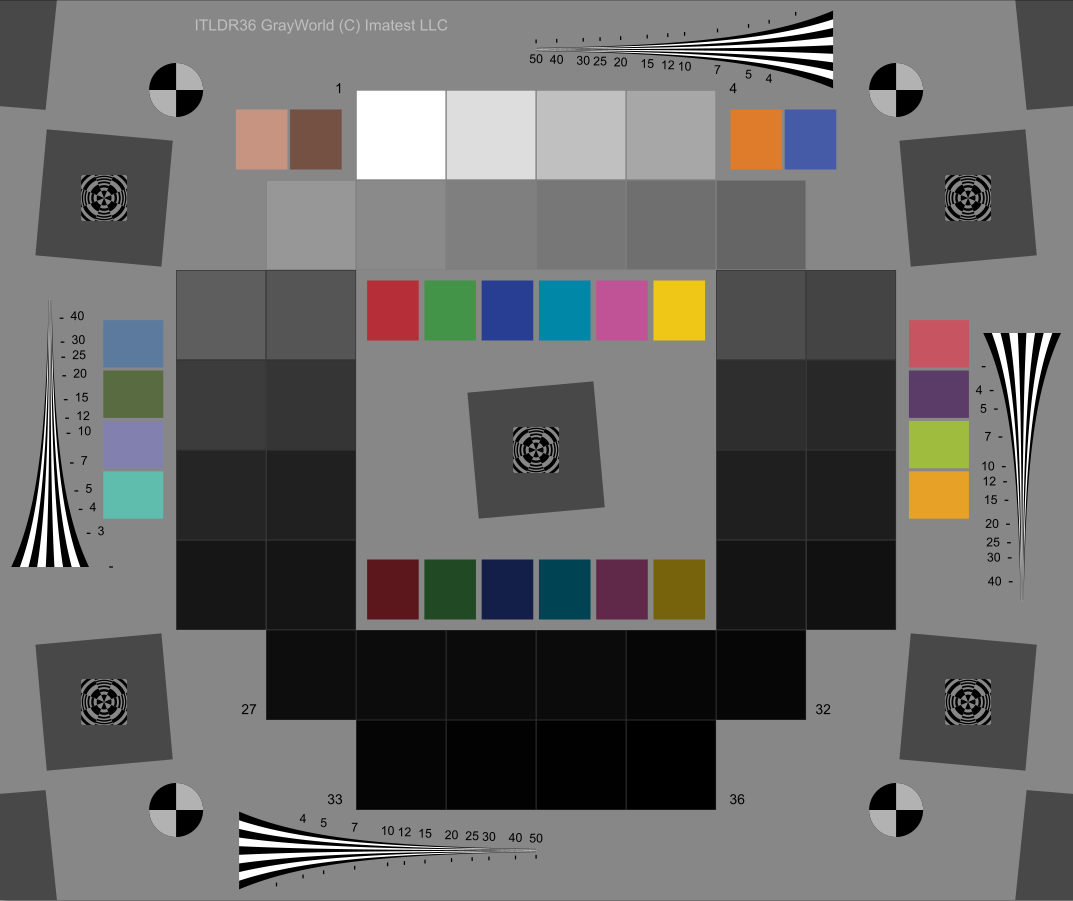
This page is a guide to using charts supported by the Color/Tone module (which can be run interactively or in Auto (batch-capable) mode). These charts are primarily designed to measure color response, tonal response, or dynamic range. It will become evident that we prefer multi-purpose charts, which are efficient in the use of space and testing time. For example, why have a chart with grayscale patches-only (there are many), when you can include colors, slanted edges and wedges (as we’ve done with the ColorGray-44 chart)? Right: the DR36+color chart is an enhanced version of the older 36-patch dynamic range chart that can analyze color patches (including saturated colors) and has a different patch brightness order that reduces the effects of reflections on dynamic range measurements. |
 |
|
Sharpness testing — For testing sharpness over the image surface, we recommend one of the four auto-detection slanted-edge modules: SFRplus, eSFR ISO, Checkerboard, and SFRreg. The first three are designed to fill the entire frame. Each has its own specific attributes, briefly listed here.
|
Chart list dropdown menu
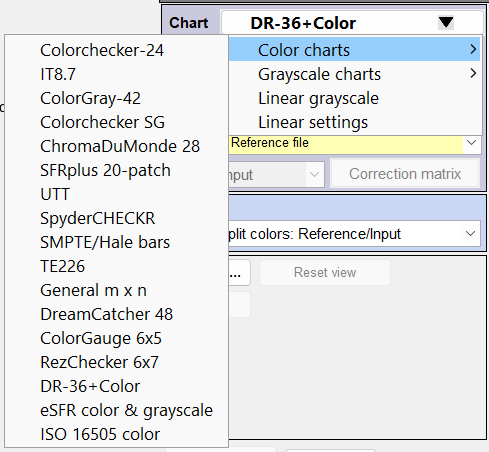
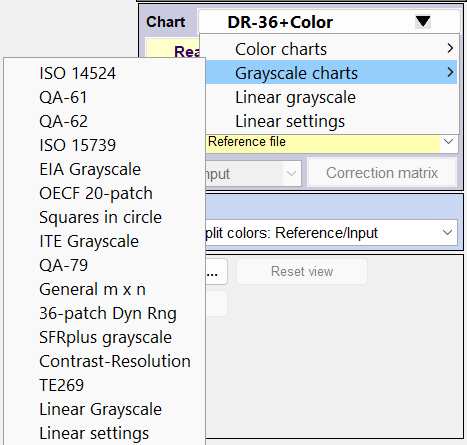
A list of chart analyses supported by Color/Tone can be obtained from the Color/Tone Auto dropdown menu on the left of the legacy Imatest main window or from the Chart dropdown menu on the right of the Color/Tone Interactive window.
 Color chart analysis: CIELAB (L*a*b*) reference values Color chart analysis: CIELAB (L*a*b*) reference values |
 Grayscale chart analysis: Density reference values Grayscale chart analysis: Density reference values |
None of the Color/Tone charts are designed to fill the full frame, at least for medium to high-resolution cameras.
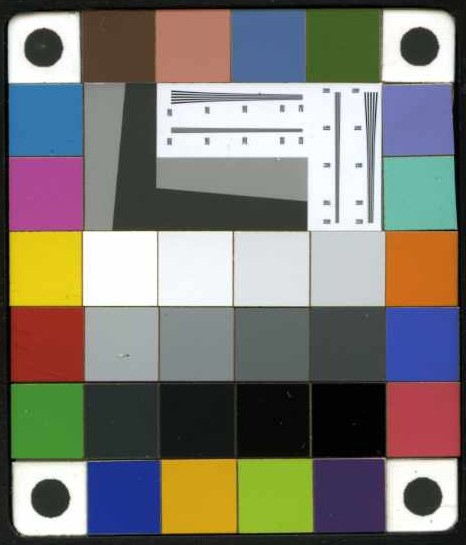
Chart layout & Test Charts module
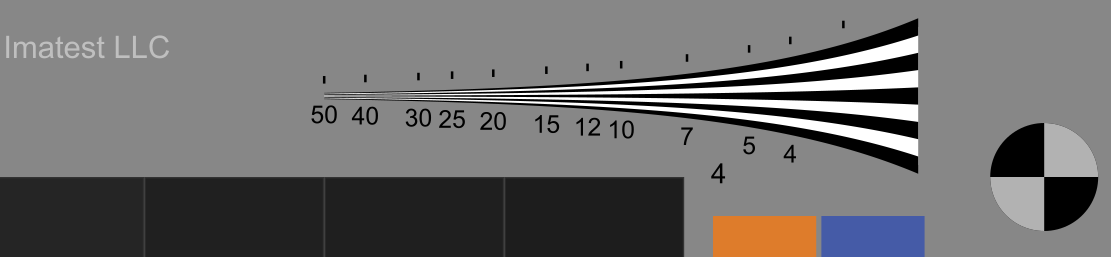
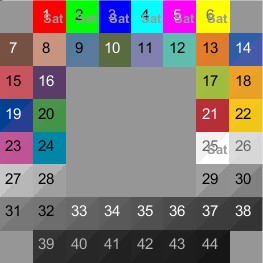
Some customers have asked for details of the chart layout, which are not needed for Imatest analysis. Chart geometry (i.e., details of the layout) can be found by running the Test charts module to create SVG or bitmap versions of the chart. Here is an example for the new (August 2025) DR36+Color chart for measuring Dynamic range and colors. It is created as an SVG (Scalable Vector Graphics) file. Charts with continuous tone or sinusoidal patterns are created as bitmaps, which have slightly different settings.
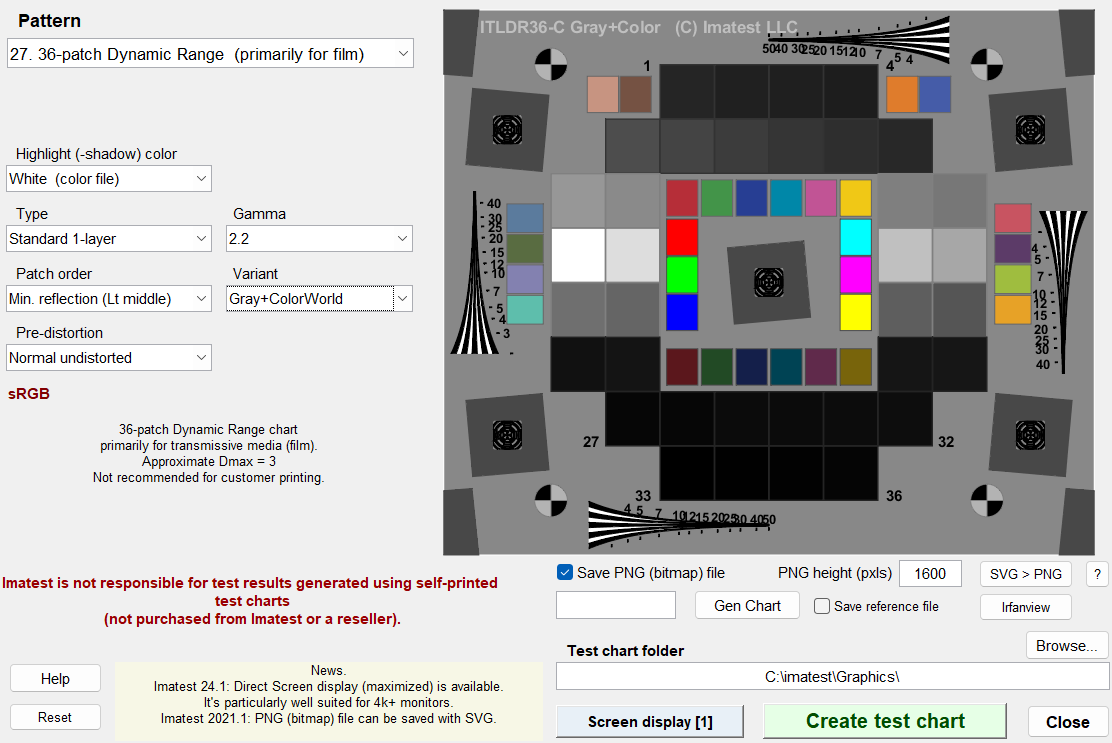 Test charts window for DR36+Color chart
Test charts was designed for creating files (in bitmap or SVG format) for printing inkjet charts. We don’t recommend customers printing their own charts unless they are highly skilled in fine printing and color management. Since it was primarily intended for internal use, it is less thoroughly documented than the analysis modules. SVG files can be opened, edited, measured, and converted to PNG bitmap files with Inkscape (a great free program). See Test Charts and SVG Test Charts for more detail.
Test charts notes — To get bitmap files from SVG charts, check Save PNG (bitmap) file , making sure to select a suitable image height. The preview image (shown above) does not accurately represent the chart. To obtain a high quality image, press Create test chart to save the chart file, then open SVG files in Inkscape or PNG (bitmap) files in a high quality image editor. Bitmap files can also be obtained by opening SVG files in Inkscape, then clicking File, Export…
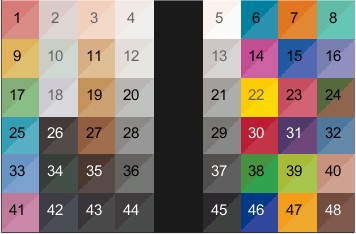
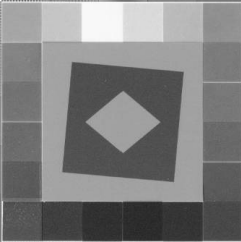
Here is a small portion of the above chart.
 Accurately reproduced portion of the above DR36+Color chart
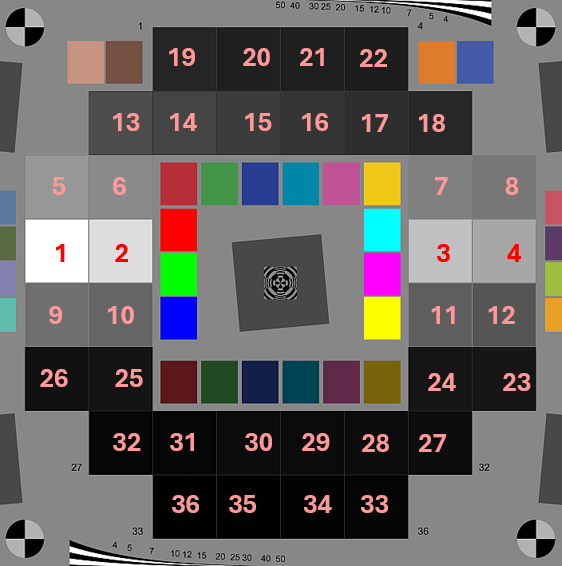
Patch order (Chart numbering)
You don’t need to know chart numbering for ordinary Color/Tone analysis, but it can be important if you are measuring chart patches or working with chart designs. Imatest charts based on rectangular grids are numbered row-major, starting from the top-left. To see the numbering, open the chart in Color/Tone, select the 3. Split colors: reference/Input display, and check Numbers (on the right).
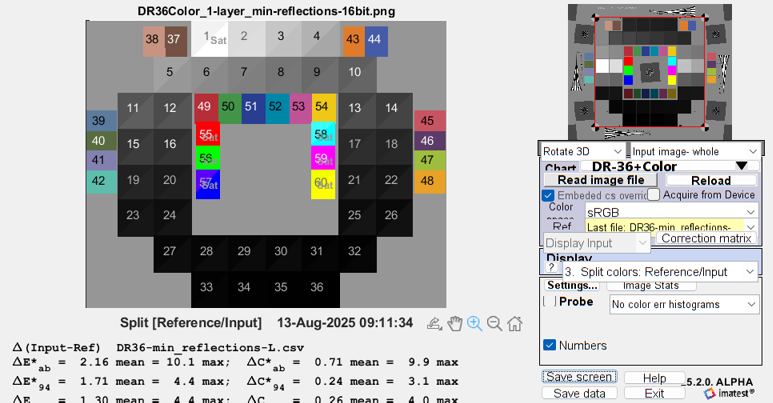
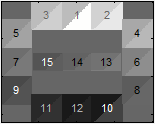
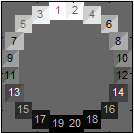
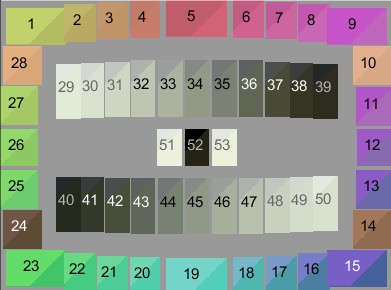
Numbering for the DR36+Color chart (a variant of the 36-patch Dynamic Range chart).
The window has been shrunk to make the numbering more visible.
The table below shows the patch order for several grayscale targets. Use these orders when creating a custom density file (full instructions on Measuring test chart patches).
|
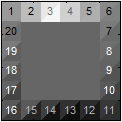
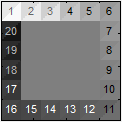
Orientation and numbering of patches for a few charts
|
||||
 |
 |
 |
 |
 |
 |
 |
 |
 |
 |
| SFRplus SQ-20 Grayscale | 36-Patch Dyn. Range | TE269 V3 |
||
 |
 |
 |
||
| ChromaDuMonde | ||||
Chart media/materials
Imatest and vendor-supplied test charts are produced in a variety of materials. some charts are available in one material; others (including most Imatest-designed charts) are available in a choice of materials. It’s important to know the attributes of the various materials when selecting a chart.
A key property of any chart material is the Maximum Optical Density, Dmax = –log10(light out/light in), where light out is the reflected or transmitted light, depending on the medium. Example: Dmax = 2 corresponds to 0.01 (1/100) of the light either transmitted or reflected. Dmax may be specified in other units. f-stops = 3.32×OD (familiar to photographers); decibels (dB) = 20×OD (familiar to electrical engineers).
| General media properties | |
| Reflective — semigloss or glossy |
Dmax between 2 and 2.3, but susceptible to specular reflections, especially for wide angle lenses. |
| Reflective — matte | Dmax around 1.5 (not quite deep black), but relatively immune to specular reflections. Never suitable for Dynamic Range. |
| Transmissive | Dmax typically around 2.8 per film layer (less with inkjet). Best for Dynamic Range measurements. |
|
Chart sharpness is less important for Color/Tone measurements than for SFR (MTF), but may still be of interest.
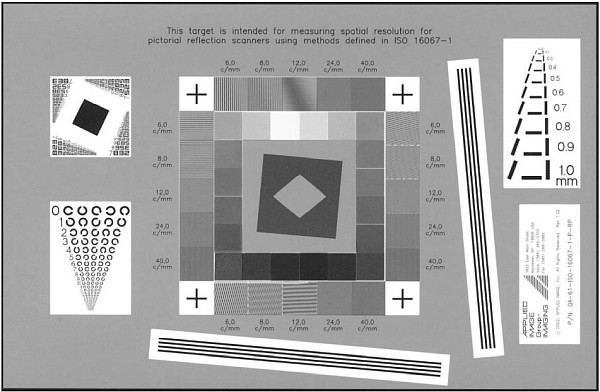
Test chart suitability for MTF measurements – charts for determining the MTF measurement suitability of several media types (inkjet and photographic; reflective and transmissive). Based on Chart Quality Calculator results.
|
|
| Specific material | Attributes | Dmax, notes |
| Inkjet (reflective) | Printed in-house by Imatest. Good stability and color consistency. Can be printed up to 44 inches (1.1 meters) high. Semigloss or matte surfaces. Available for visible-only or visible and NIR (Near Infrared). Let us know if you need NIR when ordering charts. |
2.0 ≤ Dmax ≤ 2.3 |
| Inkjet (transmissive) | Printed in-house by Imatest. Less sharp and lower Dmax than photographic film, but can be printed much larger. | Dmax < 2.0. (Better data needed.) |
| Photographic paper (B&W) reflective | Sharper (and more expensive) than inkjet charts, but color is not available. | Dmax ≅ 2.0. Available for a limited selection of charts (eSFR ISO, mostly). |
| Photographic paper (color) reflective | Not yet available: in development. We expect the charts to be sharper and less noisy than inkjet. | Expect Dmax ≅ 2.0 |
| Photographic film (B&W) transmissive |
Sharper than inkjet, but somewhat noisy (grainy), making it unsuitable for very tiny charts. Excellent for NIR and and SWIR. | Dmax ≅ 2.8 |
| Photographic film (color) transmissive |
Very sharp and low noise. Reference files required because of manufacturing inconsistencies. Only for visible light; transparent (useless) for NIR. | Dmax ≅ 2.8 per layer. A second or third layer is added to the bottom of ITWDR and ITUHDR charts. |
| VisNIR (halftone photomask) transmissive | Spectrally-neutral. Potential issues with uniformity. | Dmax ≅ 4.0. Useful for DR-36 Dynamic Range and eSFR ISO charts. |
| Chrome-on-glass transmissive |
Extremely sharp: good for microscopic imagery. Typically 2×2 or 4×4 inches (5×5 or 10×10 cm). Only two tones with 10:1 contrast. | Dmax = 1. Not for color or grayscale |
| Pigment patches (Pantone) | Stable, consistent, long-lived colors. Do not require a reference file (although they can be made where extreme accuracy is required). | Dmax = 1.5. Colorchecker 24-patch and SG, Colorgauge, Rezchecker |
Color and Density Reference values — default values and files
|
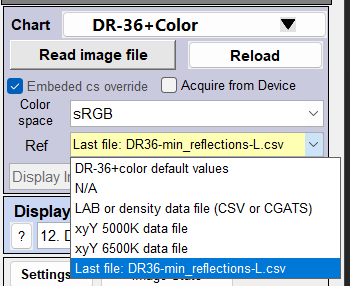
The color/density reference is selected in the Ref dropdown in the Chart area on the right of the Color/Tone window. The most useful settings are Default values (prefixed by the chart abbreviation) LAB or density data file (CSV or CGATS format; measured individually or in small batches). This opens a file selection window. The most recent file name (Last file), shown at the bottom, can be selected. [The xyY selections could be deprecated.] |
 |
|
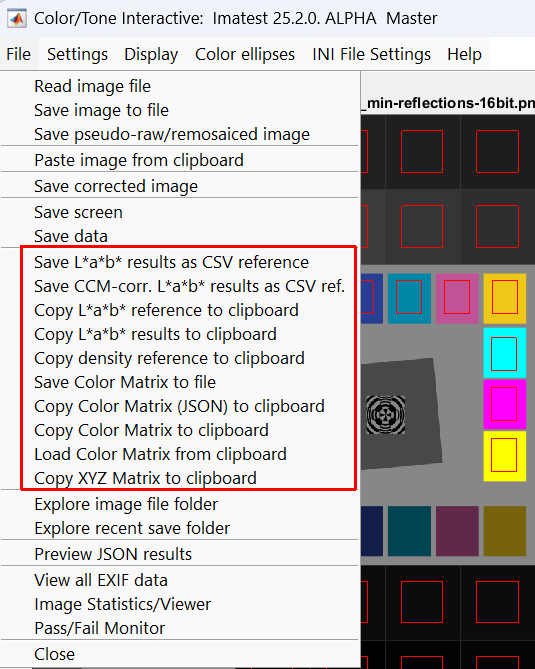
All charts have default reference files, which either contain CIELAB (L*a*b*) color values (for color charts) or optical densities (for many monochrome, i.e., black & white charts). Some charts work perfectly well with the default references, but photographic film charts, which are subject to significant manufacturing variation, require individually (or batch) measured reference files for accurate results. The values of the reference files can be found from the File dropdown on the upper-left of the Color/Tone window. Copy L*a*b* reference to clipboard are the two selections for obtaining the current (default or selected) reference file for pasting into a text editor. To create your own reference file, you’ll need to follow the instructions in Measuring test chart patches with a spectrophotometer. To remove a patch from the analysis, enter L*a*b* values = {0,0,0}. This is done in the Rezchecker reference file to omit patches in the corners and near the center from the analysis. The other selections of the File dropdown are worth exploring. |
 |
Summary / Recommendations
The Summary (recommendation) for each chart has a color-coded background. You will note that we have a definite preference for multi-purpose charts that are efficient in the use of space and testing time. For example, why have a chart with grayscale patches-only, when you can include colors, slanted edges and wedges (as we’ve done with the ColorGray-44 chart)?
| Recommended | Imatest’s recommended charts: should be considered when starting a project. |
| Neutral | Not our first choice, but may be recommended or required by vendors or customers (some are related to standards) |
| Not recommended | Obsolete charts (some requested long ago by a single customer), or cases where better charts are available. |
Color charts
These charts are used for color measurement. Most of the contain grayscale patterns as well. Reference values are in CIELAB (L*a*b*) format. None of the color (or grayscale) charts are intended to fill the frame for medium to high resolution cameras. (Only eSFR ISO, SFRplus, and Checkerboard charts are designed to fill the frame.)
Colorchecker & variants
| Description — The 24-patch Colorchecker is the best-known, best-documented and most widely-used color chart. It is currently distributed by Calibrite, but in the past it has been manufactured or sold by Gretag, Macbeth, and X-Rite. (Many people still use the old names.) It consists of 4 rows and 6 columns of pigment-based matte patches, which have very consistent CIELAB color values. The top two rows resemble real-world colors and the third contains BGRYMC primaries with low saturation. The fourth row contains grayscale patches with densities from 0.05 to 1.5. The colors are familiar to many photographers. | 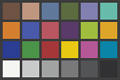 |
- Printed on Pantone matte pigment color patches, mounted on stiff board. A4-sized (8.1 x 11.375 in. — 20.57 x 28.9 cm).
- The Imatest Colorcheck page contains a lot of useful information, but the legacy Colorcheck module should be avoided because Color/Tone is far more powerful and versatile.
- X-Rite’s sRGB and CIE L*a*b* values from 2009 are on xritephoto.com/documents/literature/en/ColorData-1p_EN.pdf .
- Danny Pascale/BabelColor’s Colorchecker page and RGB coordinates of the Macbeth ColorChecker are outstanding resources that contain X-Rite’s and Pascale’s Colorchecker values, which are very close.
- Variants
- The Colorchecker Classic Nano is composed of the same materials, but is much smaller: 1.75″ x 1.0″ x 0.1″.
- The Colorchecker Classic Mini (“credit card-sized”) may be worth considering.
- The tiny Colorgauge and Rezchecker charts are composed of the same Pantone patches, differently arranged. Available in several sizes. Popular for endoscopes and other medical applications
- The Transmissive Color Target, made on color film, comes in two sizes: Medium – 235 mm x 196.9 mm (9.25″ x 7.75″) and Small – 117.5 mm x 98.4 mm (4.625″ x 3.875″). A density reference file is required. It includes registration marks outside the four corners.
- The new (September 2025) ColorGray-44 and DR36+Color targets include Colorchecker colors as well as highly saturated RGBCMY colors.
Summary — The 24-patch Colorchecker or one of its variants is the chart of choice for standard color measurements or for including in natural scenes.
IT8.7
Summary — The IT8.7 was an interesting design, but because of the lack of interest and uncertain availability, we cannot recommend the IT8.7. Use the Colorchecker SG instead. |
Summary — The new ColorGray-44 chart, which can be printed in several sizes and media is promising for a number of applications, especially for endoscopes.
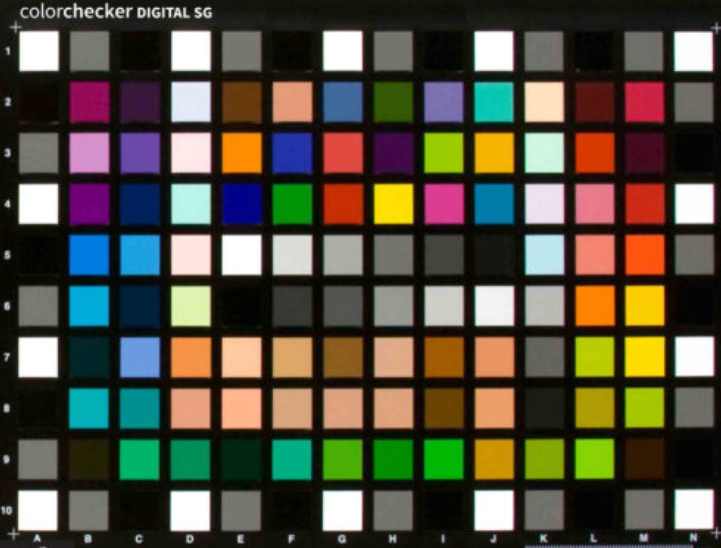
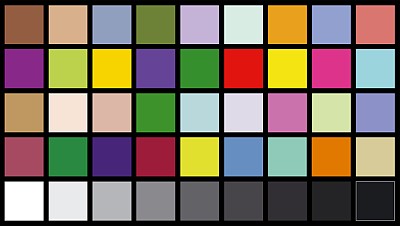
Colorchecker SG (semigloss)Contains 140 patches on a 14×10 grid. The top-center (rows 2-5, columns 5-10) has a replica of the Colorchecker Classic (24-patches), with slightly more saturated colors, and the bottom-center (rows 7-8, columns 4-10) have 14 skin tone patches. Printed on Pantone semigloss (SG) pigment color patches, mounted on stiff board. A4-sized (8.1 x 11.375 in. — 20.57 x 28.9 cm). The small patches may not be ideal for noise measurements. More detailed results than needed for most color analyses, but recommended by several standards. Summary — The Colorchecker SG has 140 stable pigment-based patches, great color detail, and 14 skin tone patches. It is recommended in some standards, and where more color detail is required than can be obtained from 24 patches. |
 |
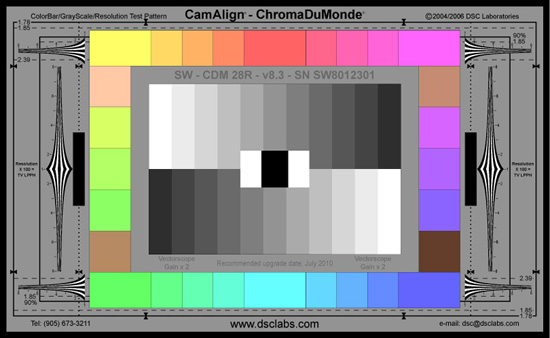
ChromaDuMondeContains 6 saturated primary (RGBCMY), 18 intermediate, and 4 skin tone colors. Glossy surface. Several sizes. Mounted on sturdy metal backing. The primary and intermediate colors are useful for making hexagonal vectorscope displays (for calibrating video systems). From DSClabs, which was sold in 2025, and has moved from Toronto to Los Angeles. The Imatest ColorGray-44 chart contains similar primaries. Summary — Of interest to a few customers. Several other charts are better suited for most Imatest analyses. |
 |
|
SFRplus 20 patch — The color patches from the SFRplus chart. Shown with patch numbers on the right. Generally, the analysis in the (Rescharts) SFRplus module is sufficient. The patches can be small. eSFR ISO is a better chart if color results are needed. Summary — Not recommended for Color/Tone. |
 |
|
Summary — Not recommended for camera testing — there are better choices. |
 |
|
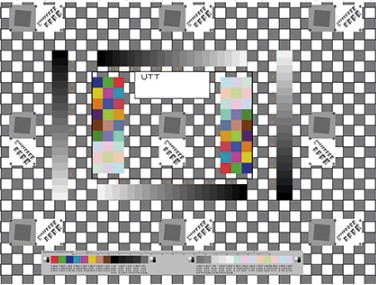
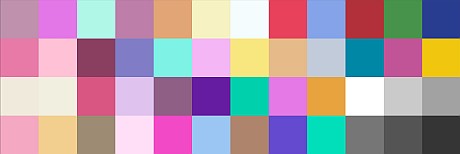
Spyder Checkr — A small chart that competes with the Colorchecker. Should be oriented as shown. If you want to measure only half the chart (say, left or right), you’ll need to create a reference file with L*a*b* data available here. Very nice looking. The colors, which are similar to the Colorchecker, appear to be slightly more saturated (not verified). There are also additional skin tones. Summary — Nice design, but it hasn’t gotten much traction because the Colorchecker is so well entrenched. |
 |
| SMPTE / Hale bars — Old TV color bars, added in 2010 at the insistence of one customer. Hale Color Charts no longer exists. To be deprecated. Summary — Useless |
 |
|
TE226 — A rarely used chart that could be analyzed as a General m × n (9×5) chart. Summary — There are plenty of other charts (Colorchecker 24-patch, SG, etc.) that could be used instead. |
 |
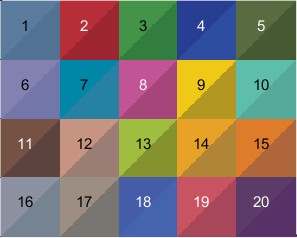
 General m x n — Grid chart with m rows × n columns, specified by clicking Settings, then entering the number of rows (m) and columns (n) on the lower-right of the Settings window. A 4×12 example is shown on the right. The Colorchecker (24-patch and SG), Colorgauge, and TE226 are all special cases. A CSV or CGATS reference file containing density or CIELAB (L*a*b*) values is absolutely required. (The default reference is a simple grayscale that won’t match any chart.)
Redundancy — General m×n charts are in both color and monochrome sections. They are identical.
If you have a spectrophotometer you can create a custom reference file (CGATS format) using techniques described in Measuring test chart patches.
Summary — Valuable when a new m×n chart not supported by Imatest needs to be analyzed.
| DreamCatcher 48 — An interesting chart formerly made by DSClabs, but now discontinued. We doubt it’s still in use. Summary — Discontinued; will eventually be removed. |
 |
ColorGauge and RezcheckerProfessional grade miniaturized targets made by Image Science Associates in cooperation with Munsell Color Services from the same 18 pigments as the ColorChecker. Also has 12 unique spectrally neutral glossy or matte gray patches for measuring dynamic range, tones, and noise. The RezChecker slanted-edges have exceptionally high quality. Suitable for close up and macro photography. |
 |
 |
The Rezchecker version sold by Imatest has circles in all four corners to facilitate automatic detection.
Popular for testing medical endoscopes.
Reference data for the version with matte grayscale patches (max density = 1.485), also available here, is built into Color/Tone. You can download reference file for the chart with glossy grayscale patches (max density = 2.42) here, NIST-certified reference files (based on individual measurements) available. NOTE: Pre-25.1, the default reference in Color/Tone is the glossy version.
Total chart sizes — Color gauge Pico: 0.375 × 0.4375″; Nano: 0.6875 × 0.6875″; Micro: 1.3750 × 1.6250″; Rezchecker Micro: 1 7/8”× 1 5/8”; Nano: 1 × 7/8″; More details on the store pages.
The patches are mounted on aircraft-grade anodized aluminum and are set below the top surface to help protect from damage.
Summary — Excellent choices for small fields of view. Especially popular for medical endoscopes.
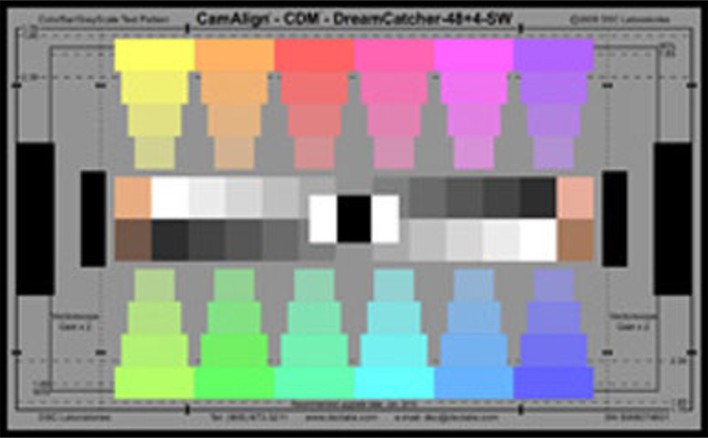
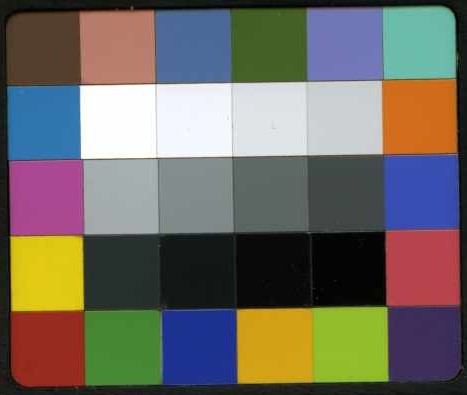
DR36+Color
The DR36+Color (36-patch Dynamic Range + color) chart (new, September 2025) is a variant of the older SDR-36 Dynamic Range chart with several enhancements, some of which are selectable when the chart file is created. It maintains full compatibility with the older chart, i.e., patches 1-36 have the same numbering and location. It is a transmissive film chart with one, two, or three layers The enhancements are
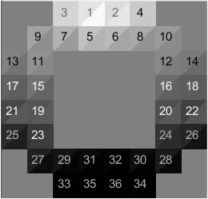
- [Option — recommended] The new grayscale patch is designed to minimize the damage to measurements caused by radially-symmetric reflections (around the lens’s optical axis). The old patch order is still available. Rows 1-5 (which are single layer-only) increase in density from left to right. Rows 6-8, which can have two or three layers, increase in density from right to left. In the old chart, light from patch 1 (the lightest patch on the upper-left) could reflect on the darkest patch (36; lower-right), causing significant interference.
There is a striking example of this issue in A review of IEEE P2020 noise metrics (direct link to the PDF), where the chart had to be photographed tilted and off-center to avoid reflections in the critical darkest patches. -
The color patches above the center of the chart and to the left and right of the grayscale patches have been widened and had their colors altered to resemble patches 1-18 of the Colorchecker.
New grayscale patch brightness order (The old order is still available.)
- [Option] Six highly saturated RGBCMY colors can be added for color analysis.
- The new grayscale patch order and added saturated RGBCMY colors are optional: selectable when the chart file is made.
- Four logarithmic wedges have been added to the single-layer chart, and two smaller wedges have been added to the 2 or 3-layer charts, replacing patterns of small white squares inside black rectangles.
The CIELAB (L*a*b*) reference file includes all patches: grayscale 1-36 and color 37-60. Patches 37-60 can be analyzed for color.
It can be pre-distorted to work better with highly barrel-distorted cameras.
Summary — DR36+Color charts with the new patch brightness order are upgrades to the older DR-36 family of charts that reduce radially-symmetric reflections that can affect measurements and allow colors to be analyzed. It will become Imatest’s primary recommendation for Dynamic Range analysis.
|
eSFR color & grayscale — The color patches from the eSFR ISO chart, which is normally measured with the (Rescharts) eSFR ISO module, where the whole chart (mostly) fills the frame. Shown with patch numbers on the right. Because both color and grayscale patches are included, it can be used for calculating a Color Correction Matrix (CCM), though other charts, like the Colorchecker, may be preferred. Summary — Sometimes useful for getting additional results from an eSFR ISO chart image. |
 |
 ISO 16505 color — for the ISO 16505 standard for automotive Camera Monitor Systems. Available in several sizes. A poor color chart design.
Summary — Poor design; should only be used to meet specific requirements related to the ISO 16505 standard.
Monochrome (B&W) charts & analyses
All of these charts contain grayscale patterns. Some may contain color, which isn’t analyzed when any of the grayscale chart analyses are selected. What they have in common is that their patches are characterized by Optical Density (OD = –log2(light out/light in), which is generally easier to measure than CIELAB (L*a*b*) color values. There are some apparent duplicates with the color section, above (General m x n, 36-patch Dynamic Range charts).
A problem with several of these charts, including the six charts below, is that they are designed for a single measurement: grayscale tones and noise (and Signal-to-Noise Ratio, SNR), because they were derived from a standard or technical specification that focused on a single issue. They are not efficient in the use of space of testing time. At Imatest, we design charts for multiple measurements so that customers don’t have to set up separate charts for measurements that can be done perfectly well with one image. Some examples are
- eSFR ISO (mostly for Rescharts analysis), which primarily maps sharpness (MTF or SFR) over the image surface, but also contains patches for measuring color, tone, SNR, and vanishing resolution (from wedges).
- Color Gray 42 (new, September 2025), which also color, tone, SNR, sharpness (MTF or SNR), and vanishing resolution from logarithmic wedges.
|
Summary — Use only to fulfill specific customer requirements. Not recommended for new work. |
|
|
Summary — Use only to fulfill specific customer requirements. Not recommended for new work |
 |
|
Summary — Use primarily to fulfill specific customer requirements. Multi-purpose charts are far more efficient. |
 |

EIA halftone grayscale ST-51 — 2″ square chart that consists of pairs of linear grayscales in opposite orientations. Details on the Imatest product page. Rarely used.
Summary — Use only to fulfill specific customer requirements. Not recommended for new work
ITE grayscale — reflective chart that consists of pairs of linear grayscales in opposite orientations. Two versions: Type I: gamma = 0.45 and Type II: gamma = 1.0. Maximum contrast ratio ≅ 40:1. When ITE Grayscale is selected, chart type (gamma) can be selected in Color/Tone Auto Settings. Default reference values: Gamma = 0.45: 1.70 1.31 1.08 0.87 0.71 0.56 0.43 0.34 0.24 0.15 0.08; Gamma = 1: 1.70 1.00 0.74 0.58 0.46 0.37 0.30 0.23 0.18 0.13 0.08 Rarely used.
Summary — Use only to fulfill specific customer requirements. Not recommended for new work
 QA-79 (Microsoft WebCam Image Quality Test Chart) — Only 8 density patches. Zero industry traction.
Summary — Use only to fulfill specific customer requirements. Not recommended for new work
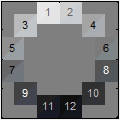
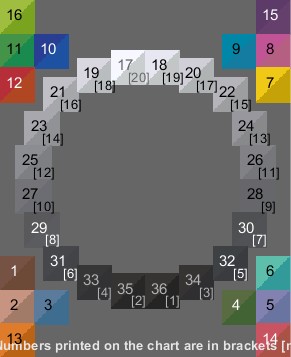
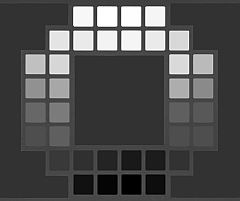
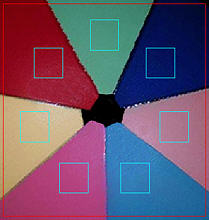 Squares in a circle (“pie charts’) [Erroneously placed in the monochrome chart section, even though it performs full color analysis. To maintain compatibility it will stay.]
Shown on the right with region selections. The number of regions can be set by selecting Squares in a circle in the Color/Tone Auto settings. Patch numbering is clockwise, starting with the top patch (for an odd number of patches) or the right patch of the top row (for an even number).
Summary — Not a standard chart, but customers occasionally need this analysis.
 OECF 20-patch
A family of charts with different values of Dmax derived from ISO 14524. Included in most eSFR ISO charts, but not recommended by itself. OK for reflective charts, but we discourage its use for Dynamic Range measurements because the density interval between patches (for versions with high Dmax, i.e., transmissive charts) is too high for reliable measurements. Use one of the 36-patch charts instead.
Summary — Not recommended as a standalone chart (though it’s an important part of eSFR ISO charts), or for Dynamic Range measurements but a few customers use it.
General mxn
Grid chart with m rows × n columns, specified by clicking Settings, then entering the number of rows (m) and columns (n) on the lower-right of the Settings window. A 4×12 example is shown on the right. The Colorchecker (24-patch and SG), Colorgauge, and TE226 are all special cases. A CSV or CGATS reference file containing density or CIELAB (L*a*b*) values is absolutely required. (The default reference is a simple grayscale that won’t match any chart.)
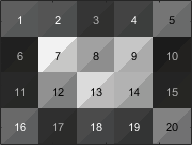
 The ISO 21550 dynamic range chart, consisting of 24 grayscale patches on 35mm file, shown on the right with patch numbers (in an unusual order), is an excellent example. Reference file (Optical Density 0-4): ISO-21550_0-4_reference
Redundancy — General m×n charts are in both color and monochrome sections. They are identical.
If you have a spectrophotometer you can create a custom reference file (CGATS format) using techniques described in Measuring test chart patches.
Summary — Valuable when a new m×n chart not supported by Imatest needs to be analyzed.
DR-36 — 36-patch dynamic range chart
 The DR-36 is Imatest’s classic dynamic range chart — actually, a family of charts on color photographic film or VisNIR photomask media with 1, 2, or 3 layers, where the extra layers cover the bottom three rows. Active area for the color film charts (designated IT*DR36) is 197mm × 235mm (7.75 × 9,25 inches).
| Chart | Layers | Approx. Dmax |
| ITLDR36 | 1 | 50 dB |
| ITWDR36 | 2 | 100 dB |
| ITHDR36 | 3 | 150 dB |
| VISNIR-LR36 | 1 | 80 dB |
| VISNIR-UHDR36 | 2 | 160 dB |
VisNIR charts are spectrally neutral (they’re monochrome) and can be made much larger than the standard IT*DR36 film charts if needed.) Details of available options are on the store page. We focus on new (September 2025) features and options below.
New options
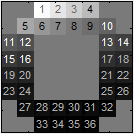
- The old patch brightness order (brightness decreasing top to bottom in row-major order) is shown here. The new patch order, shown above in DR36+Color, is recommended because it minimizes measurement errors caused by radially-symmetrical reflections.
- The saturated RGBCMY color patches, shown above in DR36+Color, are omitted here. Only the chart densities need to be measured for grayscale analysis, not the CIELAB colors, which are more difficult and costly to measure. If the system’s color response is required, the added expense of measuring the colors will be worthwhile.
New features
- The colors near the patches similar to the Colorchecker colors. In the older version, they were darker versions of the RGBCMY colors below row 2.
- Logarithmic wedges have been added to the sides, top, and bottom of the single layer charts. Smaller wedges have been added to the sides of the 2 and 3-layer charts, where they replace patterns of white squares on a black background, intended to show short-distance stray light (veiling glare). The change does not affect the analysis.
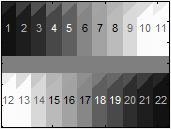
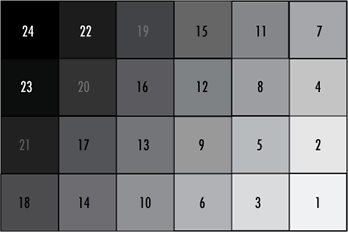
SFRplus grayscale — the grayscale from SFRplus charts, which are designed to fill the frame. Normally analyzed by Rescharts. Shown with patch numbers. Designed so the outer patches are darkest to facilitate pattern detection. Patch 7 is lightest. Densities: [0.95 1.05 1.45 1.25 0.75 1.85 0.05 0.45 0.25 1.95 1.65 0.55 0.15 0.35 1.75 0.85 1.55 1.15 1.35 0.65]
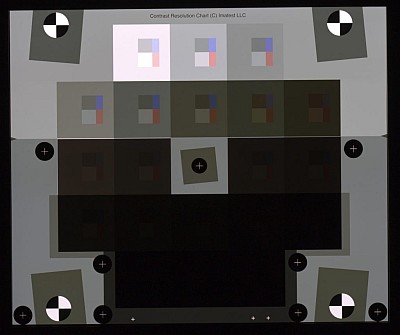
Contrast-ResolutionTwo-layer Transmissive chart for measuring the visibility of low (2:1) contrast features inside larger fields over a wide tonal range. A better indication of true usable Dynamic Range than traditional measurements. Works in the presence of tone mapping. Described in detail in Contrast Resolution and Dynamic Range. Summary — Valuable for measuring the Dynamic Range using the the visibility of small objects. |
 |
 TE269 — A 36-patch transmissive Dynamic Range chart not manufactured by Imatest, but fully supported. Patches are more neutral than the Imatest DR-36 charts, but this makes little difference in measurements, though some customers are concerned. You can choose between the original version and the newer TE269V2 or V3, which have the same geometry as the Imatest 36-patch DR chart but different numbering, in a dropdown menu in the Chart configuration area of the ROI Options window. Three reference files are available, derived from data on the manufacturer’s website: TE269A | TE269B | TE269C.
Summary — Although we prefer the Imatest DR-36 charts, we support the TE269 because several customers use it. We will support updated versions with different patch orders.
Linear grayscales
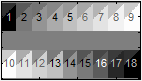
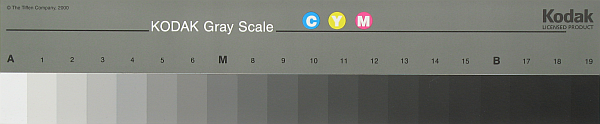 The Kodak Q13/Q14 reflective grayscales were the first gray scale step charts supported by Imatest. They are nicely made, but we prefer charts with circular patterns because linear charts are susceptible to light falloff, which increases with the radius from the center of the image. Nevertheless, there is a frequent need to support linear charts such as the DSClabs Xyla.
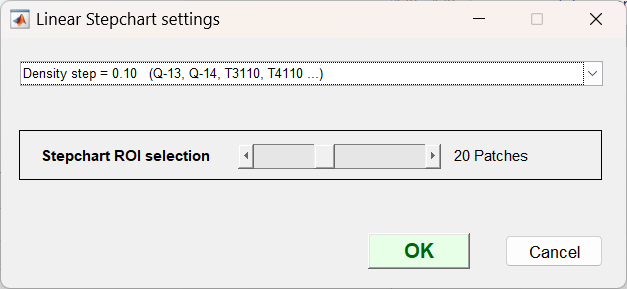
When you open Linear grayscale, the following window opens (full window on the left; density settings on the right).
 |
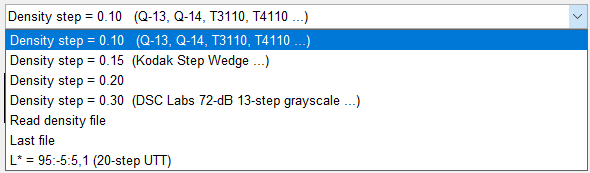 |
Select the appropriate density setting and number of patches, then continue reading the file and selecting the regions.
Summary — Although we recommend grayscale step charts with a circular (rather than linear) geometry, these charts occasionally show up and need to be analyzed.
