New infrared test charts and analysis software modernize testing of infrared cameras
Once viewed as exotic devices, infrared camera systems have moved into the mainstream in many industries, particularly in security and defense. From night-vision helmets, scopes, and security cameras to ballistic missile tracking telescopes, IR cameras have become as commonplace as they are mission-critical. As with other advanced technologies, quality control is key to successful development and application of IR camera systems, with the quality of the image itself being paramount to most organizations.
For companies that produce IR cameras, image quality testing may be required at many stages in the value chain: component parts (e.g., IR sensors, lenses) must be compared to determine which is best suited for a given product; alternative R&D prototypes must be evaluated; image quality in pre-production runs must be assessed; and final products coming off the manufacturing line must meet pass/fail quality thresholds.
Likewise, organizations that use IR camera systems typically need to benchmark competing supplier devices, conduct acceptance testing on random samples of supplied products, and verify proper camera functioning after setup and periodic maintenance. Furthermore, there is a need for standardized test equipment and procedures to monitor system performance over the extended life cycle of modern infrared cameras. All of these tasks depend on an ability to accurately measure and document image quality.
Despite widespread use of IR systems, technologies for evaluating IR image quality have lagged well behind similar technologies in use for visible light camera systems. The typical process for testing the image quality of a visible-light camera system involves acquiring an image of a test chart with known image properties (e.g., sharp edges, precisely known colors, parallel lines), then analyzing it using sophisticated software algorithms. Objective image quality metrics such as sharpness, chromatic aberration, color accuracy, and distortion are computed in this way.
A key requirement for analyzing image quality is the presence of adequate contrast in the captured image. Without contrast, image edges cannot be detected and analyzed to determine important image qualities such as sharpness. IR camera systems present a challenge for software-based image quality analysis because: a) it is difficult to predict what materials will produce contrast at various infrared wavelengths; and b) IR cameras capture both reflected and emitted light, so, depending on the IR wavelengths captured, combinations of emitted and reflected light can result in a captured image having little contrast, thereby preventing software-based analysis of key image qualities.
To test IR cameras, a number of companies have developed specialized test chart substrates and coatings that deliver contrast in required IR wavelengths. These charts, however, suffer from three major limitations.
- Outdated test chart patterns: Companies producing IR test charts have adopted the 1951 USAF Resolution test chart pattern or similar such patterns. Unfortunately, this pattern was designed for measuring sharpness before the advent of both digital cameras and software packages for analyzing digital image quality, so it relies on subjective human perception (i.e., eyeballing it) to determine sharpness based on which lines on the chart are visible to a person. The pattern is poorly suited to computer-based analysis because it contains only vertical and horizontal lines, which cannot be analyzed to objectively measure sharpness, distortion, noise, or other important image quality factors.
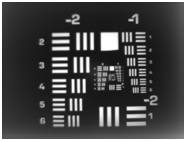
1951 USAF Resolution test chart captured using an infrared camera - Cost and Size: Because of the high cost of materials used to produce IR charts, the charts are typically small, often not exceeding 100 square inches. This size limits applicability for testing many IR camera systems, as the small test chart does not fill enough of the field of view of the camera, so much of the imaging plane is not tested. In many cases, the materials used to make these small charts cannot scale to large size (e.g, 2400 square inches) at any cost.
- Environmental: Most existing charts are designed exclusively for laboratory environments. Consequently, they do not support testing in the field where many infrared systems are routinely operated. For many installations, performing diagnostics in-situ is much more convenient and preferred over removing instrumentation from the field for laboratory evaluations.
Recently, Imatest LLC (Boulder, CO, www.imatest.com), a company well-known for delivering image quality analysis software and test charts for visible-light cameras, has partnered with the United States’ military’s White Sands Missile Range (WSMR) and Vandenberg Air Force Base (VAFB) to deliver a test chart that overcomes these limitations. The military is a major end user of infrared technologies and the government makes sizeable investments in state-of-the-art IR cameras and imaging systems each year. Although a wide range of tools have been available to support performance testing of visible cameras for years, very few products have been designed to support the growing number of infrared imaging systems. Consequently, military test ranges like WSMR and VAFB must often develop custom test capabilities at significant cost to the government. Imatest responded to requests from engineers at WSMR and VAFB for a system that could measure, analyze, and document infrared system performance in both lab and field operating environments.
Imatest’s popular SFRplus test chart pattern, which is designed specifically to enable computer-based analysis of a variety of image quality factors, was adopted to resolve the problem of outdated test chart patterns. This pattern supports analysis of sharpness, distortion, noise, and chromatic aberration.
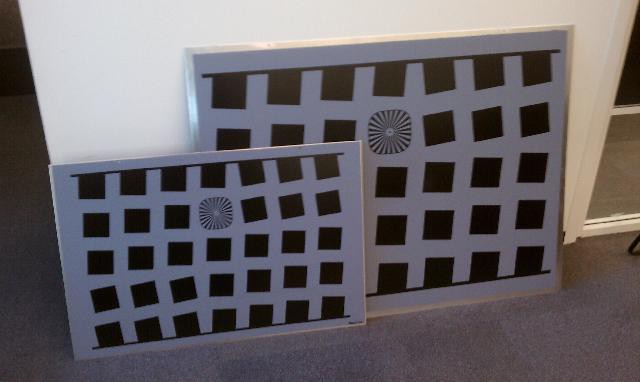
Medium Wavelength Infrared (MWIR) test charts with SFRplus pattern
Imatest’s CEO said “the problem of finding a substrate and coating for the chart that 1) delivered acceptable contrast in IR wavelengths, 2) could be produced in the larger sizes needed to test many IR camera systems, 3) was durable in harsh outdoor environments, and 4) was substantially less expensive than available IR charts, proved to be challenging. Ultimately, a sturdy aluminum substrate was used and a durable infrared coating was developed by mixing infrared pigments with special enamels.” The resulting test chart supports a wide range of wavelengths, from visible light through the mid-wave infrared region (MWIR) of the electromagnetic spectrum. Most modern optical systems generally fall into four broad categories based on the spectral response of their detectors and lenses: visible (VIS, 400-700 nm), short-wave infrared (SWIR, 900-1500 nm), mid-wave infrared (MWIR, 3 – 5 um), and long-wave infared (LWIR, 8-12 um). The new chart has been tested and found to work well with high-speed visible cameras, SWIR cameras, and MWIR cameras. “We are pleased with the results though MWIR wavelengths and are working on related test charts to support LWIR wavelengths.”
The table below shows early test images captured using a visible light camera, an SWIR camera, and an MWIR camera. Darker pigments in the central square show up easily against the lighter background in both visible and SWIR bands. However, contrast depends more on emissivity than color in MWIR imagery and materials were carefully selected to exploit this property at longer wavelengths. Besides being visibly darker, the center square coating exhibits higher emissivity at MWIR wavelengths than the surrounding light-colored background. This yields very good contrast for MWIR imagers as seen in the image on the far right. Most notably, required contrast is clearly visible in all three of the images, which underscores the multi-spectral application of this particular test pattern design.
 |
 |
 |
| Image from visible light camera | Image from SWIR camera | Image from MWIR camera |
At MWIR wavelengths, the temperature of the test chart impacts the level of contrast in a captured image. Because MWIR imagers primarily detect and display thermal radiation, increasing the temperature can enhance contrast between high emissivity coatings and low emissivity coatings on the test chart. A change of approximately 10-20 degrees Celsius transforms the contrast from an unusable level, shown on the left in the table below, to a level well suited for computer based analysis. Necessary heating can be achieved through either solar heating (e.g., when the test chart is used outdoors during the daytime), or through use of heating pads (e.g., at night or in an indoor test lab).
 |
|
| MWIR image captured using an unheated test chart. |
MWIR image captured using test chart heated to approximately 45 degrees Celsius |
Analyzing infrared image quality
After an image of the Infrared SFRplus test target is captured, it can be analyzed using Imatest Master or Image Sensor software, which implements image quality test algorithms now widely used in the testing of visible light camera systems. The software is able to recognize the Infrared SFRplus test chart pattern and automatically select relevant regions of interest for analysis. Objective measurements of key image quality factors are then computed by the software. Results for three key factors — sharpness, distortion, and noise — are described below.
Sharpness, arguably the most important image quality factor, is the factor most closely related to the amount of detail an image can render. Sharpness is defined by the boundaries between zones of different tones or colors. The relative contrast at a given spatial frequency (output contrast/input contrast) is called the Modulation Transfer Function (MTF) or Spatial Frequency Response (SFR). Two of the best indicators of perceived image sharpness are the spatial frequencies where MTF is 50% of its low frequency value (MTF50) or 50% of its peak value (MTF50P). These numbers are often the same, but they may differ for strongly sharpened systems. Other measures of sharpness are often desired (e.g, MTF20, the spatial frequencies where MTF is 20% of its low frequency value, which is closer to the traditional vanishing resolution (roughly MTF10, which is often obscured by noise or above the Nyquist frequency).
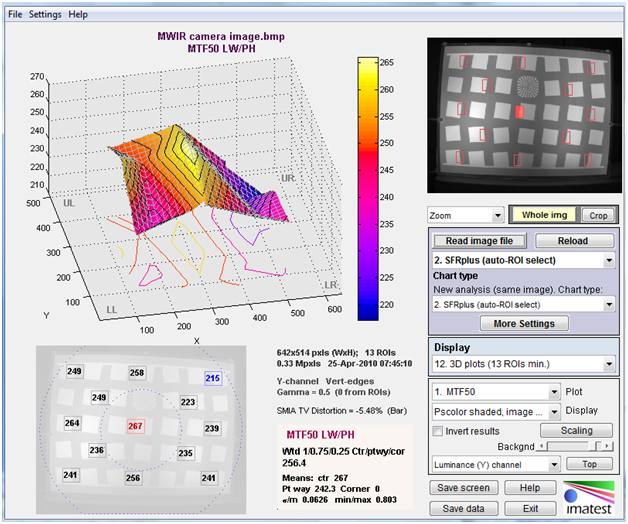
Because of the many slanted edges in the SFRplus test chart pattern, sharpness can be easily measured across the imaging plane, as show in the figure below. It is immediately obvious that sharpness is greatest in the image center and falls off towards the edges of the image, a common result in many camera systems. More detailed information about the sharpness of each vertical edge selected for analysis is also provided by the software and is reported as the mean edge and MTF response.
Distortion
Distortion is an aberration that causes straight lines to curve, and has two forms, barrel and pincushion, as illustrated below. Distortion tends to be most serious in extreme wide angle, telephoto, and zoom lenses. It can be highly visible on tangential lines near the boundaries of the image, but it is not visible on radial lines. In a well-centered lens, distortion is symmetrical about the center of the image. Lens distortion is reported by the software using the metric SMIA TV Distortion, measured in this image at -5.48%, as shown with sharpness results in the figure above.
None |
Barrel |
Pincushion |
Noise
Noise, defined as a random variation of image density, arises from basic physics and can never be completely eliminated. Increases in noise degrade image quality. Noise is commonly reported as a signal-to-noise ratio as shown in the figure below.

Practical Application
The versatile Infrared SFRPlus chart has many practical applications. One surfaced early during the development and testing of the chart. When a prototype chart was sent to White Sands for field evaluation with a modern MWIR imaging system, post-test analysis of the captured imagery with Imatest software revealed a slight defocus error. The focus error was investigated and attributed to a loose back focus mechanism on the IR lens, which had gone previously undetected. “Ironically, a simple test constructed to evaluate the chart’s performance, actually ended up revealing significant information about the camera’s performance” said Kevin Norwood, a senior systems engineer with New Mexico Technology Group (NewTec), who made the measurements at WSMR. He went on to add, “tools like this finally afford the same level of quality assessment and control in the infrared realm as what’s been readily available in the visible realm for years. I fully expect to see significant improvements in the quality of infrared imaging at WSMR as a result of this development effort.”
Summary
Advances in infrared test charts and analysis software reported here have the potential to transform infrared camera testing by enabling modern visible-light image quality testing practices to be applied to testing of infrared camera systems. These advances will benefits the wide range of companies that design, manufacture, review, buy, and sell infrared cameras.